
Multi-modal Bike Sensing for Automatic Geo-annotation
Geo-annotation of Road/Terrain Type by Participatory Bike-sensing
Steven Verstockt
1
, Viktor Slavkovikj
1
, Pieterjan De Potter
1
, Jürgen Slowack
2
and Rik Van de Walle
1
1
Multimedia Lab – ELIS Department, Ghent University - iMinds,
Gaston Crommenlaan 8, bus 201, Ledeberg-Ghent, Belgium
2
Barco NV, President Kennedypark 35, 8500 Kortrijk, Belgium
Keywords: Multi-modal Sensing, Image Classification, Accelerometer Analysis, Geo-annotation, Mobile Vision,
Machine Learning, Bike-sensing.
Abstract: This paper presents a novel road/terrain classification system based on the analysis of volunteered
geographic information gathered by bikers. By ubiquitous collection of multi-sensor bike data, consisting of
visual images, accelerometer information and GPS coordinates of the bikers' smartphone, the proposed
system is able to distinguish between 6 different road/terrain types. In order to perform this classification
task, the system employs a random decision forest (RDF), fed with a set of discriminative image and
accelerometer features. For every instance of road (5 seconds), we extract these features and map the RDF
result onto the GPS data of the users' smartphone. Finally, based on all the collected instances, we can
annotate geographic maps with the road/terrain types and create a visualization of the route. The accuracy of
the novel multi-modal bike sensing system for the 6-class road/terrain classification task is 92%. This result
outperforms both the visual and accelerometer only classification, showing that the combination of both
sensors is a win-win. For the 2-class on-road/off-road classification an accuracy of 97% is achieved, almost
six percent above the state-of-the-art in this domain. Since these are the individual scores (measured on a
single user/bike segment), the collaborative accuracy is expected to even further improve these results.
1 INTRODUCTION
Mobile phones have increasingly evolved in
functionality, features and capability over the last
decade. Nowadays, they are being used by many for
more than just communication. With the continuous
improvement in sensor technology built into these
'smartphones', and web services to aggregate and
interpret the logged information, people are able to
create, record, analyze and share information about
their daily activities. As such, the mobile phone is
well on its way to become a personal sensing
platform (Goldman et al., 2009).
Within this mobile sensing (r)evolution, phone
users acts as sensor operators, i.e., they contribute
sensor measurements about their activities or the
places they visit as part of a larger-scale effort to
collect data about a population or a geographical
area (Srivastava et al., 2012). This is the idea behind
participatory or human-centric sensing. By
combination of mobile data from large groups of
individuals, it is possible to derive new values for
end users in ways that the contributor of the content
even did not plan or imagine and to perform
functions that are either difficult to automate or
expensive to implement.
Recently, the tendency of participatory data
gathering has also started to occur in the domain of
geographic information systems (GIS). Where the
process of mapping the Earth has been the task of a
small group of people (surveyors, cartographers, and
geographers) for many years, it starts to become
possible now for everyone to participate in several
types of collaborative geographic projects, such as
OpenStreetMap and RouteYou (Haklay and Weber,
2008). These projects are built upon user generated
geographic content, so called volunteered
geographic information (VGI). VGI makes it easier
to create, combine, and share maps and supports the
rapid production of geographic information. One
drawback, however, is that a lot of the work still
involves manual labor. Within our work we focus on
how mobile sensors can help to automate and
facilitate the more labor-intensive VGI tasks.
A common task performed by recreational GPS-
39
Verstockt S., Slavkovikj V., De Potter P., Slowack J. and Van de Walle R..
Multi-modal Bike Sensing for Automatic Geo-annotation - Geo-annotation of Road/Terrain Type by Participatory Bike-sensing.
DOI: 10.5220/0004531100390049
In Proceedings of the 10th International Conference on Signal Processing and Multimedia Applications and 10th International Conference on Wireless
Information Networks and Systems (SIGMAP-2013), pages 39-49
ISBN: 978-989-8565-74-7
Copyright
c
2013 SCITEPRESS (Science and Technology Publications, Lda.)

users is to find good routes in an area, where the
quality of a route is mainly based on safety,
efficiency, and enjoyment (Reddy et al., 2010a).
From all the route characteristics, the road quality,
i.e., the physical condition of the terrain, and the
road/terrain surface showed to have a significant
impact on how the users rank their routes. Currently,
however, this information is largely unavailable. In
order to bridge this gap, there is need for automatic
road classification. Within this paper, we investigate
the ability to determine the current road/terrain type
from 'onboard' mobile sensors (i.e., from a
smartphone mounted on a bike). Contrarily to
manual VGI, our automatic approach facilitates real-
time updates/annotation, e.g. when road conditions
change or when new roads are found. Furthermore,
by using common phones, it is not required to buy
expensive, specialized sensing equipment, keeping
the costs very low.
A general overview of the proposed setup is
shown in Figure 1. Smartphone and GPS data are
collected using the onboard device(s) mounted at the
bike’s handlebar. For the camera sensor, the
terrain/road needs to be in the field-of-view of the
camera. For the collection of the accelerometer data,
the device can be placed or stored as wanted by the
user. Based on the multi-sensor data, the road/terrain
type is estimated using the novel multi-modal RDF-
based classification algorithm, which is fed with a
set of discriminative image and accelerometer
features. Finally, a geographic map can be annotated
automatically using this road/terrain information.
The remainder of this paper is organized as
follows. Section 2 presents the related work in
mobile-sensing for GIS road/terrain classification.
Subsequently, Section 3 proposes our novel
road/terrain classification method, based on
accelerometer and visual features which are fed to
the RDF. Next, Section 4 presents the experimental
setup and discusses the data collection, ground truth
(GT) creation and evaluation strategy/results.
Finally, Section 5 ends this paper with conclusions.
2 RELATED WORK
Current mobile-sensing solutions for GIS
road/terrain classification either use accelerometer
data or visual images. Although they can easily (and
successfully) be combined, the combination of both
sensor types is not yet investigated.
Based on the observation that traversing different
terrain types induces different vibration signals,
Weiss et al., (2006) use an accelerometer mounted
on a vehicle (i.e., a robot) to perform vibration-based
road classification. To train and classify the
vibration signals they fed a set of distinctive
accelerometer features to a Support Vector Machine
(SVM), which was shown to outperform alternative
classification methods. Although they achieve
around 80% correct classifications, the speed of the
vehicle is not realistic (i.e., too slow) and the
experiments were performed in a ‘controlled’
environment. The set of accelerometer features,
however, is well-chosen and will (partly) be used in
our set-up. A similar SVM-based approach is
presented by Ward and Iagnemma (2009), where the
algorithm is validated with experimental data
collected with a passenger vehicle driving in real-
world conditions. The algorithm is shown to classify
multiple terrain types as correctly with 89%.
However, they make use of expensive, specialized
sensing equipment to achieve this accuracy and the
classifier was only trained to recognize four very
distinctive classes. When the classes vibration
behavior would be closer to each other, e.g., when
comparing tiles to cobblestones and asphalt to
gravel, confusion of classes is expected to be higher,
leading to lower accuracy. By using visual features,
in addition to the accelerometer data, we are able to
tackle this problem.
Tang and Breckon (2011) classify urban, rural
and off-road terrains by analyzing several color and
texture features (some are similar to ours). They
report a performance of almost 90% correct
classification on the road/off-road problem, also
using SVM classification.
A drawback of the method of Tang and Breckon,
however, is the genericity of the on-/off-road
classes, i.e., too broad for recreational purposes, and
the strict positioning of the camera zones. Similar
limitations arise in (Popescu et al., 2008).
Interesting, however, is that these authors split up
the image into small regions and perform a ‘voting’
over these regions. In this way, conflicting or
confusing zones can (probably) be detected and
eliminated, leading to higher classification accuracy.
Furthermore, it is also important to mention that the
majority of the visual classification approaches use
an 'unrealistic' set-up, i.e., sharp images containing a
single terrain type captured from a perpendicular
camera angle. Our approach, on the opposite, uses
images from real bike runs, containing blurred
images with non-sharp terrain boundaries. As such
our accuracy of 92% is a 'real-life' accuracy.
Although SVM has shown to perform best in the
majority of the related work, Khan et al., (2011)
recently showed that Random Decision Forests
SIGMAP2013-InternationalConferenceonSignalProcessingandMultimediaApplications
40

Figure 1: General overview of the multi-modal bike sensing setup.
Figure 2: Multi-sensor RDF-based terrain classification.
(RDF) improve the SVM results in the context of
road/terrain classification. This hypothesis was also
confirmed by SVM-RDF comparisons performed on
our experimental data. A gain of 7% was achieved
when using RDF instead of SVM for visual
classification. For accelerometer classification, the
gain was lower, however, still 2%. As such, RDF,
which is an ensemble classifier consisting of a
collection of individual decision tree predictors, is
used in our work. As an alternative, Relevance
Vector Machines (RVM) are also gaining
importance (Yogameena et al., 2010). RVM yields a
formulation similar to SVM with probabilistic
classification similar to RDF. In future research, we
will study its performance in terrain classification.
3 MULTI-SENSOR TERRAIN
CLASSIFICATION
The multi-modal bike sensing system is built upon
Multi-modalBikeSensingforAutomaticGeo-annotation-Geo-annotationofRoad/TerrainTypebyParticipatory
Bike-sensing
41

three sensing components: an accelerometer, a
digital camera, and a GPS. Each of these sensors
independently and concurrently captures surface
terrain data. Based on this multi-modal data, the
proposed terrain classification system tries to
estimate which type of terrain (asphalt,
cobblestones, tiles, gravel, grass, and mud) the
vehicle is currently traversing.
A general scheme of the classification system is
shown in Figure 2. First, the raw sensor data is pre-
processed. The windowing groups the vibration data
into overlapping data fragments of 5 seconds and
aligns them onto the corresponding images and the
GPS data. The images are also split into blocks in
order to detect/eliminate conflicting or confusing
zones, as in the work of Popescu et al., (2008).
Subsequently, we further process/analyze the sensor
data to create a set of training and test feature
vectors (which is discussed in detail in Section 3.1).
Next, the training vectors are used to construct a
random forest of binary decision trees (as explained
in Section 3.2). Finally, the test vectors are classified
using the trained RDF. Based on the RDF class
probabilities and the corresponding GPS data, geo-
annotation of test data can be performed.
3.1 Feature Extraction
For each of the sensor data segments, i.e., for each 5
seconds of biking, we extract a set of discriminative
visual and vibration features which best describe the
road/terrain conditions. The selection of these
features is based on the state-of-the-art (SOTA)
study (discussed in Section 2), and on our test data
evaluation (~Section 4). When features show a
similar behaviour, the feature with lowest
computational cost is chosen.
3.1.1 Accelerometer/Vibration Features
Figure 3 shows some samples of the accelerometer
readings for the different road/terrain types. It is
easy to see that not every road type does have a
distinct pattern, e.g., the differences between tiles
and grass are limited. Similar ‘feature equalities’
occur in the visual domain, however, not between
the same pairs of road/terrain types. As such, by
performing a multi-modal analysis it is expected that
the ambiguities in the vibration data can be
compensated by the visual data, and vice versa.
The accelerometer of our mobile device(s)
detects the vibration along the X, Y and Z‐axes (see
Figure 3). Important to remark is that, depending on
the position of the device, {x,y,z} coordinates
will vary and will complicate the classification task.
In order to overcome this obstacle, of forcing the
user to place the device in a pre-defined position, the
magnitude m of the acceleration is calculated:
222
zyxm
(1)
Computing (and analyzing) the features on the
vibration magnitude m, instead of on the individual
accelerometer data along the X, Y and Z‐axes,
enables our system to assume a random and possibly
changing orientation for the mobile device, i.e.,
increases the user’s freedom.
The set of features which were found to best
describe the bike vibrations are a combination of the
once proposed in (Weiss et al., 2006) and (Reddy et
al., 2010b), and are defined as follows:
- µ(m): mean of m - for flatter/smoother surfaces
(e.g. asphalt), µ(m)is low (close to 0).
- max(m): maximum of m - takes large values
for terrain types that contain big bumps, e.g.,
cobblestones and grass/mud.
- min(m): minimum of m - takes larger values
for flat terrains (e.g., asphalt).
- σ(m): standard deviation of m - is higher for
coarse terrain types (e.g., gravel) than for
smoother ones (such as tiles and asphalt).
- ||
m ||: norm of m - is large if the acceleration is
constantly high, as it is for cobblestones.
- E(m): energy, i.e., squared FFT sum of m (Ravi,
2005) - takes larger values for coarse terrain
types, such as grass, mud and gravel.
It is important to remark that each of these vibration
features is calculated over a sliding overlapping time
window of 5 seconds, in order to align them with the
visual features which are discussed hereafter. A
similar windowing approach has demonstrated
success in previous work (Bao and Intille, 2004).
Table 1: Exemplary accelerometer features for each of the
investigated terrain types.
Table 1 shows exemplary accelerometer feature
values for each of the investigated terrain types. This
SIGMAP2013-InternationalConferenceonSignalProcessingandMultimediaApplications
42
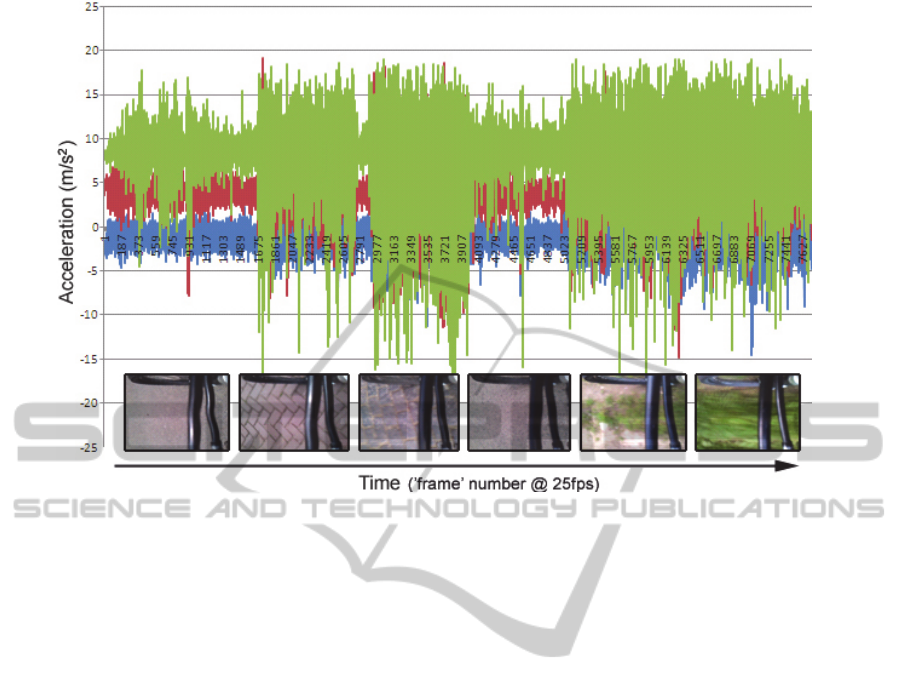
Figure 3: Exemplary accelerometer data along the X, Y and Z‐axes. Visual images of corresponding terrain types are shown
below the graph.
makes clearer the relation between each of the
features and the road/off-road terrain types.
3.1.2 Visual Features
Some of the investigated terrain types are hard to
recognize using an accelerometer (see evaluation
results - Section 4). Since these terrains have similar
vibration behaviour, it is not always possible to
distinguish between their feature values. Visual
features can help to overcome these problems. The
other way around, accelerometer features can help to
cope with (possible) visual ambiguities. Multi-modal
combination of visual and vibration features is, as
such, a win-win.
The set of visual features that has been found to
be most appropriate for the terrain classification
task, consists of color-, texture-, edge- and energy-
based measures. In total, 8 features are used (each of
them calculated on the camera image I). They are
defined as follows:
- blue(I): percentage ‘blue’ pixels based on
HSV-blue range – for cobblestones and asphalt,
for example, blue(I) is close to 1.
- green(I): histogram spread of ‘green’ HSV
pixels – takes large values for grass.
- mud(I): percentage low-saturated ‘orange-red’
HSV pixels – is large for mud and some types of
brown colored gravel.
- gray(I): percentage pixels that meet the gray
RGB equality criteria (i.e., R ≈ G ≈B) - is higher
for road types (e.g., asphalt and cobblestones)
than for off-road ones (such as grass and gravel).
- E(I): FFT energy spread of I – is large if the
terrain image has a lot of high energy texture, as
it is for grass and cobblestones.
- Hough(I): Hough Transform based number of
distinct edge directions in I – is only high for
tiles and cobblestones.
- EOH(I): MPEG-7 Edge Orientation Histogram
based spread of edges in I (Pinheiro, 2009) -
takes large values for terrain types with random
edge distribution, such as grass and gravel.
- GLCM(I): Product of gray-level co-occurence
matrix (Ershad, 2011) statistics of local binary
pattern (Pietikäinen et al., ) filtered image of I –
is high for cobblestones and off-road terrains.
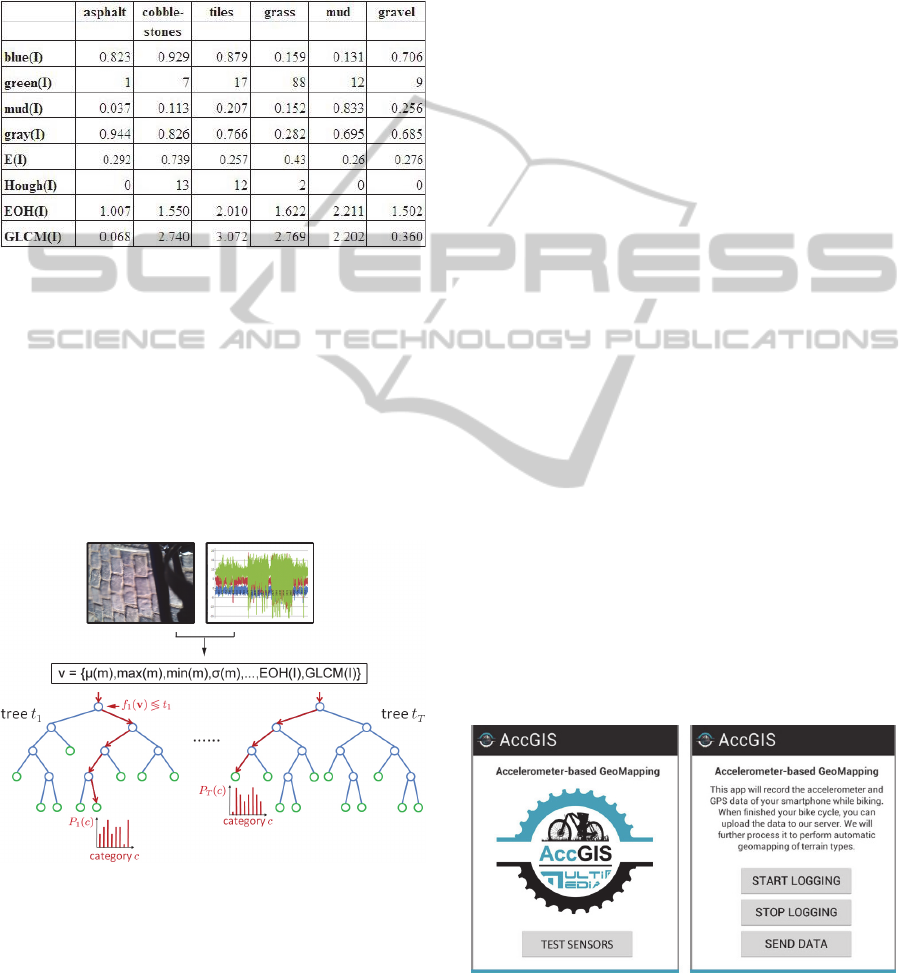
Similar to the accelerometer features in Table 1,
Table 2 shows exemplary visual feature values for
each of the investigated terrain types. This makes
clearer the relation between each of the visual
features and the road/off-road terrain types and also
shows the ‘feature equalities’ in vibration and visual
domain, e.g., the GLCM(I)- µ(m)similarity.
After generation of the visual and vibration
features, they are divided into training and testing
vectors. The training vectors are used to construct a
Multi-modalBikeSensingforAutomaticGeo-annotation-Geo-annotationofRoad/TerrainTypebyParticipatory
Bike-sensing
43
random forest of binary decision trees (discussed
hereafter). The test vectors will be evaluated using
this RDF classifier, in order to retrieve the accuracy
of the overall terrain classification system.
Table 2: Exemplary visual features for each of the
investigated terrain types.
3.2 RDF Classification
Random Decision Forests (RDF) is a very fast tool
for classification and clustering, which has shown to
be extremely flexible in the context of computer
vision (Gall et al., 2012). The most known
application of RDF is the detection of human body
parts from depth data in the Microsoft KINECT
(Shotton, 2011). This commercial application
demonstrates the practicability of RDF for large-
scale real-world computer vision problems.
Figure 4: The random forest consists of a set of trees that
map the multi-modal feature vector v to a distribution
Pi(c) stored at each leaf. The disks indicate split nodes that
evaluate one of the features of v and pass it to the right/left
child until a leaf is reached (Shotton et al., 2009).
The accuracy of RDF is comparable with other
classifiers. Furthermore, Khan et al., (2011) recently
showed that RDF improves SVM in terrain
classification tasks. Other advantages of RDF are its
simple training and testing algorithms, and the fact
that is can easily perform multi-class classifications.
Random forests are ensembles of randomized
decision trees T
n
, as illustrated in Figure 4. Each of
the N
tree
trees consists of split nodes and leaves
which map the multi-modal feature vector v to a
distribution P
i
(c) stored at each leaf. The split
nodes evaluate the arriving feature vector and
depending on the feature values, pass it to the left or
right child. Each leaf stores the statistics of the
training vectors. For a classification task, it is the
probability for each class c, denoted by P(c|v):
tree
N
n
n
vcPvcP
1
)|()|(
(2)
For a more general discussion on random forests, we
refer to the book of Breiman (2001) and the tutorial
of Shotton et al., (2009).
4 EXPERIMENTAL SETUP AND
EVALUATION RESULTS
In order to evaluate the proposed architecture we
have performed several bike tours. During these
tours we collected the training/test data and
annotated them with the ground truth (GT). Based
on this GT, we evaluated the test data while varying
the number of trees (N
tree
) and the sample ratio r
(i.e., the percentage randomized training vectors
used in each tree construction). Recently, we have
also launched a bike app (shown in Figure 5) to
extensively test the proposed set-up and collect more
test data. Further development/testing will be
performed on the user collected field data.
Figure 5: Accelerometer-based GeoMapping bike app.
SIGMAP2013-InternationalConferenceonSignalProcessingandMultimediaApplications
44
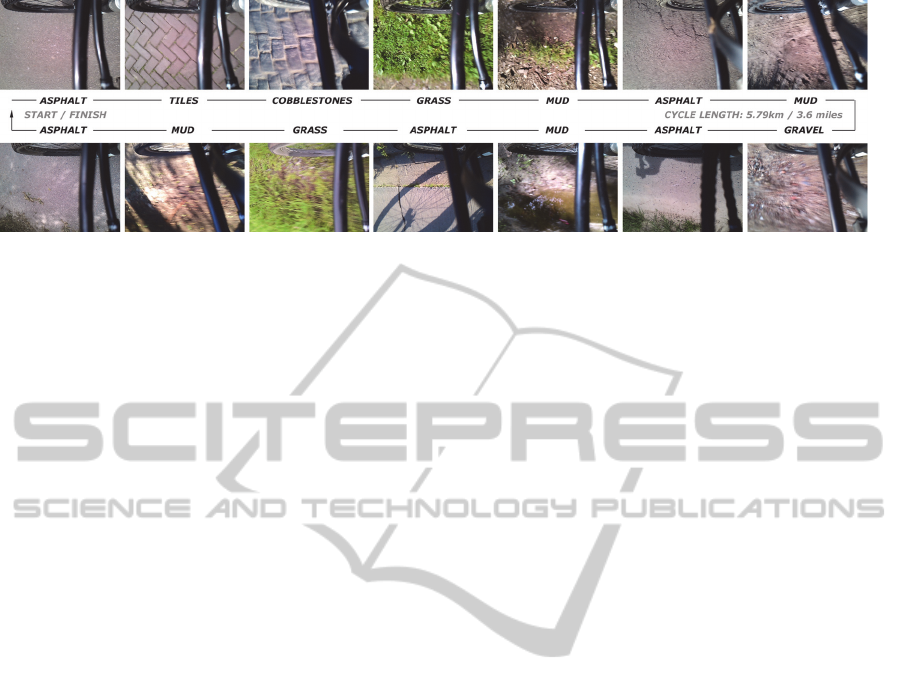
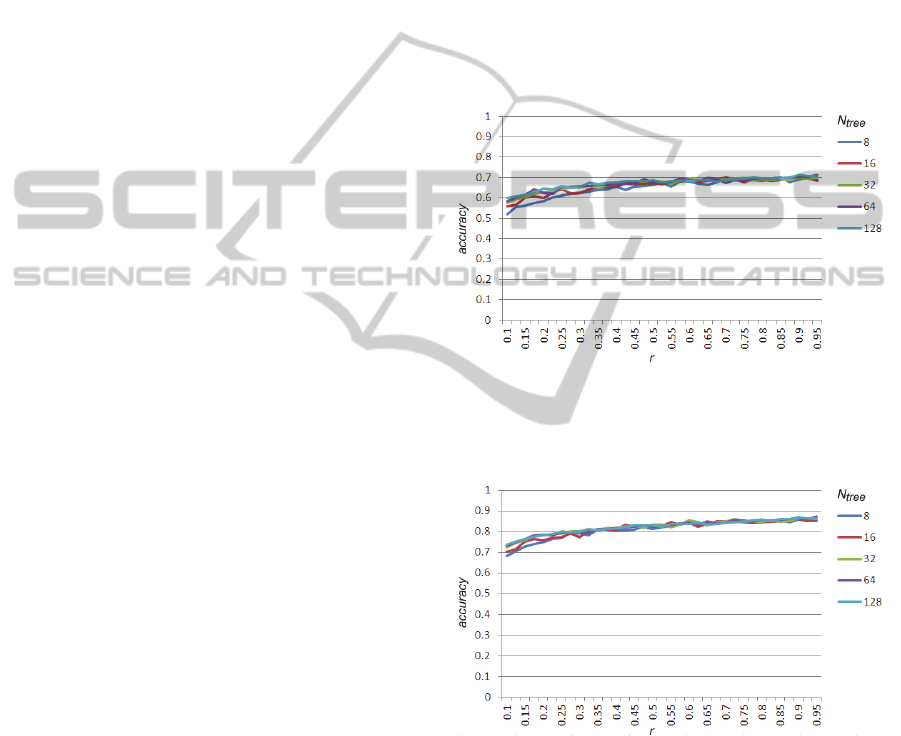
Figure 6: Exemplary bike cycle (start = finish).
4.1 Data Collection
The data collection was performed using standard
26’’ and 29’’ mountain bikes. Multiple cycles with
varying terrain conditions (in type and frequency)
were performed in several rural and (sub)urban
regions all over Belgium. An exemplary run, in
which all 6 terrain types occurred, is shown in
Figure 6. In order to have varying weather
conditions, the cycle runs were spread over the year,
both in winter and summer on sunny and rainy days.
Furthermore, tyre pressure and tyre types were
changed in between several runs in order to cope
with the tyre-vibration dependency.
To collect the vibration, visual and GPS data we
used a Sony Ericsson Xperia mini Android
smartphone and a Garmin Edge 800 bike GPS. On
the smartphone we ran an accelerometer data logger
and the time lapse android app, which takes a picture
each five seconds. The bike GPS collected all
geographical data and bike statistics. Based on the
timestamps, which are stored for each sensor
reading, the sensor data is aligned on each other.
The data was processed and analyzed on a
standard PC with an Intel Pentium IV 2.4 GHz
processor. The current version of the software is
written in C# using the open source AlgLib data
processing framework (http://www.alglib.net/) and
the Emgu CV (http://www.emgu.com/) image
processing library (for RDF classification and visual
analysis respectively).
4.2 Ground Truth Creation
The ground truth creation is performed by visual
analysis of the terrain images using a custom built
ground-truth marking application. In addition to this
image-based annotation, we also extend the GT with
the available geographic terrain data of online maps.
This data can be retrieved by reverse geocoding of
the GPX latitude / longitude information of our GPS.
As can be seen in the cycle run in Figure 6, it is
not always clear / easy to distinguish between some
of the off-road types. Sometimes, the terrain consists
of a combination of multiple terrain types, e.g., grass
and mud, or gravel and mud. In these situations,
ground truth annotation is difficult and can be error-
prone. A similar kind of ground-truth inaccuracy
was also reported in (Strazdins, 2011). In order to
cope with this GT issue, we will extend the GT
concept to allow multi-annotation. Currently, one
can also discard these misclassifications from the
confusion matrices and other evaluation metrics,
which are discussed hereafter.
4.3 Evaluation Strategy / Metrics
First of all, it is important to mention that both 6-
class and 2-class road/off-road classifications are
evaluated. This facilitates comparison with SOTA
works, which mainly perform 2-class classification
or not always use the same set of terrain types.
Furthermore, depending the application in which the
classification system is used, the degree of
specificity will also differ, i.e., for some GIS tools a
road/off-road discrimination is sufficient.
The accuracy of the proposed system is
evaluated for increasing number of RDF trees
(N
tree
) and increasing sample ratio r (which is
related to the number of bootstrap samples). We
define the accuracy as the proportion of the total
number of predictions that were correct, i.e., the
ratio of the number of correctly classified test
vectors and the total number of test vectors. This
accuracy will be calculated for each of the sensors
individually, i.e., the visual and accelerometer
accuracy, and also for their combination, i.e., the
multi-modal accuracy. When they are combined, we
use a winner-take-all strategy, where the sensor with
the highest class probability in P(c|v)wins. Other
‘merging’ strategies were also investigated,
however, not leading to better multi-modal accuracy
results.
Multi-modalBikeSensingforAutomaticGeo-annotation-Geo-annotationofRoad/TerrainTypebyParticipatory
Bike-sensing
45
Like in the work of (Khan et al., 2012), the
evaluation is performed using 10-fold cross-
validation. The data collected during our bike cycles
is randomly divided into ten equal-sized pieces.
Each piece is used as the test set with training done
on remaining 90% of the data. The test results are
then averaged over the ten cases, i.e., the accuracies
that are reported are the average accuracy over 10
RDF runs.
In order to allow a more detailed analysis, we
also generated confusion matrices (Kohavi and
Provost, 1998) for the optimal RDF N
tree
–r
combinations. These matrices contain information
about the actual (~ GT) and predicted classifications
done by a classification system and report the
number of false positives (FP), false negatives (FN),
true positives (TP), and true negatives (TN). The
strength of a confusion matrix is that it identifies the
nature of the classification errors, as well as their
quantities.
4.4 Results
First, we will present the accuracy results for each of
the sensors individually, i.e., the accelerometer and
visual accuracy. Subsequently, we will present their
multi-modal accuracy, based on the winner-take-all
strategy. The graphs (Graph 1-6) show the accuracy
for increasing number of RDF trees (N
tree
) and
increasing sample ratio r. Both 6-class and road/off-
road 2-class accuracy are shown.
Similar to (Ravi, 2005), we also performed
leave-one-out feature evaluation, in order to find out
which features among the selected ones are less
important than the others. We ran the RDF
classification with one attribute removed at a time.
The E(I) and ||m|| features turn out to be the least
significant. Leaving them out, however, leads to a
significant change of 2-3% in accuracy, i.e., a trade-
off between accuracy and computational complexity.
In general, each of the terrain types were
classified correctly to a high degree, but also some
misclassifications occurred. From these
misdetections, mud and grass were mostly confused
with each other. As discussed in Section 4.2,
however, this can also be caused due to some
ground-truth inaccuracy in the case of multi-class
terrain images.
Finally, it is also important to remark that the
visual accuracy is based on an optimal positioning of
the smartphone camera. It the camera is not placed
facing down as in our setup, we expect the visual
accuracy to be some percentages lower. Future work
will investigate the impact of the sensor positioning.
4.4.1 Accelerometer/Vibration Results
Graph 1 shows the accuracy for the 6-class terrain
classification solely based on accelerometer data.
For an optimal RDF configuration (N
tree
≈32;
r≈0.65), an accuracy of 71% is achieved. For 2-
class road/off-road classification, the accuracy is
87%, as can be seen in Graph 2. Since these are the
‘individual’ accuracy scores (measured on a single
user/bike segment), the collaborative accuracy is
expected to even further improve these results. As
such, accelerometer-only classification can even be
used with high accuracy within our system, for
example, when visual data is not available.
Graph 1: Accuracy of 6-class terrain classification solely
based on accelerometer data. Results are shown for
increasing number of RDF trees (N
tree
) and increasing
sample ratio r.
Graph 2: Accuracy of 2-class road/off-road terrain
classification solely based on accelerometer data. Results
are shown for increasing number of RDF trees (N
tree
) and
increasing sample ratio r.
4.4.2 Visual Results
Graph 3 shows the accuracy for the 6-class terrain
classification solely based on visual data. For an
optimal RDF configuration (Ntree≈32; r≈0.60), an
accuracy of 90% is achieved.
SIGMAP2013-InternationalConferenceonSignalProcessingandMultimediaApplications
46

Graph 3: Accuracy of 6-class terrain classification solely
based on visual data. Results are shown for increasing
N
tree
and r.
Graph 4: Accuracy of 2-class road/off-road terrain
classification solely based on visual data. Results are
shown for increasing N
tree
and r.
For 2-class road/off-road classification, the
‘visual-only’ accuracy is 96%, as can be seen in
Graph 4. Again we remark that this visual accuracy
is based on an optimal positioning of the smartphone
camera. Due to this optimal positioning, the gain of
multi-modal analysis is not that big (less than 2%),
as discussed hereafter. However, since the accuracy
of visual analysis will not always be so high in real-
life conditions, it is safe to state that the multi-modal
approach outperforms both the accelerometer and
visual-only terrain classification.
4.4.3 Combined ‘Multi-modal’ Results
Graph 5 shows the accuracy for the 6-class terrain
classification based on both visual and
accelerometer data. For an optimal RDF
configuration (N
tree
≈64; r≈0.55), an accuracy
of almost 92% is achieved (based on winner-take-all
strategy). For 2-class road/off-road classification, the
multi-modal accuracy is 97% (see Graph 6). Both
results show that our system outperforms the SOTA
work in this domain (discussed in Section 2).
Graph 5: Accuracy of 6-class terrain classification based
on multi-modal visual-accelerometer data. Results are
shown for increasing N
tree
and r.
Graph 6: Accuracy of 2-class road/off-road terrain
classification based on multi-modal visual-accelerometer
data. Results are shown for increasing N
tree
and r.
4.4.4 Confusion Matrices
Figure 7 shows the visual and accelerometer
confusion matrices for their optimal RDF N
tree
–r
combinations. As the visual confusion matrix in
Figure 7a shows, each of the terrain types was
classified correctly to a high degree. Only a limited
number of misclassifications occurred, mostly mud
and grass being confused with each other. For the
accelerometer classification (shown in Figure 7b),
most misdetections occur on off-road terrain types.
Figure 7: Confusion matrices.
Multi-modalBikeSensingforAutomaticGeo-annotation-Geo-annotationofRoad/TerrainTypebyParticipatory
Bike-sensing
47

5 CONCLUSIONS
In this paper, we have presented the detailed design,
implementation and evaluation of a novel
road/terrain classification system. The proposed
system shows how mobile sensors can help to
automate and facilitate some of the more labor
intensive VGI tasks. Based on the analysis of
volunteered geographic information gathered by
bikers, geographic maps can be annotated
automatically with each of the 6 terrain types:
asphalt, cobblestones, tiles, gravel, grass, and mud.
In order to perform the terrain classification task,
the system employs a random decision forest (RDF),
fed with a set of discriminative image and
accelerometer features. The multi-sensor terrain
classification achieves 92% accuracy for the 6-class
terrain classification problem, and 97% accuracy for
the on-/off-road classification. Since the evaluation
is performed on data gathered during real bike runs,
these are ‘real-life’ accuracies.
Future work will focus on the influence of bike
conditions (e.g., speed and ascent/descent) on the
classification results. If someone is biking faster, for
example, it is expected that the accelerometer will be
more discriminative, while for slower bikers, visual
features will (probably) be. Further research is
needed to check these hypotheses and to incorporate
these kinds of dependencies in our system. Finally,
when no visual data is available, for example when
the camera is blocked or not facing the terrain, we
also think of using reverse geocoding techniques to
query and analyze online geographic data.
ACKNOWLEDGEMENTS
The research activities as described in this paper
were funded by Ghent University, iMinds,
University College West Flanders, the Institute for
the Promotion of Innovation by Science and
Technology in Flanders (IWT), the Fund for
Scientific Research-Flanders (FWO-Flanders), the
Belgian Federal Science Policy Office, and the EU.
REFERENCES
Bao, L. & Intille, S. S., 2004. Activity recognition from
user-annotated acceleration data, In Pervasive
Computing, Vol. 3001, pp. 1-17.
Breiman, L., 2001. Random forests. In Machine Learning,
Vol. 45, No. 1, pp. 5-32 (2001)
Ershad, S. F., 2011. Texture Classification Approach
Based on Combination of Edge & Co-occurrence and
Local Binary Pattern, In Proceedings of International
Conference on Image Processing, Computer Vision,
and Pattern Recognition, pp. 626-629.
Gall, J., Razavi, N. & Van Gool, L., 2012. An Introduction
to Random Forests for Multi-class Object Detection,
In LNCS Outdoor and Large-Scale Real-World Scene
Analysis, Vol. 7474, pp 243-263.
Goldman, J., Shilton, K., Burke, J., Estrin, D., Hansen, M.,
Ramanathan, N., Reddy, S., Samanta, V., Srivastava,
M. & West, R., 2009. Participatory Sensing - A
citizen-powered approach to illuminating the patterns
that shape our world. In White paper of Woodrow
Wilson International Center for Scholars – Foresight
and Governance project.
Haklay, M. & Weber, P., 2008. OpenStreetMap:User-
Generated Street Maps, In Pervasive Computing, Vol.
7, No. 4, pp. 12-18.
Khan, Y. N., Komma, P., Bohlmann, K. & Zell, A., 2011.
Grid-based Visual Terrain Classification for Outdoor
Robots using Local Features, In IEEE Symposium on
Computational Intelligence in Vehicles and
Transportation Systems (CIVTS 2011), pp. 16-22.
Khan, Y. N., Masselli, A. & Zell, A., 2012. Visual Terrain
Classification by Flying Robots, In IEEE International
Conference on Robotics and Automation (ICRA 2012),
pp. 498 – 503.
Kohavi R. & Provost, F., 1998. Glossary of terms, In
Machine Learning, Vol. 30, pp. 271-274.
Pietikäinen, M., Hadid, A., Zhao, G. &Ahonen, T., 2011.
Computer Vision Using Local Binary Patterns, In
Computational Imaging and Vision, Vol. 40.
Pinheiro, A. M. G., 2009. Image Descriptors Based on the
Edge Orientation, In Proceedings of the 4th
International Workshop on Semantic Media
Adaptation and Personalization, pp. 73-78.
Popescu, D., Dobrescu, R. & Merezeanu, D., 2008. Road
Analysis based on Texture Similarity Evaluation, In
Proceedings of the 7th WSEAS International
Conference on Signal Processing (SIP'08), pp. 47-51.
Ravi, N., Dandekar, N., Mysore, P. & Littman, M.L.,
2005. Activity Recognition from Accelerometer Data,
In Proceedings of the 17th Conference on Innovative
Applications of Artificial Intelligence, pp. 1541-1546.
Reddy, S., Shilton, K., Denisov, G., Cenizal, C., Estrin, D.
& Srivastava, M., 2010a. Biketastic: Sensing and
Mapping for Better Biking, In Proceedings of the
SIGCHI Conference on Human Factors in Computing
Systems (CHI’10), pp. 1817-1820.
Reddy, S., Mun, M., Burke, J., Estrin, D., Hansen M. &
Srivastava, M., 2010b. Using Mobile Phones to
Determine Transportation Modes, In Transactions on
Sensor Networks, Vol. 6, No. 2, pp. 13:1-27.
Srivastava, M., Abdelzaher, T. & Szymanski, B., 2012.
Human-centric Sensing, In Philosophical Transactions
of Royal Society, Vol. 370, No. 1958, pp. 176-197.
Shotton, J, Kim, T.-K. & Stenger, B., 2009. Boosting &
Randomized Forests for Visual Recognition (tutorial),
In International Conference on Computer Vision.
SIGMAP2013-InternationalConferenceonSignalProcessingandMultimediaApplications
48

Shotton, J., Fitzgibbon, A., Cook, M., Sharp, T.,
Finocchio, M., Moore, R., Kipman, A. & Blake, A.,
2011. Real-time human pose recognition in parts from
single depth images, In IEEE Conference on
Computer Vision and Pattern Recognition, pp. 1-8.
Strazdins, G., Mednis, A., Zviedris, R., Kanonirs, G. &
Selavo, L., 2011. Virtual Ground Truth in Vehicular
Sensing Experiments: How to Mark it Accurately, In
Proceedings of 5th International Conference on
Sensor Technologies and Applications
(SENSORCOMM 2011), pp. 295-300.
Tang, I. & Breckon, T. P., 2011. Automatic Road
Environment Classification, In Trans. on Intelligent
Transportation Systems, Vol. 12, No. 2, pp. 476-484.
Yogameena, B., Lakshmi, S. V., Archana, M. &
Abhaikumar, S. R., 2010. Human Behavior
Classification Using Multi-Class Relevance Vector
Machine, In Journal of Computer Science, Vol. 6,
No. 9, pp. 1021-1026.
Ward, C. C. & Iagnemma, K., 2009. Speed-independent
vibration-based terrain classification for passenger
vehicles, In Vehicle System Dynamics, Vol. 47, No. 9,
pp. 1095–1113.
Weiss, C., Frohlich, H. & Zell, A., 2006. Vibration-based
Terrain Classification Using Support Vector
Machines, In Proceedings of the 2006 IEEE/RSJ
International Conference on Intelligent Robots and
Systems (IROS), pp. 4429-4434.
Multi-modalBikeSensingforAutomaticGeo-annotation-Geo-annotationofRoad/TerrainTypebyParticipatory
Bike-sensing
49
