A Pilot Investigation into a Measure of Table Tennis Movement
Efficiency using Kinetic Data
Dino A. Palazzi, Jonathan A. Glynn and Benjamin K. Williams
Sports Science Department, Aspire Academy, Doha, Qatar
1 OBJECTIVES
The time between table tennis shot’s is often very
short (approximately 0.8 s) and therefore effective
stroke mechanics can only be employed if the player
has moved efficiently into the ready position (Yuza
et al., 1992). The objective of this pilot investigation
was to attempt to develop a movement efficiency
score from a mathematical equation using kinetic
data captured during an alternating forehand (FH) –
backhand (BH) rally. The resultant score could be
useful to objectively track skill development and
movement efficiency in table tennis players.
2 METHODS
2.1 Subjects
Nine healthy, young male table tennis players, (age:
13.75 ± 1.24 y, height: 1.63 ± 0.13 m, body mass
(BM): 58.7 ± 14.3 kg) volunteered for the study. All
players were part of a national youth sports academy
and trained approximately 13 hours a week and were
familiar with the table tennis ball feeding robot.
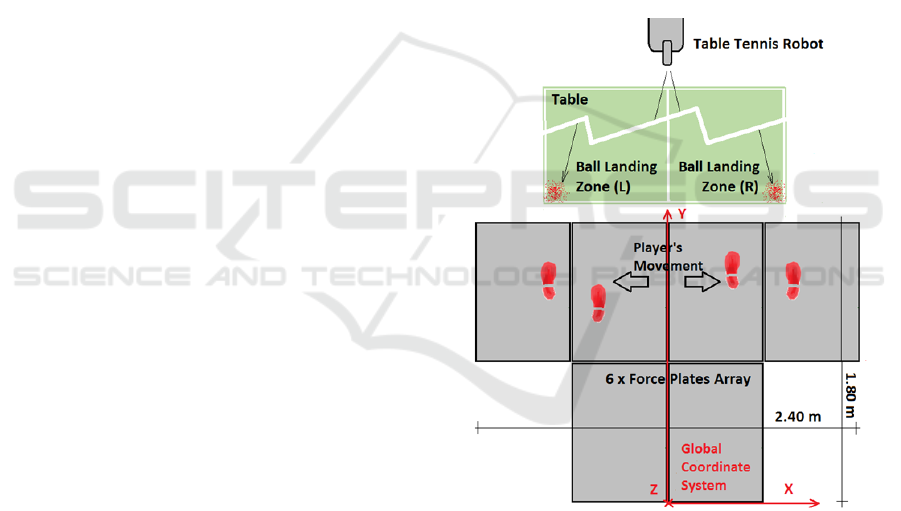
2.2 Data Collection Protocol
The test was performed in a laboratory environment
where an array of 6 force plates measuring 0.9 m x
0.6 m (Kistler 9287 CA, Switzerland) were mounted
behind an official table tennis table. Figure 1
illustrates the force plate configuration. The force
plates were covered with a high quality rubber mat
(Mondo, Italy), for improved grip.
A table tennis robot (Butterfly Amicus 3000,
Germany) was positioned centrally at the opposite
end of the table and delivered alternate FH and BH
balls at 80 balls.s
-1
. Players performed a warm-up
before the trials, including a number of practice
shots. Data was captured for 15 s, aiming to capture
6 consecutive successful (ball was returned to the
opposite half of the table) shots.
Figure 1: Experiment setup.
Force data was collected at 400 Hz simultaneously
from 48 force channels (4 vertical and 4 shear per
force plate) to calculate the center of pressure (CoP).
The force plates were zeroed before every trial. A
high speed camera (Casio Exilim Ex-F1) operating
at 300 frames.s
-1
was set-up behind the players to
record the trials for post-analysis.
2.3 Analysis
The first 2 shots of each trial were disregarded to
allow the player to get into a rhythm. Force curves
were trimmed using the high speed video recording
as a reference, aiming to get 6 consecutive
successful shots (3 FH, 3 BH). The data was then
filtered using a zero-lag, dual pass Butterworth low-
pass filter; cut-off frequency 1.5 Hz (pass-band gain:
-3 dB), stop-band frequency 5 Hz (stop-band gain: -
10 dB). The filtering parameters were selected based
upon numerous trials with various cut-off and
A. Palazzi D., A. Glynn J. and K. Williams B..
A Pilot Investigation into a Measure of Table Tennis Movement Efficiency using Kinetic Data.
Copyright
c
2013 SCITEPRESS (Science and Technology Publications, Lda.)

stop-band frequencies as well as visual data
inspection.
The 6 force plates were considered as one.
Maximum forces produced in the player’s medial-
lateral axis (x axis) and the trajectories of the CoP
on the floor were then calculated for every player
using the following equation (1):
CoP
F
a
M
F
,
F
a
M
F
(1)
where:
F
x
, F
y
and F
z
are the total forces in each direction
as shown in Figure 1, obtained by adding the values
of the respective channels of each force plate;
a
z0
is the vertical offset of the top surface;
M
x
and M
y
are the total moments about the x and
y axes respectively, calculated taking into account
the individual position of every force channel from
each plate in the array.
A number of variables were then calculated from
the trajectories of the CoP: total distance (m), left
and right maximum forces in the ML direction
relative to body weight (BW) and area of the
smallest ellipse containing 90% of the sampled
positions of the CoP, A
90
(m
2
) (Takagi et al., 1985).
A coefficient representing movement efficiency
(MEf) was formulated using the abovementioned
independent variables as follows:
9.12
|
|
|
|
2
(2)
where:
is the total distance travelled by the CoP;
9.12 is 6 times the width of the table, which was
used to normalise
over the 6 repetitions analysed;
|
|
,
|
|
are the absolute maximum right
and left ML forces respectively;
BW is being used to normalise the averaged
forces;
A
90
(m
2
) is the area of the smallest ellipse
containing 90% of the samples of the CoP.
The players were then ranked according to this
score; the higher the score the more efficient the
player was at moving during this task.
3 RESULTS
The results derived from the kinetic measurements
and corresponding values used for the movement
efficiency equation (2) are shown in Table 1.
Table 1: Efficiency coefficient and its components.
Player
D
9.12
F
2B
W
A
MEf
Rank
#
A
0.61 0.40 0.11 37.26
1
B
0.47 0.39 0.15 36.37
2
C
0.67 0.38 0.17 23.10
3
D
0.78 0.35 0.17 21.55
4
E
0.66 0.40 0.21 18.04
5
F
1.09 0.32 0.20 14.33
6
G
1.03 0.38 0.18 14.19
7
H
0.88 0.42 0.27 10.02
8
I
0.86 0.42 0.34 8.14
9
4 DISCUSSION
To be more efficient the players could have utilised
the same path between shots. The A
90
variable was
chosen to represent this efficiency, with a smaller
value being more efficient. The total distance
travelled by the CoP (
) was used as a measure of
total movement efficiency, the less distance travelled
the more efficient. Left and right braking forces
(
|
|
,
|
|
) were chosen as a measure of
movement efficiency during the change of direction
phase. The lower the forces the more efficient.
All three variables used in the MEf equation (2)
are independent of each other, inversely related to
optimal performance and represent different aspects
of movement efficiency. After normalizing
and
|
|
,
|
|
all variables also have a similar
weight in order of magnitude (Table 1).
Further investigation is recommended with an
increased number of players of differing ability to
validate the proposed MEf equation. A validation
study against kinematic data of the centre of mass
could also be useful. Further development of the
proposed MEf equation could incorporate a velocity
variable or a test that is not task-repetitive in nature.
REFERENCES
Takagi, A., Fujimura, E., Suehiro. S., 1985. A new method
of statokinesigram area measurement. Application of a
statistically calculated ellipse. In Igarashi, M., Black,
O. (Eds) Vestibular and visual control on posture and
locomotor equilibrium. Karger, Bâle, pp. 74-79.
Yuza, N., Sasaoka, K., Nishioka, N., Matsui, Y.,
Yamanaka, N., Ogimura, I., Takashima, N., Miyashita,
M. 1992. Game analysis of table tennis in top Japanese
players of different playing styles. International
Journal of Table Tennis Sciences, vol. 1, pp. 79-89.
