
Using Stocks and Flows Diagrams to Understand Business Process
Behavior
Timo Itälä and Mika Helenius
Department of Computer Science and Engineering, School of Science, Aalto University, Konemiehentie 2, Espoo, Finland
Keywords: Business Process Behavior, Stocks and Flows Diagrams, Business Process Simulation.
Abstract: Business Process Modeling has over the years focused in the activities and the logic how work gets done.
That is reflected in the modeling notations like BPMN, which show the sequence of activities, their
performers and the different paths each instance of the process can take. However, the performance of an
organization and its business processes are measured aggregating the flow of the results of single process
instances. Often the flows are not running smoothly but there are variations, delays, accumulations and
other phenomena, which can be causes for the processes not to meet their expected performance levels.
Therefore understanding the behavior of the business process over time is critical for any improvement
initiative. In this paper we show how stocks and flows diagrams can be used to model business processes
and how that model can be simulated to understand its behavior over time. Simulations can help in revealing
the critical points to remove bottlenecks and improve the overall performance of the processes. First we a
simple introduction to modeling business processes using stocks and flows diagrams. The we describe a real
life case using stocks and flows models and simulation to reveal a problem and proposing a solution in
health care environment.
1 INTRODUCTION
Organizational performance improvement initiatives
often focus in improving, redesigning or re-
engineering business processes (Hammer and
Champy, 1993). Modeling the As-Is business
processes, looking for problems and opportunities
for improvements and then modeling and
implementing, often automating the To-Be business
processes are the normal steps in the improvement
initiatives (Smith and Fingar, 2006). Modeling of
business process is typically concerned of the logic
of the processes. Davenport gives a following
definition: “A business process is simply a
structured set of activities designed to produce a
specific output for a particular customer or market. It
implies a strong emphasis on how work is done
within an organization, in contrast to a product´s
focus on what. A process is thus a specific ordering
of work activities across time and place, with a
beginning and end and clearly identified inputs and
outputs, a structure for action”. (Davenport, 1993).
That is reflected in the modeling notations like
BPMN which show the sequence of activites, their
performers and the different paths individual
business process instances can take (OMG, 2013).
Business Process Management with help of Business
Process Modeling languages and techniques has
probably been one of the most important
management practices in the last 20 years in
improving the organizational performance.
However, how the performance of the
organization is measured is typically over some
period of time. From that angle we can say that the
results of the business processes are aggregations of
the flow over time of single business process
instances. Many organizations use Data
Warehousing and Business Intelligence to measure,
report, analyse and sometimes predict the aggregated
results of their business processes like sales, orders,
deliveries, revenue streams and many other
variables.(Kimball, 1996). Those - important-
numbers look at the outcomes of the business
processes but do not give much help in trying to find
out how to improve their performance. Instead, we
argue that because the flows produce the results we
need to observe and look at the very flows inside the
business processes and understand their behavior
over time as one important angle in our
improvement initiatives.
552
Itälä T. and Helenius M. (2013).
Using Stocks and Flows Diagrams to Understand Business Process Behavior.
In Proceedings of the International Conference on Knowledge Discovery and Information Retrieval and the International Conference on Knowledge
Management and Information Sharing, pages 552-558
DOI: 10.5220/0004653005520558
Copyright
c
SCITEPRESS
When trying to model the behavior inside the
business process we come to an difficult question:
which notation to use? Here we quote Albert
Einstein, who said: “Whether you can observe a
thing or not depends on the theory which you use.
It is the theory which decides what can be
observed.” Most often used swimlane type business
process models are not very intuitive in trying to
visualize behavior over time. A natural choice for
modeling the behavior of the flows inside the
business processes are Stocks and Flows models
which are known from the field of System Dynamics
(Forrester, 1961). The Stocks and Flows models of
the business processes are also suitable for computer
simulations. They help in understanding the
behavior of the stocks and flows over time.
Simulations also help in finding the critical points to
remove bottlenecks and improve the overall
performance of the processes. Chapter 2 of this
paper gives a short introduction in using stocks and
flows for modeling behavior over time of a simple
business process. Chapter 3 explains a real case
where stocks and flows models and simulations
helped us to reveal the underlying problems and find
improvements to the business processes. Chapter 4
discusses about the usefulness of stocks and flows
diagrams in business process modeling and chapter 5
draws the conclusions.
2 STOCKS AND FLOWS
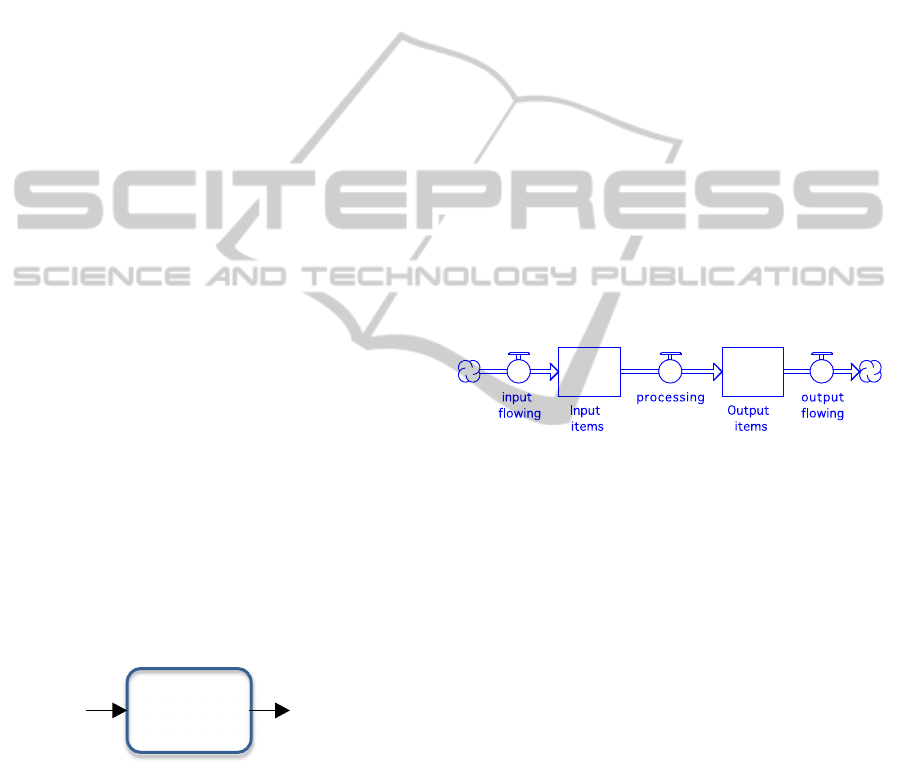
The most basic visual model of a business process
according to Davenport is shown in figure 1.
The common method for modeling business
processes is based on the activities, the flow of work
from one task to next. Typical visual model is the
swimlane and its many variants, BPMN perhaps
Figure 1: Business Process.
most widely used. Business processes consist of
tasks and their sequence, logic for branching the
sequence based on rules and conditions and actor
who carry out the tasks. The swimlane represents all
the different paths what one process instance can
take. But when we are interested in behavior of the
aggregation of the business process instances over
time the swimlanes do not give much help. Input to
the process usually is not evenly distributed over
time. The flow of input items may have fluctuations
and variations, backlog of work may be
accumulating and other phenomena may occur that
have consequences on how the process will produce
its output.
To understand how the flow of input will affect
the output we turn the same business process model
into very high-level diagram of stocks and flows.
We start with identifying the first stock. The stock
represents an accumulation of some entity, so Input
waiting to be processed is the obvious choice for the
first stock. A stock is visualised with a rectangle,
which has a noun as a name. A stock is represented
by the value of a corresponding variable like number
of input items. The value represents always the size
of the stock in some point of time. That value can be
changed only by a flow. A flow can be an inflow,
which will increase the stock. A flow can also be an
outflow, which will decrease the stock. A flow is
visualised by an arrow and valve in the middle of it.
The value assigned to a flow represents the rate of
change of the respective stock over time, like
processed input items per hour. Figure 2 shows
previous diagram using stocks and flows notation.
Figure 2: Stocks and Flows Diagram.
In the diagram we have input items flowing in and
accumulating to wait for processing. The activity
“processing” will deplete the stock and move
finished items into accumulation of output items.
The flow input starts from a cloud and the flow
output ends in a cloud. Those are how we set
boundaries in our model and are not interested what
lies outside those clouds.
Stocks and Flows Diagrams are useful in
simulating the behavior over time of the model.
Flows can be affected by information of the level of
stocks and other factors, which create feedback
loops and can make the process behavior non-linear.
There is some literature about modeling the business
processes using swimlanes and Stocks and Flows
diagrams (An and Jeng, 2005). In the next chapter
we show a real life example of modeling using
Stocks and Flows diagrams and how simulation of
the model helped to understand the business process
problems, which were not easily seen from
swimlane models.
Input
Process
Output
UsingStocksandFlowsDiagramstoUnderstandBusinessProcessBehavior
553
3 CASE HOSPITAL
3.1 Situation and Need
for Improvement
This case is from a central hospital in Western
Finland. It offers full range of healthcare services
like inpatient and outpatient services, operations
theatre, emergency services, diagnostics, laboratory
etc. It has about 400 000 visits per year, 1000 beds
and around 60 departments.
The hospital, like most hospitals, has a practice
that the doctors dictate the medical records,
observations, statements and other documents,
which then are transcribed by the secretaries. The
situation in our case hospital was that the technology
for recording the dictations on magnetic tape was
coming to its end of life phase. It was being replaced
by digital recording equipment and software for
dictations and transcriptions. At the same time the
possibilities for improvements in managing the
transcriptions could be discussed more broadly.
One problem in this case was that some
departments had long delays in getting the dictations
transcribed. That was causing problems in the next
steps of the care when the medical records were not
available from the previous step. That problem was
coming more visible when the hospital had
introduced a new regional information system which
enabled the doctors in health care centres look into
the medical records from the hospital. The
management of the hospital had initiated an
improvement effort to reduce the delays and shorten
the time to get the medical records transcribed.
3.2 Swimlane Diagram
of As-Is Business Process
We started with modeling the as-is business process.
We interview several doctors, nurses and secretaries
on different departments. A very simple model of
the activities is shown in figure 3.
Figure 3: Dictations and transcriptions.
This simple model gave us an understanding of the
flow of dictations but did not give understanding of
the delays.
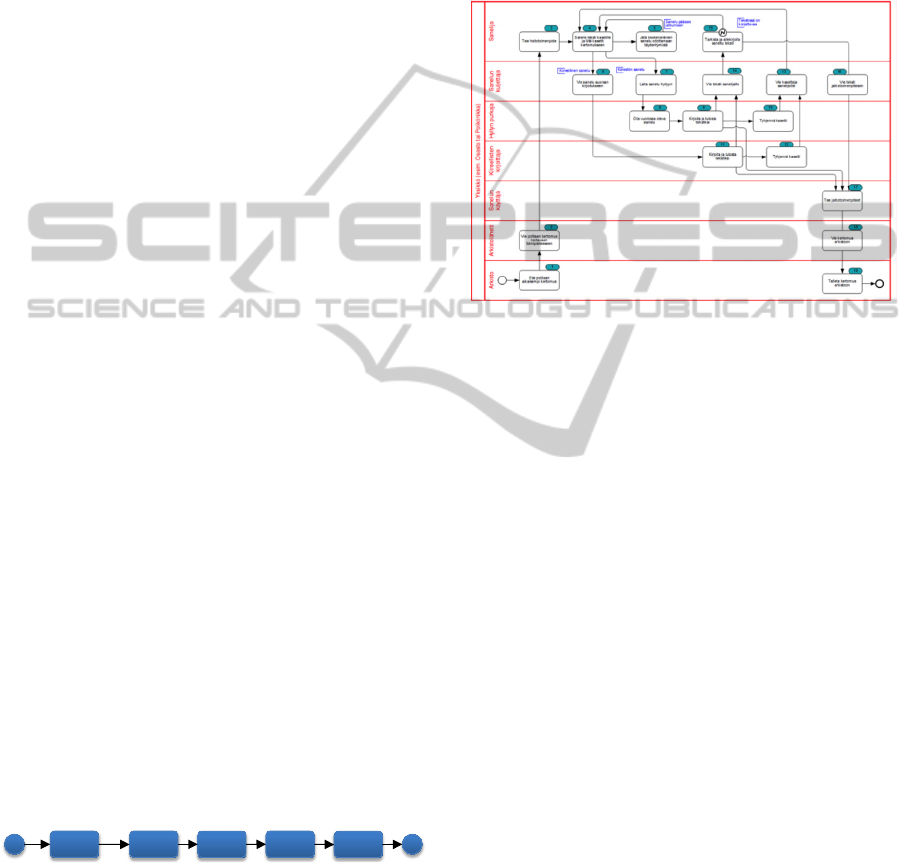
Then we modeled the as-is business process in
Fig. 4 using swimlanes and BPMN 1.0 notation.
Unfortunately the diagram text is in Finnish and also
too small to read. Anyway, it is presented to give a
flavour of swimlane diagram. The swimlane model
showed basically to paths for the transcriptions:
normal path and expedited path for urgent cases. The
difference was that urgent dictations went directly to
the transcriptionists whereas the normal dictations
went first to the shelf of waiting dictations and from
there to the transcriptionists.
Figure 4: As-Is business process of transcribing.
Every department in the hospital had their own
shelves and own secretaries for transcribing their
dictations. The secretary would take the next
dictation from the shelf if there were no urgent
dictations waiting on her desk. Practically every
department was working according to this model.
However, this swimlane model did not help us to
understand why some departments had long delays
in getting dictations transcribed and others did not.
So we needed some other method to model the
behavior of the transcription process so that we
could find the cause for delays and differences
between departments.
3.3 Stocks and Flows Diagram
Eventually there was a backlog of dictations
accumulated and waiting for the transcription. A
natural choice was next to look into the method of
stocks and flows diagramming. A simplified model
of the flow of dictations to transcriptions is shown in
figure 5. An activity in the swimlane model is
represented as a flow, for example transcribing the
dictations. And the stocks – they are the dictations
waiting to be transcribed. The activity – the flow-
will empty the stock. The stocks, the accumulations
of tasks waiting for the activity to start are not
visible in the swimlane diagram. That is why
swimlane diagram does not naturally show the
accumulation of backlogs.
See the
patient
Dictate Transcribe Print File
KDIR2013-InternationalConferenceonKnowledgeDiscoveryandInformationRetrieval
554

Figure 5: Stocks and Flows of dictations and transcribing.
The model has one stock which is Dictations waiting
to be transcribed. It has an inflow dictating and an
outflow transcribing. When a new dictation arrives,
it has to wait until all the previously arrived
dictations have been transcribed. For example if
there are 30 dictations in the stock and the rate of
transcriptions is 30 dictations / day, then the wait
time for newly arrived dictation is one day until it
will be transcribed.
For simulation purposes we added variables into
so called converters in the model so that we can try
how they affect the different behavior patterns. We
added variables capacity per secretary and the
number of secretaries so that we can try different
scenarios. We also added variable wait time to show
the results of simulation. We connected the
converters into respective stocks and flows using
arrows called connectors.
3.4 Simulating the Transcription
Process
Recommended practice is to start simulation in a
steady-state initial condition. So we started the
simulation by setting the capacity per secretary into
30 dictations per day per secretary and number of
secretaries into three secretaries giving total capacity
of 90 dictations per day. For the inflow we gave the
same rate 90 dictations per day and for the initial
value of the stock 10 dictations waiting to be
transcribed. The simulation result showed that the
model works: The wait time was10 dictations / 90
dictations per day resulting in 0.11 days steady wait
time.
Then we made a small disturbance to cause the
model out of balance to see how the process
behaves. We set the number of secretaries into two
for two days. The wait time got longer on those two
days and came back to steady state after the
secretary returned to work on day four. However,
now the wait time was permanently longer than
before the disturbance because the stock of
dictations had increased during her absence. To
adjust the wait time we increased the number of
secretaries into four on day nine for a couple of
days. We saw the decrease of the wait time and
finally the stock was emptied. We could set the
number of secretaries back to three. The model was
again in steady state and the wait time now remained
zero.
The simulation was carried out using iThink 10
software. The simulation parameres were following:
Dictations(t) =
Dictations(t - dt) + (dictating - transcribing) * dt
INIT Dictations = 10
INFLOWS:
dictating = Rate of dictations
OUTFLOWS:
transcribing =
capacity per secretary*number of_secretaries
capacity per_secretary = 30
number_of_secretaries = GRAPH(TIME)
(1.00, 3.00), (2.00, 3.00), (3.00, 2.00), (4.00, 2.00),
(5.00, 3.00), (6.00, 3.00), (7.00, 3.00), (8.00, 3.00),
(9.00, 3.00), (10.0, 4.00), (11.0, 4.00), (12.0, 4.00),
(13.0, 3.00), (14.0, 3.00), (15.0, 3.00), (16.0, 3.00)
rate of dictations = 90
wait time = Dictations/Transcribing
Figure 6: Simulation results.
When we showed and explained the results of the
simulation a lively discussion started. How in case
of one secretary´s sick leave resources could be
borrowed from some other departments so that the
stock of waiting dictations would not increase too
much? How could we share the workload so that if
some departments have extra resources in some
point in time they could help other departments with
heavy workload? As process modelers we
understood that just looking at the swimlane
diagrams this discussion would not have started.
number of
secretaries
3
2 3
4 3
UsingStocksandFlowsDiagramstoUnderstandBusinessProcessBehavior
555
Stock and flows model brought new insight in
understanding the behavior of the business process
and helped in trying to find new solutions to the
problem at hand.
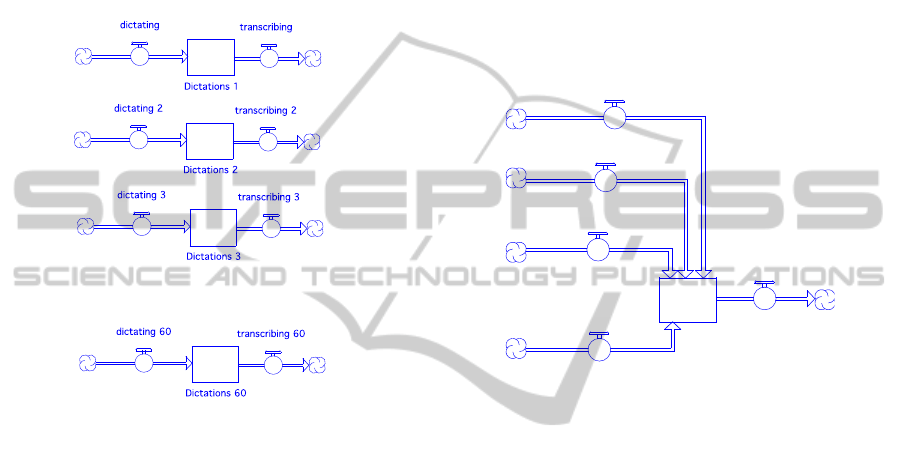
3.5 Looking Processes at Hospital
Level
We continued our modeling and turned our attention
to hospital level, which is shown in figure 7.
Figure 7: Transcriptions on every department.
During the interviews we observed two departments,
which did not seem to have backlogs of dictations
waiting for transcription. We started to investigate
what is different with these departments compared to
the other departments. The departments were
emergency department and operations rooms
department. The patients stay at these departments
only for a short period of time and soon are moved
to next department. The receiving departments have
a requirement that the medical records need to
follow the patient at the time of transfer. So the
doctors will dictate and the secretaries will
transcribe the medical records immediately. If there
is a backlog of dictations accumulating then
secretaries from other departments can be borrowed
for transcription. But these two departments were an
exception in the policy that departments do not share
their secretaries even in case that some departments
would have a need for additional resources and some
other departments would have extra resources
available at that moment.
We started to see the underlying problem.
On departmental level even small variations in
workload or capacity can easily disturb a steady
state and cause the backlog start to build up. For
example department with two secretaries will have
its capacity dropped in half if one of the secretaries
is sick. Based on this understanding we started to
think about the potential solution. If we could share
the resources on hospital level then it would be very
unlikely that half of the capacity would be lost
because of sick leaves. In other words, the variations
have relatively smaller effect on hospital level
compared to departmental level. That led us to the
solution of having one hospital level flow of
transcriptions instead of 60 flows on departmental
level. Figure 8 shows that idea.
Figure 8: Combined flows.
3.6 Implementation of a New Flow
Structure
The idea of one flow of transcriptions was much
discussed and the necessary changes considered. The
changes were needed in all areas of Enterprise
Architecture: Business Processes, Information,
Applications and Technology. In addition to that
also policies and accounting practices needed
changes.
We will discuss them briefly:
Technology: New technology using digital
dictation machines resulting into audio files made
it possible that transcribing was not any more
limited to certain physical location. Also typing
the medical records directly into electronic format
made it possible to share the medical records and
print them out where needed. So the technological
requirements for the changes were already in
place.
Applications: We would need an application to
keep track of the dictations which are made by
doctors and which are waiting to be transcribed.
That application would distribute dictations to the
available secretaries and keep track of work in
progress and work completed.
Dictations
dictating 1
transcribing
dictating 2
dictating 3
dictating 60
KDIR2013-InternationalConferenceonKnowledgeDiscoveryandInformationRetrieval
556

Information: Identification of the digital files and
assigning them to the right patient need to be
solved. Dictations in the physical recording
cassettes were always carried within the folders of
respective patient´s paper records. The application
was needed to manage identification of the files
and assigning the to the right patients.
Business processes: New business processes for
dictations and transcriptions using the new
electronic devices and above mentioned
application was needed. That was later modeled
using BPMN business process models.
Policies: Perhaps biggest and most time-
consuming change was how to enable the work
cross-organizational boundaries. The accounting
practices in the hospital were based as departments
being cost centers. Some shared services were
internally invoiced from the cost centers. But
sharing secretaries and invoicing that work
between departments would be too complicated
and cause too much administrative effort. It was
then decided to set up a separate unit for
transcriptions and collect needed secretarial
resources into that unit which would then offer its
services to the departments and make the internal
accounting very simplified.
3.7 Another Accumulation
in the Doctors’ Memory
The interviews with the secretaries of the
departments had also revealed that sometimes the
backlog of dictations started to accumulate even
when all the secretaries were at work. It turned out
that the doctors had different practices in how they
organised the work. Some doctors would dictate the
medical records immediately after the visit of the
patient. But some doctors would see all the patients
during the day and only in the end of the day dictate
their medical records. And then there were some
doctors who would do the dictations of several days
in on go. We modeled the stocks and flows diagram
of this observation. The model showed us that
initially we had made too tight boundaries to our
model so that it could show all the causes for
backlogs.
In the model there is another stock, which is in
the doctors’ memory. It is made up of the medical
records waiting to be dictated. That stock has an
inflow when doctor is working with patients and
collecting information, which need to be dictated.
And the outflow is the dictations made by the
doctor. If the doctor dictates two days of
accumulation of medical records will that cause a
pulse in the inflow of the stock of dictations waiting
to be transcribed. The next dictation from some
other doctor would have to wait for the
accumulation from the previous doctor to be cleared.
Figure 9: Accumulation in the doctors’ memory.
Another policy change was made requiring the
doctors to do the dictations as soon as possible,
latest within the same day. Changes were also made
in their work schedules etc. but in this paper we do
not go into those details. The point is that it is
important to set the boundaries of the stocks and
flows diagram so that all relevant aspects become
visible and are considered.
3.8 How to Monitor the Flows
Figure 10: Monitoring the flows.
Extending the boundaries to include the flow of
patients visiting the doctors extended also the
functionality of the application to monitor the
dictations. It would keep track of the visits for
doctors and accumulation of the medical records,
which needed to be dictated. The application could
kindly remind the doctors to do the dictations.
Also that application could be used for giving
early indication that eventual backlog would be
accumulated if the number of visits and the amount
of medical record what they would generate exceeds
the available transcription capacity of the secretaries.
Additional secretaries could be called in duty to
prevent or remove the backlog before it would cause
major delays.
3.9 Experiences
The changes were implemented. Now in the hospital
there is a transcription centre with about 25
Dictations
dictating transcribing
Doctors
memor
y
collecting
UsingStocksandFlowsDiagramstoUnderstandBusinessProcessBehavior
557

secretaries transcribing all dictations from the
departments. The goal of maximum 5 days delay in
transcription of the dictations was achieved after two
years of implementing the changes.
4 DISCUSSIONS
AND CONCLUSIONS
Using stocks and flows diagrams to model and
analyse business processes in addition to widely
used work flow models helps us to point out
problems and opportunities what otherwise would
probably remain undetected. The stocks and flows
diagrams enable us to:
Identify the bottlenecks in the business process
flows and find alternatives how to widen them for
example by increasing parallel processing or
speeding up individual activities.
Understand the effects of the distribution profiles
of incoming tasks and how to be prepared in case
of pulses to assign resources timely so that
accumulations will not build up and cause delays
in future processing
Avoid accumulations by trying to keep the inflows
as steady as possible
Design an information system for monitoring the
stocks and adjust the flows to prevent the
accumulations to grow too much
Give factual input for discussions of potential
changes in organizational policies and practices,
which are needed to enable organizational
changes.
In discussions with hospital participants it was
said that visualisation and seeing it live greatly helps
our cognitive capabilities in understanding how
business processes behave over time.
One important aspect is the adoption of digital
dictations, which made it possible to physically
separate the transcription from the department where
the doctor made the dictation. If the original manual,
department level workflow had been left unchanged
the reasons for delays had still been causing
problems. It was beneficial for the organization to
have a high level view to the business process and
understanding the underlying reasons for the
behavior of the processes.
Comparing workflow diagrams (swimlanes) and
stock and flow diagrams we can say that when we
want to understand how work gets done we use
swimlanes. When we want to understand how flows
behave over time we use stocks and flows diagrams.
They help us to identify the potential problems or
opportunities and find the solutions.
REFERENCES
An, L and Jeng, J-J.(2005). On developing system
dynamics model for business process simulation.
Proceedings of the 2005 Winter Simulation
Conference.
Davenport, T. H. (1993). Process Innovation:
reengineering work through information technology.
Boston, MA: Harvard Business School Press.
Forrester, J. (1961) Industrial Dynamics. Waltham, MA:
Pegasus Communications.
Forrester, J. (1968) Principles of Systems, 2
nd
ed. Pegasus
Communications.
Hammer, M., Champy, J. (1993). Reengineering the
Corporation: a Manifesto for Business Revolution.
HarperCollins publishers Inc.
Kimball, R. (1996). The Data Warehouse Toolkit.
Practical Techniques for Building Dimensional Data
Warehouses. John Wiley & Sons Inc.
OMG (2013). http://www.bpmn.org/ accessed 11.06.2013.
Richmond, B. (1992) An introduction to Systems
Thinking and ithink software. Isee systems.
Smith, H., Fingar, P. (2006). Business Process
Management (BPM): The Third Wave. Meghan Kiffer
Pr.
KDIR2013-InternationalConferenceonKnowledgeDiscoveryandInformationRetrieval
558
