
Plaque Vulnerability Phenotype in Patients with Coronary Artery
Disease
An Intravascular Ultrasound Radiofrequency Analysis
T. Pinheiro
1
, C. Ramos
1
, P. Napoleão
2
, C. Mendonça
1
, C. Fondinho
3
, M. Selas
3
, M. Mota Carmo
3,4
and R. Cruz Ferreira
3,4
1
IST/ITN, Instituto Superior Técnico, Universidade Técnica de Lisboa, E.N. 10, Sacavém, Portugal
2
Instituto de Medicina Molecular, Av. Prof. Gama Pinto, Lisboa, Portugal
3
Serviço de Cardiologia. Hospital de Santa Marta CHLC, Lisboa, Portugal
4
CEDOC, Faculdade de Ciências Médicas, Universidade Nova de Lisboa, Campo Santana, Lisboa, Portugal
Keywords: Coronary Artery Disease, Atherosclerosis, Vulnerable Plaque Phenotype.
Abstract: The relationship between plaque morphology and clinical presentation was examined. Lumen dimensions,
atheroma morphology and composition were assessed by virtual histology intravascular ultrasound (VH-
IVUS) in 1757 frames of coronary segments of interest of 17 patients with acute and chronic coronary artery
disease, i.e., ST-elevation (STEMI) and non-ST-elevation (NSTEMI) myocardial infarction, unstable angina
(UA) and stable angina (SA). Large plaque areas with distended elastic lamina (EEL), rich in fibrotic (FB)
and fibro-fatty (FF) tissues associated with STEMI and UA. Variants of this phenotype consisting of large
calcium deposits and reduced lumen area were prevalent in NSTEMI patients. SA patients consistently
showed plaques with small areas, marked constrictive growth and low FF content. IVUS-derived plaque
measures provided phenotypes of vulnerability and rupture that may help improving risk stratification of
both symptomatic and asymptomatic patients.
1 INTRODUCTION
Coronary artery disease is still the main cause of
death worldwide. This disease is characterized by
impaired function of endothelial cells, which line the
vessel luminal surface. The endothelial dysfunction
promotes the adhesion of leukocytes and their
migration into the vessel wall. Atherosclerosis is a
pathological process of the vasculature causing a
progressive thickening of artery intima. As
atherosclerosis progresses the atheroma builds up in
the vessel wall in consequence of abnormal transport
of low density lipoproteins (LDL) in endothelial
cells, inflammatory cell recruitment to the vessel
wall and inefficient turnover of debris of modified
and/or oxidized products of metabolism. Several
events such as, cell apoptosis of macrophage-derived
lipid-load cells, increased secretion of inflammatory
molecules and proteases by activated cells in the
intima, which damage the extracellular matrix,
promote cell activation and smooth cell migration
from arterial media, contribute to plaque fibrosis and
development of the necrotic core and calcified areas.
The perpetuation of oxidative, inflammatory and
proteolytic activity originates an inflamed plaque
with a metabolically active fibrous cap. Eventually
the plaque ruptures, which results in a clinical
spectrum of presentations ranging from sudden
cardiac death, myocardial infarction and unstable
angina, to an asymptomatic event with plaque
progression (Stone, 2011).
Intravascular ultrasound (IVUS) is a catheter
based imaging modality providing two-dimensional
visualization of the arterial wall. The analysis of the
radiofrequency spectrum, usually called Virtual
Histology IVUS (VH-IVUS), allows determining the
fibrotic, fibro-fatty, necrotic and calcium contents in
plaques (Vancraeynest, 2011); (Nair, 2007); (Fayad
and Fuster, 2001).
In coronary segments of interest the VH-IVUS–
derived plaque dimensions and composition data
may help characterizing the high-risk and vulnerable
atherosclerotic plaques. The relationship between
84
Pinheiro T., Ramos C., Napoleão P., Mendonça C., Fondinho C., Selas M., Mota Carmo M. and Cruz Ferreira R..
Plaque Vulnerability Phenotype in Patients with Coronary Artery Disease - An Intravascular Ultrasound Radiofrequency Analysis.
DOI: 10.5220/0004664400840089
In Proceedings of the International Congress on Cardiovascular Technologies (VisualCardio-2013), pages 84-89
ISBN: 978-989-8565-78-5
Copyright
c
2013 SCITEPRESS (Science and Technology Publications, Lda.)

atheroma composition and arterial remodelling
characteristics in patients with acute and non-acute
coronary artery syndromes would dramatically
improve risk stratification of both symptomatic and
asymptomatic patients (Ramos et al, 2013); (Garcia-
Garcia, 2012); (Calvert, 2011).
2 OBJECTIVES
The aim of this study was to examine the plaque
morphological and histological characteristics
obtained with VH-IVUS, and associate these
features with clinical symptoms.
In particular, we investigated how vessel
measures, indicative of plaque expansive and
constrictive growth, were predicted by plaque
composition changes.
It can be anticipated that plaque phenotype may
be related to vulnerability and plaque rupture.
3 METHODS
3.1 Patients
Seventeen patients of both sexes with coronary
artery disease (CAD) presenting to the Cardiology
Service of Santa Marta Hospital (CHLC, Lisbon,
Portugal) undergoing percutaneous coronary
intervention (PCI) for troponine-positive acute
coronary syndrome (ACS), such as, ST elevation
myocardial infarction (STEMI), non-ST-elevation
myocardial infarction (NSTEMI), and absence of
biochemical evidence of myocardial damage such
as, unstable angina (UA) were prospectively eligible
non-ACS such as, chronic stable angina were also
included in the study.
ACS patients were assessed within 6 hours after
onset of symptoms and before medication
administration. Non-ACS patients were assessed
before PCI. Demographics, risk factors, clinical
history, and angiographic data were recorded for
each patient. Biochemical tests were also carried out,
which included creatinine kinase (CK), troponin T,
N-terminal pro-brain natriuretic peptide (NT-
proBNP) and C-reactive protein (CRP)
determination (Table 1).
The Ethical Committee of the CHLC approved
the study protocol. All participants gave written
consent before enrolment.
3.2 VH-IVUS
The VH-IVUS acquisition was performed using an
EagleEye catheter (20 MHz) at pullback speed of 0.5
mm/sec. For each coronary segment, vessel, lumen
and atheroma measurements were obtained for every
VH-IVUS frame (0.5 mm thickness) throughout the
region of interest and lesion borders established
using the leading edges of external elastic lamina
(EEL) and the luminal contour.
Atheroma area (AAT) was determined as the
difference between EEL and lumen areas. Atheroma
volume was calculated as the differences between
EEL and lumen areas across all evaluable slices.
Plaque burden was calculated as plaque area divided
by EEL area.
Table 1: Patients characterization. Results are medians and
interquartile range (Q25 – Q75), unless otherwise
specified. Abbreviations: ACS - Acute Coronary
Syndrome; TIMI (Thrombolysis In Myocardial Infarction)
grade flow 0 – no perfusion to 3 – complete perfusion;
Multivessel ≥ 1 vessel affected.
Patient’s Characterization
Male sex (%) 66
Age (y) 66 (57 – 76)
Risk factors >2 (%) 67
Previous medication (%) 89
ACS (%) 41
Multivessel (%) 47
TIMI ≤2 94
CK (U/l) 125 (87 – 424)
Troponin T (U/l) 0.05 (0.01 – 1.87)
CRP (mg/l) 5.6 (1.0 – 8.2)
NT-proBNP (pg/ml) 162 (0.01 – 219)
IVUS data was recorded for the reconstruction of
the radiofrequency backscatter information using In-
Vision gold commercial software (Volcano
Corporation, USA). Following spectral analysis, the
areas and percentages of fibrotic (FB), fibro-fatty
(FF), calcified (Ca) and necrotic core (NC) were
calculated for each frame. A colour image of the
plaque is formed using a colour code: green (FB);
light green (FF); red (necrotic core); white (Ca).
3.3 Statistical Analysis
Statistical analysis was performed with SPSS V.21.
IVUS data was evaluated taking into account all
frames in every segment of interest and single cross-
sections selected at larger stenosis, distal and
proximal regions of the coronary segment.
The correlation between VH-IVUS derived
measurements was calculated using Kendall's Tau
PlaqueVulnerabilityPhenotypeinPatientswithCoronaryArteryDisease-AnIntravascularUltrasoundRadiofrequency
Analysis
85

algorithm. Linear regression (stepwise selection of
variables) was applied to estimate plaque
composition in positive or negative growth.
Discriminant analysis was used to correlate plaque
morphology and composition in combination to
clinical symptoms. Variables were transformed
whenever appropriate. Continuous variables were
compared by Mann-Whitney U statistic test.
A p-level <0.05 was considered statistically
significant for all analysis.
4 RESULTS
4.1 Plaque Characterization
The coronary segments of each patient were
evaluated by extracting selected frames in three
distinct regions, i.e, distal, proximal and major
stenosis region and by using the total number of
frames recorded in each visualized segment (multi-
frame analysis).
In the multi-frame approach a total of 1757 VH-
IVUS frames were analysed (median = 56; IQ25-
IQ75: 26-93 frames per coronary segment).
The results obtained using both approaches are
summarized in Table 2. When plaque data was
assessed using a reduced number of frames luminal
dimensions were underestimated relative to multi-
frame approach.
Table 2: Patients characteristics using selected frames and
total number of frames. Significant differences (pair-test)
for p<0.05. Abbreviations: EEL - external elastic lamina;
AAT - atheroma area; PB -plaque burden; FB - fibrotic
tissue; FF - fibro-fatty tissue; Ca - calcified tissue; NC -
necrotic core.
Plaque characteristics
Analysis of 3
frames
Multi-frame
analysis
p
FB (%) 57 (50 – 69) 51 (45 – 61) 0.877
FF (%) 12 (8– 17) 11 (6 – 17) 0.234
Ca (%) 11 (5 – 19) 10 (3 – 16) 0.017
NC (%) 16 (10 – 21) 21 (14 – 25) 0.056
Lumen
diameter
(mm)
2.2 (1.9 – 2.7) 2.6 (2.4 – 2.9) 0.005
area (mm
2
) 3.6 (2.9 – 5.1) 5.1 (4.6 – 6.7) 0.001
EEL
diameter
(mm)
4.5 (4.2 – 4.9) 4.5 (4.0 – 4.8) 0.326
area (mm
2
) 17 (14 – 19) 16 (12 – 18) 0.215
AAT (mm
2
) 13 (10 – 15) 10 (7 – 12) 0.001
PB (%) 77 (66 – 84) 60 (50 – 68) <0.001
Consequently plaque area and plaque burden
become overestimated as can be inferred from data
listed in Table 2. Data for plaque composition using
selected frames from each coronary segment
depicted higher values of Ca tissue content
(p=0.017), whereas NC content was marginally
reduced (p=0.056).
4.2 Relationship between Plaque
Morphology and Composition
Lumen and EEL dimensions, whether minimum or
maximum diameters, area or volumes, were
positively correlated (p<0.05). The NC content of
the plaque failed to correlate with lumen, EEL or
plaque dimensions.
Considering EEL area (or volume) as dependent
variable in the regression model and plaque
composition (FB, FF, Ca, and NC) as predictor
variables, EEL was positively associated to plaques
rich in FB, FF. The regression model became more
significant when plaque area was considered as
dependent variable. The model accuracy was above
68% and both the model fitted and variables retained
were highly significant (p<0.001). The FB and FF
contents were moderately useful to estimate plaque
size (r=0.355, p<0.0001). The plaque outwards
enlargement was related to FF increases in detriment
of plaque FB content.
However, the plaque composition failed to
associate with lumen dimensions (diameter, area or
volume).
To further estimate the importance of plaque
composition and morphology to the plaque
phenotype having into account patient clinical
presentation, i.e., STEMI, NSTEMI, UA and SA, the
concordance correlation, not dependent on linear
combinations, between area of EEL or plaque area
and plaque components was studied.
More expansive plaques (large EEL area or
plaque area) are rich in FF and FB and this pattern
was associated to STEMI and UA patients.
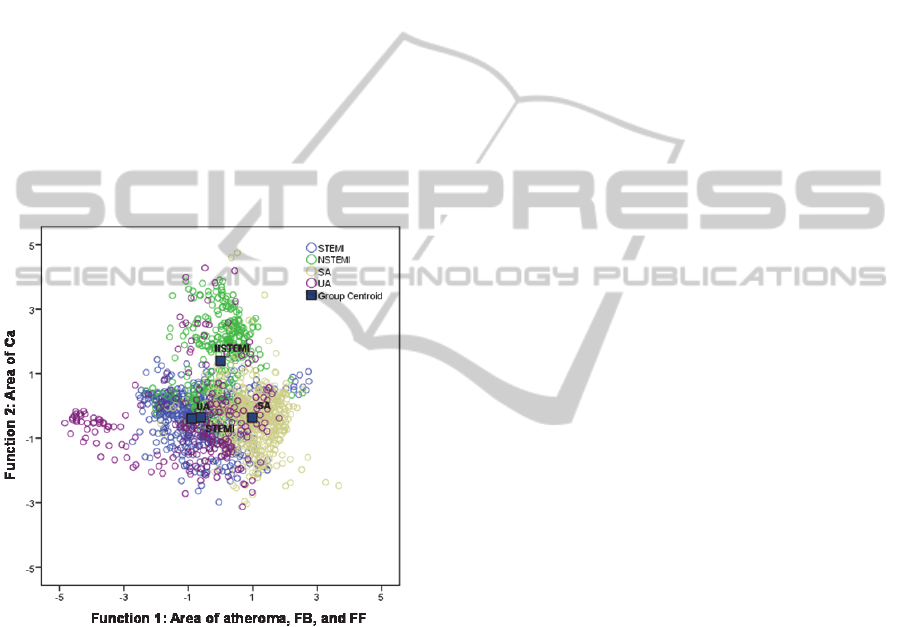
Results
showed that the shared correlation between the
atheroma area, FB and FF content accounted for
48% of the total variability, and enabled to
discriminate STEMI and UA patients (Function 1,
negative scores) from SA patients (Function 1,
positive scores) (Figure 1). The plaque Ca content
expressed 44% of the total variability identifying
NSTEMI patients whereas the remaining 8%
discriminated plaques with low NC content.
Both STEMI and UA patients showed plaques
with significantly higher FF content (median and IQ
of normalized area: STEMI - 14%, 8-20%; UA -
CARDIOTECHNIX2013-InternationalCongressonCardiovascularTechnologies
86
16%, 8-27%) when compared to NSTEMI and SA
patients (median and IQ of normalized area:
NSTEMI - 9%, 6-14%; SA - 6%, 3-12%) (p<0.001).
Plaques from STEMI and UA patients were also rich
in FB content (normalized areas of approximately
57% in both groups, contrasting with NSTEMI and
SA patients showing atheromas with lower content
of FB (normalized areas of 37% and 47%,
respectively) (p<0.001).
These two plaque components were positively
correlated with atheroma area, indicating that
increased contents of FB and/or FF were consistent
with large plaque areas. The atheroma area did not
differ between ACS groups. However all ACS
groups differ from SA, which showed the lowest
plaque areas (median, IQ25-IQ75: SA -7mm
2
, 5-
10mm
2
; STEMI - 12mm
2
, 7-13mm
2
; NSTEMI -
11mm
2
, 9-13mm
2
;
UA - 11mm
2
, 8-15mm
2
)
(p<0.001).
Figure 1: Scatterplot of the two first discriminant
functions. The atheroma area, FB and FF correlated with
function 1, whereas Ca was correlated with the
discriminant function 2.
The Ca content of plaques clearly identified
NSTEMI patients, as can be observed in Figure 1. In
fact, plaques of NSTEMI patients showed the
highest levels of calcified tissue (median, IQ25-
IQ75: 28%, 12%-35%) which were highly
significant when compared to the other groups of
patients (median, IQ25-IQ75: STEMI - 6%, 2%-
13%; UA - 6%, 2%-15%; SA - 14%, 3%-23%)
(p<0.001).
The highest correlation with the third
discriminant function (which had a limited
discriminating power) was observed for NC. The
limited importance of NC in group stratification, and
therefore in phenotype identification is consistent
with the similar variance of NC, although the plaque
NC contents significantly differed between groups,
as will be referred below.
The influence of plaque constriction was also
evaluated in addition to plaque outward expansion.
Both the discriminating models showed similar
solutions. When the lumen area was added, three
significant functions were obtained, of which the
two first discriminating functions explained most of
the variability (92%). The first discriminating
function clearly correlated plaque FB and FF
contents (51% of total variance explained)
differentiating STEMI from UA patients whereas the
second discriminating function correlated the
atheroma size with Ca distinguishing NSTEMI from
SA.
Thus, the results obtained were similar to the
previous model, which only considered atheroma
area and plaque structure.
The third function, although significant only
explained a moderate 8% of the total variance and
correlated the decrease of luminal area with the rise
of NC content and helped distinguishing STEMI and
UA patients. In fact UA showed larger luminal areas
(median, IQ25-75: 9mm
2
, 5-16 mm
2
) and diminished
NC area (median, IQ25-75: 1.1mm
2
, 0.4-2.2mm
2
)
when compared to STEMI (median, IQ25-75: lumen
area - 6mm
2
, 3-10mm
2
; NC – 1.5mm
2
, 0.8-2.3mm
2
).
However the differences between these two groups
for NC plaque content were as relevant as those
observed for NSTEMI and SA patients (p≤0.001).
The latest showed large necrotic areas when
compared to UA and STEMI patients (median of
normalized area NC>23% vs NC<17% for STEMI
and UA).
Moreover, if plaque burden is included in the
model, the plaque content relationship was
maintained and equally explained by the two first
functions as previously described. The third
component of the model expresses minor variance
associated with lumen area, which changes are
opposite to plaque burden and NC content.
This reinforces the view that large luminal areas
associate to expansive plaques and that NC may play
a role in constrictive plaque phenotype, as observed
in SA patients.
5 DISCUSSION
The structure of atheroma was assessed in depth and
along the length of coronary segments of interest
PlaqueVulnerabilityPhenotypeinPatientswithCoronaryArteryDisease-AnIntravascularUltrasoundRadiofrequency
Analysis
87

using VH-IVUS modality. The plaque
characteristics were studied by extracting data of
selected cross-sections and of the total number of
frames of the scanned region of the vessel.
The study showed that both vessel characteristics
and morphology were underestimated when
selecting few points along the vessel by report to a
multiframe approach covering the whole length of
the injured region of the coronary. The detailed
evaluation of the atheroma structure paved the way
to define plaque phenotypes describing different
clinical presentations of CAD.
Large plaque areas with distended elastic lamina,
rich in fibrotic and fibro-fatty tissues were
associated with STEMI and UA. Variants of this
phenotype consisting of large calcium deposits and
reduced lumen area were prevalent in NSTEMI
patients. SA patients consistently showed plaques
with small areas, marked constrictive growth and
low FF content.
These findings suggest that SA and NSTEMI
were associated with more constrictive remodelling
whereas STEMI and UA were associated to
expansive remodelling. In addition, the phenotype
associated to STEMI and UA patients, can be
connected to plaque rupture and/or plaque
instability.
In previous studies using VH IVUS the plaque
instability had been associated to nonrestenotic thin-
capped fibroatheroma and adverse outcomes
(Calvert et al., 2011). Samady et al (2011) reported
on the influence of shear stress in plaque constrictive
and expansive remodelling was associated with the
development of necrotic core and FB and FF content
suggesting that the excessive expansive remodelling
is indicative of plaque vulnerability.
The limited importance of necrotic core for
plaque phenotypes and the association with luminal
areas and plaque burden suggests that this plaque
component may be involved in constrictive plaque
growth, possibly having a limited value to plaque
vulnerability occurring in ACS.
However, a thoroughly evaluation of the
atheroma in terms of necrotic core depth and thin
cap extension should be further addressed (Fayad
and Fuster, 2001); (Goldstein, 2000). These features
may help improving vulnerability phenotype
definition.
6 CONCLUSIONS
Specific plaque phenotypes were associated to ACS
and non-ACS.
Vessels with enlarged lumens and with plaques
characterized by marked outward growth and high
fibrotic and fibro-fatty contents were found in
STEMI and SA patients. NSTEMI patients allied to
the above plaque structure an important increase of
calcified tissue and a plaque bi-directional growth,
both outwards and inwards the vessel lumen.
A second plaque phenotype characterized by
small constrictive and fibrotic plaques, with low
fibro-fatty content was associated with SA patients
Therefore, IVUS-derived plaque measures
provided phenotypes of plaque vulnerability and
rupture that may help improving risk stratification of
symptomatic patients.
ACKNOWLEDGEMENTS
The study was carried out under Fundação para a
Ciência e Tecnologia PIC/IC/82734/2007 research
contract.
REFERENCES
Calvert, P. A., Obaid, D. R., O’Sullivan, M., Shapiro,
L.M., McNab, D., Densem, C. G., Schofield, P. M.,
Braganza, D., Clarke, S.C., Ray, K. K., West, N. E. J.,
Bennett, M. R., 2011. Association Between IVUS
Findings and Adverse Outcomes in Patients with
Coronary Artery Disease. The VIVA (VH-IVUS in
Vulnerable Atherosclerosis) Study. J Am Coll Cardiol
Img 4:894-901.
Fayad, Z. A., Fuster, V., 2001. Clinical imaging of the
high-risk or vulnerable atherosclerotic plaque, Circ
Res 89: 305-316.
Garcia-Garcia, H. M., Klauss, V., Gonzalo, N. Garg, S.
Onuma, Y., Hamm, W., Wijns, W., Shannon, J.,
Serruys, P. W. 2012. Relationship between
cardiovascular risk factors and biomarkers with
necrotic core and atheroma size: a serial
radiofrequency data analysis. Int. J. Cardiovasc.
Imaging 28:695-703.
Nair, A., Margolis, M. P., Kuban, B. D., Vince, D. G.,
2007. Automated coronary plaque characterisation
with intravascular ultrasound backscatter: ex vivo
validation. EuroIntervention 3:113–120.
Goldstein, J. A., Demetriou, D., Grines, C. L., Pica, M.,
Shoukfeh, M., O'Neill, W. W., 2000. Multiple
complex coronary plaques in patients with acute
myocardial infarction, New Engl J Med 343: 915-22.
Ramos, C., Napoleão, P., Cruz Ferreira, R., Fondinho, C.,
Selas, M., Mota Carmo, M., Crespo, A. M., Pinheiro,
T., 2013. Relationship Between Ox–LDL, Immune
Cells, Atheroma Dimensions and Angiographic
Measurements Assessed by Coronary Angiography
and Intravascular Ultrasound. In What Should We
CARDIOTECHNIX2013-InternationalCongressonCardiovascularTechnologies
88

Know About Prevented, Diagnostic, and
Interventional Therapy in Coronary Artery Disease,
Ed: Baskot B.G., InTech.
Samady, H., Eshtehardi, P., McDaniel, M. C., Suo, J.,
Dhawan, S. S., Maynard, C., Timmins, L. H.,
Quyyumi, A. A., Giddens, D. P., 2011. Coronary
Artery Wall Shear Stress Is Associated With
Progression and Transformation of Atherosclerotic
Plaque and Arterial Remodeling in Patients With
Coronary Artery Disease, Circulation 124:779-788.
Stone, G. W., Maehara, A., Mintz, G. S., 2011. The
Reality of Vulnerable Plaque Detection, J Am Coll
Cardiol: Cardiovascular Imaging 4: 902-904.
Vancraeynest, D., Pasquet, A., Roelants, V., Gerber, B. L.,
Vanoverschelde, J. J., 2011, Imaging the Vulnerable
Plaque, J Am Coll Cardiol 57: 1961–79.
PlaqueVulnerabilityPhenotypeinPatientswithCoronaryArteryDisease-AnIntravascularUltrasoundRadiofrequency
Analysis
89
