
Driver Drowsiness Estimation from Facial Expression Features
Computer Vision Feature Investigation using a CG Model
Taro Nakamura, Akinobu Maejima and Shigeo Morishima
Department of Applied Physics, Waseda University, Tokyo, Japan
Keywords: Drowsiness Level Estimation, Face Texture Analysis, Wrinkle Detection, Edge Intensity, K-NN, CG for CV,
Investigating Drowsiness Feature.
Abstract: We propose a method for estimating the degree of a driver’s drowsiness on the basis of changes in facial
expressions captured by an IR camera. Typically, drowsiness is accompanied by drooping eyelids.
Therefore, most related studies have focused on tracking eyelid movement by monitoring facial feature
points. However, the drowsiness feature emerges not only in eyelid movements but also in other facial
expressions. To more precisely estimate drowsiness, we must select other effective features. In this study,
we detected a new drowsiness feature by comparing a video image and CG model that are applied to the
existing feature point information. In addition, we propose a more precise degree of drowsiness estimation
method using wrinkle changes and calculating local edge intensity on faces, which expresses drowsiness
more directly in the initial stage.
1 INTRODUCTION
In recent years, the rate of fatal motor vehicle
accidents caused by distracted driving has been
increasing. This problem results from factors such as
sleeping at the wheel. Therefore, there is an urgent
need for an alert system that detects driver
drowsiness and prevents accidents by warning
drivers before they fall asleep.
To detect drivers’ drowsiness, Hiroki et al.
(1997) and Nakaho et al. (1997) measured
physiological indexes, such as brain waves, by
attaching a sensor to a driver’s body in a driving
simulator. Hong et al. (2005), Chin et al. (2005), Pai,
et al. (2009), Rami et al. (2011), and Huang et al.
(2012) also used physiological indexes, such as
electroencephalogram (brain activity),
electrooculography (eye movement), and
electrocardiogram (heart rate). Minoru et al. (2008)
used the pupillary response to estimate drowsiness.
However, because sensors must be attached to the
driver’s body in the above-mentioned techniques,
they are not suitable for in-vehicle systems.
To increase driver comfort, non-contact
measuring systems using computer vision techniques
have been studied. In particular, many studies have
focused on changes related to the eyes. Hiroshi et al.
(1994), Chu et al. (2004), D'Orazio et al. (2007),
Ayumi et al. (2009), Marco et al. (2010), Artem and
Jong (2012), and Garc´ıa et al. (2012) estimated
drowsiness on the basis of changes in the appearance
of the eyes. However, drowsiness-induced changes
in facial features do not involve just the eyes.
Moreover, the appearance of the eyes change only
when a person is extremely drowsy, which is the
exact case just before an accident.
Vidyagouri and Umakant (2013), Mohammad
and Mohammad (2011), and Ping and Lin (2012)
have reported several studies considering other
facial features. They detected drowsiness using
blinking and yawning features with vision
techniques. They determined that a driver is drowsy
when he/she is yawning or his/her blink becomes
slow, which is very simple and remains questionable.
Esra et al. (2007, 2010) considered various facial
expressions by detecting facial action units.
However, their goal was to detect facial expressions
just one minute before an accident, which are clearly
detectable only by using eye features. Therefore,
whether the expression features were effective is
unclear. In addition, it is too late to warn a driver
just one minute before an accident. A system that
warns in the initial stage of drowsiness is needed.
After analyzing a video of captured facial
expressions, Satori et al. (2010) and Kenji et al.
(2010) focused on the movement of facial feature
207
Nakamura T., Maejima A. and Morishima S..
Driver Drowsiness Estimation from Facial Expression Features - Computer Vision Feature Investigation using a CG Model.
DOI: 10.5220/0004648902070214
In Proceedings of the 9th International Conference on Computer Vision Theory and Applications (VISAPP-2014), pages 207-214
ISBN: 978-989-758-004-8
Copyright
c
2014 SCITEPRESS (Science and Technology Publications, Lda.)
points on the eyes, eyebrows, and mouth. In these
studies, the drowsiness degree was evaluated on the
basis of changes in these points with reference to an
awakened state. However, because these studies
considered only facial feature points, capturing
drowsiness-induced changes in facial skin, such as
wrinkles, is impossible.
In this study, we detect a new drowsiness feature
by comparing video images and a CG model that
adapted existing feature point information. In
addition, we propose a drowsiness-degree estimation
method that considers both scalar distance between
feature points and textural changes in specific areas
of the face. As a result, drowsiness can be estimated
more precisely without increasing driver discomfort.
The rest of this paper is organized as follows. In
section 2, we explain the experimental environment
and define degrees of drowsiness. Section 3
introduces a way of selecting facial features and
explains drowsiness features. In section 4, we
describe our learning and estimation method. In
sections 5 and 6, we evaluate our method. Finally,
we conclude our study in section 7.
2 DEFINITION OF DROWSINESS
LEVELS
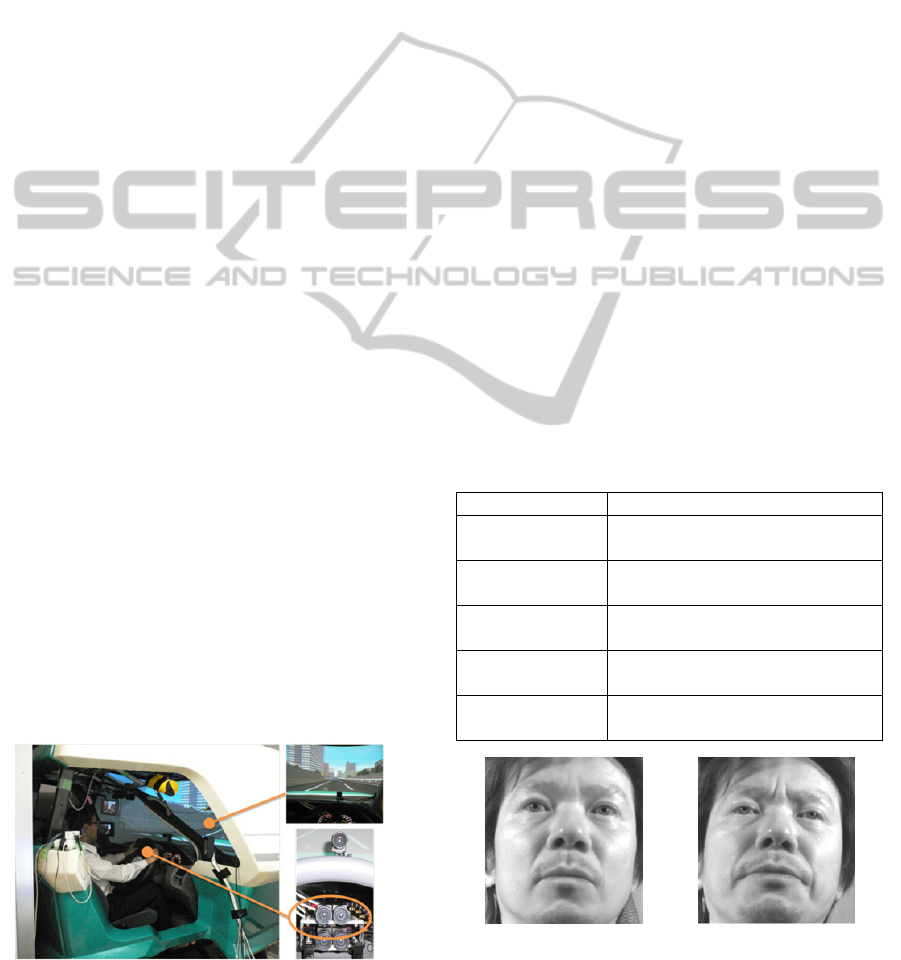
Using an IR camera (60 fps frame rate and 320 ×
240 pixels resolution) installed on the steering wheel
base (Figure 1), we first recorded a video of drivers’
faces while they were operating a driving simulator
(freeway circuit track). We instructed the subjects to
maintain a constant speed of 80 km/h and follow a
lead vehicle. The driving operation was recorded
over a maximum capture time of 1 h, and if
accidents occurred as a result of the driver falling
asleep, we aborted the recording process. This
process was performed for 30 subjects. Figure 2
illustrates the expressions recorded during the
experiment.
Figure 1: Experimental environment.
To estimate the degree of drowsiness, an objective
index of drowsiness is needed and Hiroki’s facial
expression estimation method (1997) is often used
(Ayumi, 2009; Satori, 2010; Kenji, 2010). In this
method, the drowsiness degree was divided into the
following five levels on the basis of the captured
video: “level 1: not sleepy,” “level 2: slightly sleepy,”
“level 3: sleepy,” “level 4: rather sleepy,” “level 5:
very sleepy.” Most existing studies have attempted
to capture the exact drowsiness feature just before an
accident, which corresponds to level 4 or 5.
However, according to Hiroki et al. (1997), traffic
accidents occur when the drowsiness degree is
greater than or equal to level 3. Therefore, our
objective is to accurately estimate the transition from
level 2 to level 3, and then detect the initial stage of
drowsiness.
The relationship between the drowsiness levels
and their distinctive behaviors are shown in Table 1.
Two assessors who studied the psychological
measurement technique estimated drowsiness on the
basis of the following procedures. First, the
assessors observed the facial expressions of the
participant and defined his evaluation criteria
(measure of evaluation) independently. Next, they
evaluated the drowsiness level every 5 s on the basis
of his individual criterion. Finally, the drowsiness
degree was set by taking the average of these two
drowsiness levels.
Table 1: Drowsiness Level and Behavior.
Drowsiness Level Behavior Example
1
“eyes move quickly” “motion is
active”
2
“eyes move slightly slow” “lip opens
a little”
3
“mouth moves” “touches the face”
“reseating”
4
“shakes head” “frequent yawning”
“blinks are slow”
5
“closes eyes” “head inclines
forward” “head falls backward”
(a) Awake (b) Drowsy
Figure 2: Example of expressions in the video.
VISAPP2014-InternationalConferenceonComputerVisionTheoryandApplications
208
3 DROWSINESS ESTIMATION
FEATURES
In this section, we introduce our drowsiness
estimation feature. In subsection 3.1, we explain the
drowsiness feature related to facial feature points. In
subsection 3.2, we introduce a new drowsiness
feature related to facial texture. Then, we propose a
way of investigating the computer vision feature
using a CG model.
3.1 Variation of Distance between
Feature Points
Drowsiness changes the facial expression. For
example, it affects the opening and closing of the
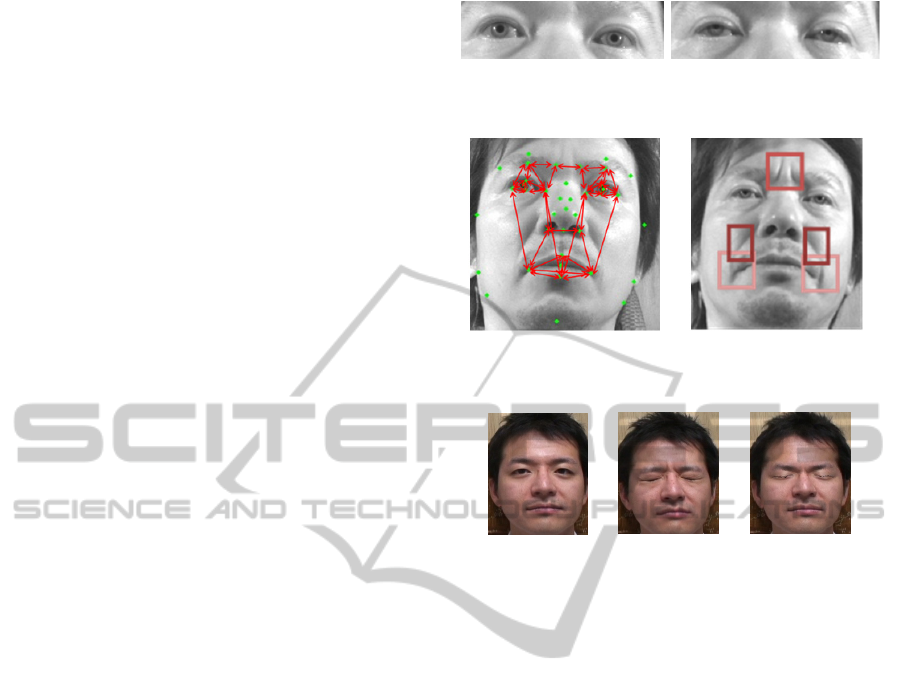
eyes. Eyes in both awake and drowsy states are
shown in Figure 3 (a) and (b), respectively. In the
drowsy state, the eyes of the subject are partially
closed. To capture changes in such facial
expressions, the variation of the distance between
two feature point positions from one awakened state
to another is considered as a feature parameter. By
calculating the variation, we can normalize the
individual distance of facial parts. When this feature
parameter increases, it acquires a positive value, and
vice versa.
In each video frame, Atsushi’s technique (2011)
detected forty feature points at 30 fps. Because we
used images from an IR camera, we could obtain
feature points even if the driver was wearing glasses
or sunglasses. We calculated 38 sets of distances
between two feature points related to eyes, eyebrows,
mouth, etc. We normalized the distance between the
eyes, to prevent any changes in the size of the face
with the driver’s movement. The distances
presumably reflect the expression changes caused by
drowsiness, and the feature parameters are the
lengths of the arrows in Figure 4 (a).
3.2 Variation of Edge Intensity
Although selection of features is very important in
any computer vision technique, demonstrating
whether the selected features are useful is often
difficult. In many cases, output from a vision task is
a numerical value. Therefore, we cannot always
understand essential phenomenon captured by each
feature. In this subsection, we introduce a way to
visualize vision features, allowing us to confirm
which feature should be captured.
(a) Awake (b) Drowsy
Figure 3: Feature of eyes.
(a) Distance parameters (b) Filtering area
Figure 4: Distance parameters and filtering area.
(a) Awake (b) Drowsy (c) CG face model
Figure 5: Detecting a new feature.
3.2.1 Investigation of a New Drowsiness
Feature
To estimate drowsiness more precisely, we need to
select an effective feature. To detect a new feature,
we used a drowsy CG face model applied to feature
point information. We deformed the shape of 661
points 3D mesh according to 40 feature points of a
drowsy face using radial basis functions (Jun, 2000).
Then, we mapped an awakened texture (Figure 5 (a))
to this deformed model frame by frame. We
compared the original images and CG models and
identified features that should be captured.
We can see that the drowsiness feature of closing
eyes is captured by the feature points (Figure 5(b)
and 4(c)). However, compared with the real video,
the CG model does not look sufficiently sleepy. We
postulate that a drowsiness model based on feature
points cannot emulate all features of drowsiness. For
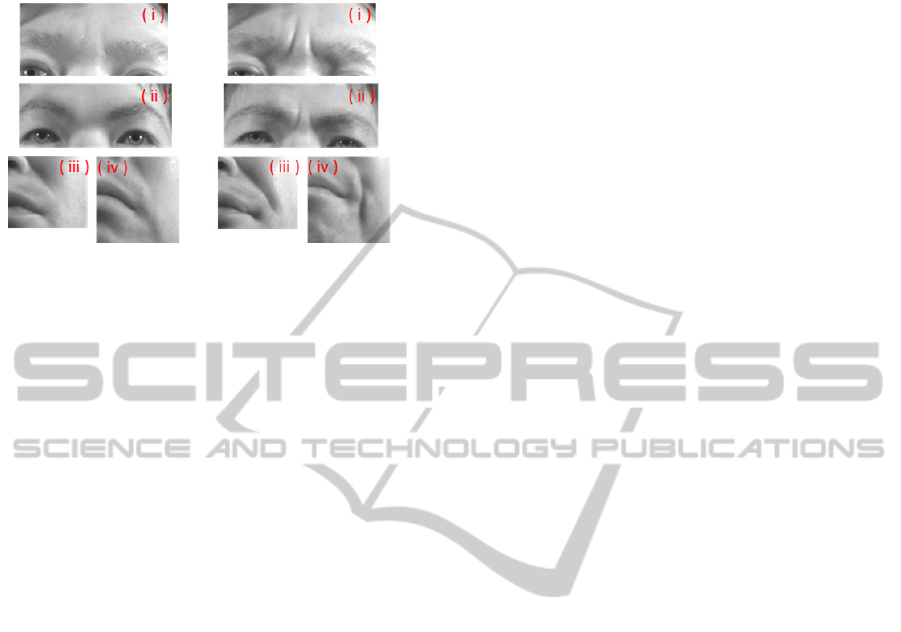
instance, we noticed that wrinkles affect the
impression of drowsiness, appearing on brows,
mouth, and nasolabial folds when a subject resists
drowsiness (Figure 6). Although many existing
studies have focused on cases of extreme drowsiness
just before an accident, the facial expressions that
indicate resistance to drowsiness, such as wrinkled
expressions, emerge in the initial stages of
DriverDrowsinessEstimationfromFacialExpressionFeatures-ComputerVisionFeatureInvestigationusingaCGModel
209
drowsiness. It is impossible to acquire such textural
changes solely from feature points.
(a)Awake (b)Drowsy
Figure 6: Wrinkle feature at brows, mouth, and nasolabial
fold.
3.2.2 Capturing Wrinkled Expressions
To capture wrinkled expressions, the variation of
edge-intensity from the awakened to drowsy states is
considered as a feature. Some subjects had deep
wrinkles even in the awakened state, as shown Figure
2. Therefore, by calculating the variation, we
normalized individual differences. These edge-
intensity features were calculated by applying
Laplacian filtering at five areas on the face, as shown
in Figure 4 (b): between the eyebrows, nasolabial
folds, and corners of the mouth. We defined edge
intensity as the average luminosity value obtained
after filtering with a 3 × 3 Laplacian filter. We
adopted the Laplacian filter because the correlation
between the wrinkles and edge intensity calculated
by applying it has been proven to be higher
compared to that obtained by adopting the Sobel
filter and Gabor filter used in our pre-examination.
4 DROWSINESS ESTIMATION
ALGORITHM
4.1 K-NN based Learning and
Estimation
Drowsiness was estimated using the k-NN method
with the feature vector connecting the variations of
the distance between two feature points and edge
intensity. We used the k-NN method because Satori
et al. (2010) estimated drowsiness levels on the basis
of future point and reported that the k-NN method
yields the best accuracy compared to other methods
such as the multiple regression and subspace
methods. Feature vectors corresponding to each
frame of the videos were calculated and averaged
every 300 frames (5 s) in both learning and testing
stages. Naturally, the absolute scale and range of
“distance” and “edge intensity” in the feature vector
differed. Therefore, we introduced the generalized
Mahalanobis distance. The dispersion matrix
corresponding to the Mahalanobis distance was
calculated by the learning data as the distance
measured in the search of k-NN.
4.2 Drowsiness Transition Constraint
Usually, the drowsiness level does not rapidly
increase or decrease. Observation of the recorded
videos confirmed that the drowsiness level gradually
increases for almost all subjects. In addition,
drowsiness increases almost monotonically and
decreases in some limited situations, for example,
when the driver notices that his/her car is deviating
from the traffic lane, he/she startled. Therefore, we
constrained that the current estimated level increases
by only one level or remains constant with respect to
the present level over 30 s and decreases by only one
level or remains constant with respect to the current
level over 10 min. Using these constraints, rapid
increases or decreases in the estimated drowsiness
level and gradual changes in the drowsiness level
could be prevented.
5 EVALUATION (I)
We conducted an evaluation experiment to confirm
the validity of the proposed method. We considered
the following three cases.
Case 1: Only the “variation of the distance
between two points” was used as a feature.
Case 2: Only the “variation of edge intensity”
was used as a feature.
Case 3: Both “variation of the distance between
two points” and “variation of edge intensity” were
used as features.
We used the following two criteria in each case
for the evaluation index.
Correct answer rate:
The correct answer rate is defined as the
percentage of the number of correctly estimated data
compared to the ground truth level, which is the
integer level from 1 to 5.
Root mean square error (RMSE)
RMSE is the root mean square error between the
estimated and ground truth levels and is expressed as
follows.
VISAPP2014-InternationalConferenceonComputerVisionTheoryandApplications
210
RMSE
∑
(1)
where N is the number of test data,
is a correct
level of test data i, and
is the estimated level.
In estimation of useful features, the correct
answer rate will be high and RMSE will be low. If
the estimation performance improves by using both
features, the following two things can be proved.
First, combining the variations of the distance
between two feature points and edge intensity
feature is possible. Second, each feature is able to
capture different drowsiness features.
5.1 Learning and Testing for the Same
Subject
Because of the difficulty in collecting data from
subjects, a small dataset was used in this study.
Eight experimental subjects fulfilled the following
conditions:
subjects with a high correlation between self-
assessed and adjudged drowsiness levels.
subjects with a stable state of drowsiness
between levels 1 and 5.
The videos were divided into levels on the basis
of the assessed ground truth level, and each video
was further divided into alternate halves. One half
was used for learning data, while the other half was
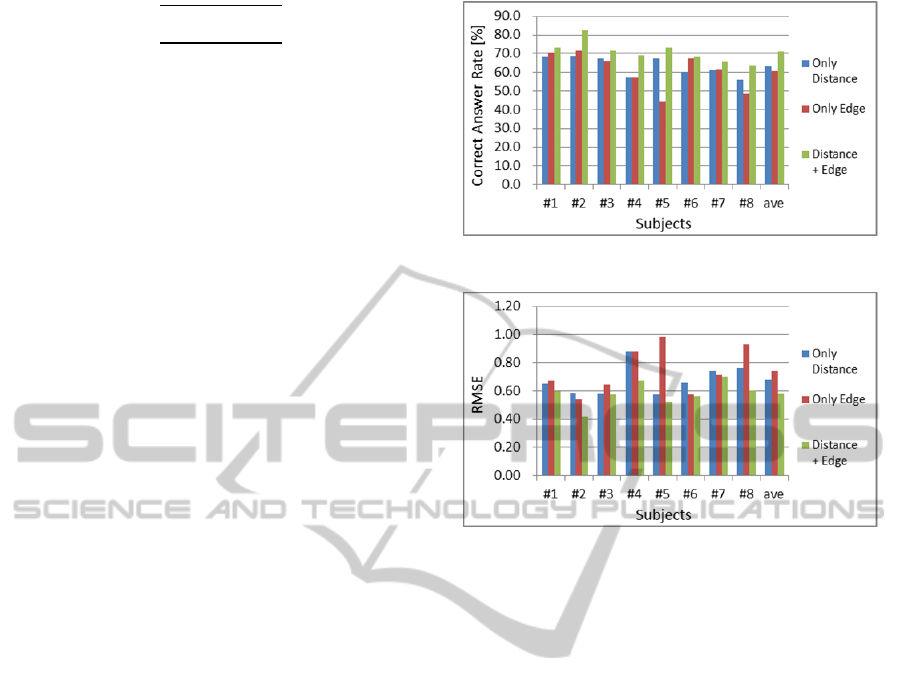
used for testing data. The correct answer rate and its
average value for the eight subjects are shown in
Figure 7. RMSE and its average value for the eight
subjects are shown in Figure 8. Our proposed
method recorded the highest correct answer rate with
an average of 71% and the lowest RMSE with an
average of 0.58.
5.2 Discussion
By using both features, the highest correct answer
rate and lowest RMSE were evaluated. We
confirmed that combining two types of features is
possible and each feature is able to capture different
drowsiness features.
In the case of subjects #5 and #8, the
contribution of the edge feature is not significant
because few wrinkles were generated on their faces
when they resisted drowsiness. On the other hand,
subject #2 was appropriate for our method with the
best correct answer rate of 82.4% because he
resisted drowsiness with deep wrinkles.
Figure 7: Correct answer rate.
Figure 8: RMSE.
6 EVALUATION (II)
6.1 Learning and Testing by
Leave-one-out
In an actual driving situation, generating learning
data beforehand from subjects other than the driver
is necessary. Therefore, we attempted to use the
leave-one-out approach. Because our purpose is to
provide a warning when the drowsiness level
reaches 3, verifying whether level 3 or higher levels
have been correctly distinguished from level 2 or
lower levels is necessary. Furthermore, the boundary
between levels 2 and 3 must be detected precisely to
alert the driver at the right time. Therefore, the time
difference between a detected boundary and ground
truth boundary was selected as a criterion to evaluate
the detector performance. Then, using the distance
and edge features, the following experiment was
conducted.
This test targeted 10 subjects with a high
correlation between the self-assessed and adjudged
drowsiness levels. The test targets #9 and #10 did
not exhibit the level 1 state. We selected one person
for this test and the other nine for learning data. First,
levels 1–5 were separated into five classes, using the
k-NN method. Next, the result was categorized as
DriverDrowsinessEstimationfromFacialExpressionFeatures-ComputerVisionFeatureInvestigationusingaCGModel
211
the awakened class represented by levels 1 and 2 and
the drowsy class, represented by levels 3, 4, and 5.
Finally, the correct answer rate of two class
separations was calculated. The correct answer rate
was defined as the percentage of correctly estimated
data compared to the ground truth class (awake or
drowsy class).
We confirmed that the average correct answer
rate of 10 subjects was 82.2% (Table 2). The time
difference between detected boundaries from levels
2 to 3 and ground truth is shown in Table.3. All
values in Table 3 are positive because boundary
moment is detected before real boundary in all
subjects’ cases. Drivers will be able to park their car
and prevent an accident in 319 s.
Table 2: Correct Answer Rate.
Subject Correct Answer Rate [%]
#1 64.5
#2 93.8
#3 71.8
#4 83.1
#5 80.5
#6 94.0
#7 78.1
#8 85.5
#9 88.2
#10 82.9
Average 82.2
Table 3: Time Difference.
Subject Time Difference [s]
#1 1005
#2 120
#3 45
#4 70
#5 655
#6 125
#7 560
#8 380
#9 215
#10 15
Average 319
6.2 Discussion
The correct answer rate of subject #1 was low
because wrinkles appeared on his nasolabial folds,
even though the drowsiness level was level 1.
Therefore, for this subject, the drowsiness level was
incorrectly estimated to be level 3. For people with
the peculiarity involving frequent movements of the
mouth, appropriate management is necessary, such
as lowering the weighting of the wrinkles feature.
Subjects resisting drowsiness with facial expressions,
such as #2 and #9, showed high correct answer rates.
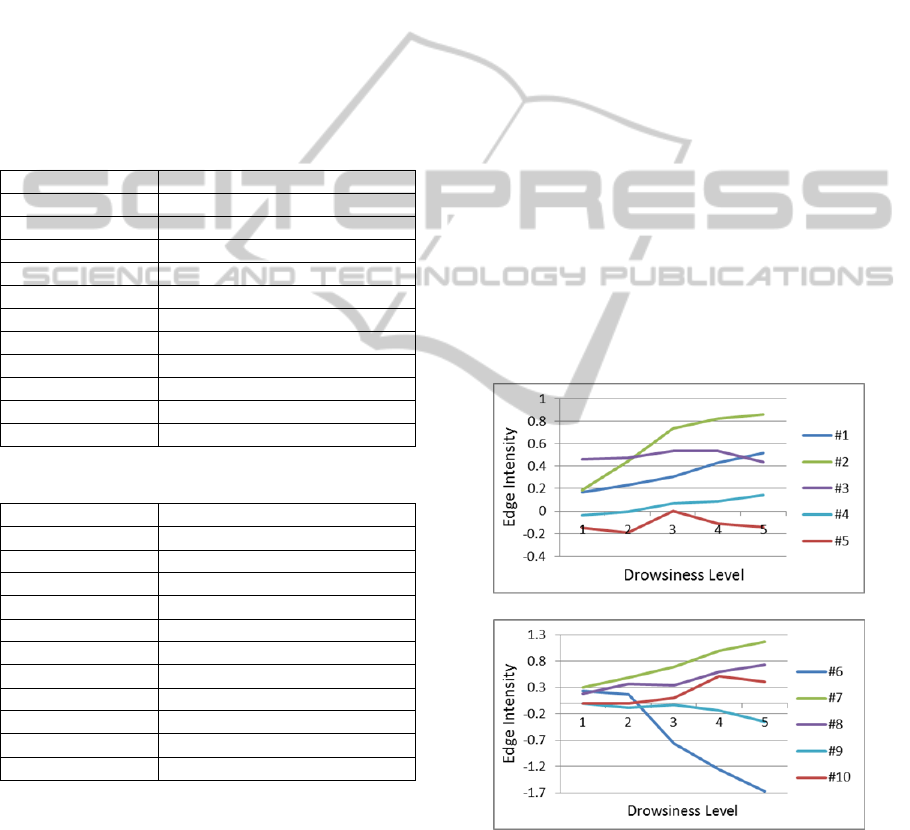
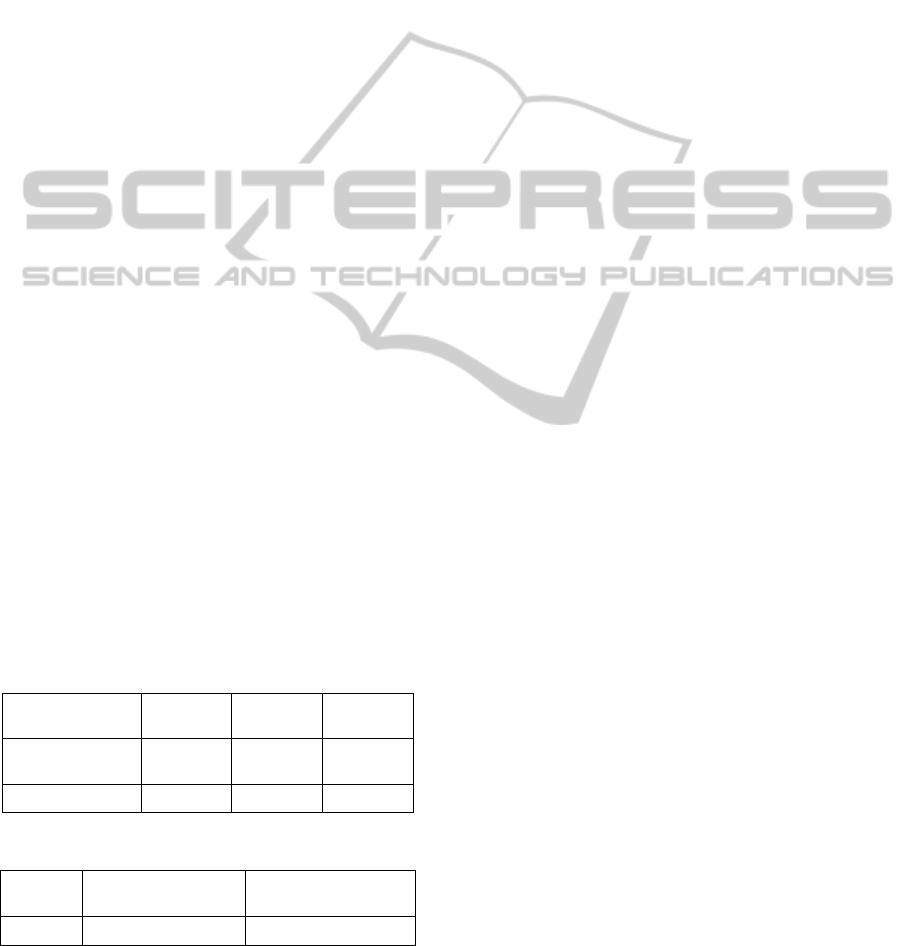
6.3 Subject Variation
Because expressions accompanying drowsiness
differ from person to person, the problem of
individual adaptation must be considered for
common use. Another problem is the normalization
of the degree of expression. The average value of
edge intensity on the brow domain in each
drowsiness level is shown in Figure 9. In the case of
subjects #1, #2, #4, #6, and #7, the edge intensity
increases with the drowsiness level having a
different absolute value and gradient. However, in
the case of subject #3, the edge intensity is nearly
constant for all levels. In the case of subject #6, his
hair was considerably long and extended into the
brow domain, resulting in an erroneous estimation.
Furthermore, there were subjects whose brow
wrinkles hardly changed, such as #9, but the
wrinkles around the mouth changed clearly and
could be correctly estimated. The adaptation method
for individual variations will be subsequently
considered.
(a) #1–#5
(b) #6–#10
Figure 9: Edge intensity feature.
VISAPP2014-InternationalConferenceonComputerVisionTheoryandApplications
212
7 CONCLUSIONS AND FUTURE
WORK
7.1 Conclusions
In this study, we proposed a drowsiness-estimation
method by combining facial feature point and
textural feature information.
First, we proposed a way of investigating vision
features, which is a comparison of an original video
and a 3D model that adapted existing features. Then,
we introduced the wrinkle feature, which has not
been studied till today, and we used it to improve the
estimation accuracy. Thereafter, we tested the
subject who was excluded from the learning data,
and we evaluated the corresponding RMSE and
correct answer rate.
The evaluation results with open tests for the
same subject are summarized in Table 4. We
evaluated the highest correct answer rate and lowest
RMSE value and compared these values with those
obtained using other single feature methods. We
used data from the same subject for both learning
and testing. When both the “variation of the distance
between two points” and “variation of the edge
intensity” were applied as features, the average
correct answer rate and average RMSE were found
to be 71.0%, and 0.58, respectively. Therefore, we
conclude that our method significantly improved
estimation accuracy. Concretely, the value of
estimation accuracy obtained from our method was
significantly higher than that obtained from methods
applying only a distance feature or an edge feature.
Evaluation results with open tests for different
subjects are summarized in Table 5. We realized two
classes of recognition (awake or drowsy class) with
an accuracy of 82.2% and average error of 319 s.
Table 4: Evaluation (I).
Only
Distance
Only
Edge
Distance
+ Edge
Correct answer
rate[%]
63.4 60.9 71.0
RMSE 0.68 0.74 0.58
Table 5: Evaluation (II).
Correct Answer
Rate [%]
Time Difference[s]
Average 82.2 319
7.2 Future Work
Following are the three future tasks.
First, to realize more precise drowsiness
estimation, we need to develop an optimization and
normalization technique individually for every user.
For example, we will select effective drowsiness
feature individually based on first 10 minutes
driving.
Second, we need to consider the option of
adapting the lighting environment. Although we can
capture the driver’s face even at night using IR
camera, there are some situations with which we
would have to cope in real driving conditions. For
example, when a vehicle exits a tunnel, the
expression of a driver may change as he/she is
dazzled by the light. However, environmental
transformations are estimated from the surrounding
luminance, and sequences of a vehicle exiting the
tunnel are presumably removed. We would have to
consider the influence of environment and lighting
on facial expressions to normalize and distinguish
the drowsiness information in an actual driving
scenario.
Third, for the test described in section 6, we took
2 h to extract drowsiness features and 10 min to
estimate drowsiness levels using k-NN for 1 h test
data (Intel Core i7-2600, 3.80 GHz). We estimated
drowsiness levels every 5 s. Therefore, the current
drowsiness level could be known after
approximately 6 s. Although, as shown in Table 3, it
is possible to detect drowsiness before 319 s, we
must examine the maximum allowable time delay. If
we need to estimate the drowsiness level in a real
time application, reducing the video frame rate from
60 fps to 30 fps can be considered as a solution.
ACKNOWLEDGEMENTS
This work was supported by ”R&D Program for
Implementation of Anti-Crime and Anti-Terrorism
Technologies for a Safe and Secure Society”, Funds
for integrated promotion of social system reform and
research and development of the Ministry of
Education, Culture, Sports, Science and Technology,
the Japanese Government.
REFERENCES
Artem, A. L. and Jong, S. L. (2012). Driver’s Eye
Blinking Detection Using Novel Color and Texture
DriverDrowsinessEstimationfromFacialExpressionFeatures-ComputerVisionFeatureInvestigationusingaCGModel
213

Segmentation Algorithms. International Journal of
Control, Automation and Systems, 10(2):317–327.
Atsushi, I., Mutsuki, T., Kozo, M., and Takayoshi, Y.
(2011). Improvements to Facial Contour Detection by
Hierarchical Fitting and Regression. The First Asian
Conference on Pattern Recognition, 273–277.
Ayumi, T., Md, S. B., and Koji, O. (2009). Estimation of
Drowsiness Level Based on Eyelid Closure and Heart
Rate Variability. 31st Annual International IEEE
Engineering in Medicine and Biology Society, 2543–
2546.
Chin, T. L., Ruei, C. W., Sheng, F. L., Wen, H. Chao., Yu,
J. C., and Tzyy P. J., 2005. EEG-based drowsiness
estimation for safety driving using independent
component analysis. IEEE Trans. Circuits Syst., 52:
2726–2738.
Chu, J., Jin, L., Guo, L., Guo, K., and Wang. R. (2004).
Driver’s eye state detecting method design based on
eye geometry feature. IEEE Intelligent Vehicles
Symposium, Parma, Italy, 357–362.
D'Orazio, T., Leo, M., Guaragnella, C., and Distante, A.
(2007). A visual approach for driver inattention
detection, Pattern Recognition, 40(8):2341–2355.
Esra, V., Marian, B., Gwen, L., Mujdat, C., Aytul, E., and
Javier, M. (2010). Discrimination of Moderate and
Acute Drowsiness Based on Spontaneous Facial
Expressions. 20th International Conference on Pattern
Recognition, 3874–3877.
Esra, V., Mujdat, C., Aytul, E., Gwen, L., Marian, B., and
Javier, M., 2007. Drowsy Driver Detection Through
Facial Movement Analysis. IEEE international
conference on Human–computer interaction, Rio de
Janeiro, Brazil, 4796: 6–18.
Garc´ıa, I., Bronte, S., Bergasa, L. M., Almaz´an, J., and
Yebes, J. (2012). Vision-based drowsiness detector for
Real Driving Conditions. IEEE Intelligent Vehicles
Symposium, 618–623.
Hiroki, K., Nakaho, N., Keiichi, Y., and Yoshihiro, G.
(1997). Prediction of Automobile Driver Sleepiness
(1st Report, Rating of Sleepiness Based on Facial
Expression and Examination of Effective Predictor
Indexes of Sleepiness). Trans. Jpn. Soc. Mech. Eng.,
96–1780 (Japanese).
Hiroshi, U., Masayuki, K., and Masataka, T. (1994).
Development of drowsiness detection system.
Proceedings of the 1994 Vehicle Navigation &
Information Systems Conference, 15–20.
Hong, J. E., Min, K. C., and Seong H. K. (2005).
Electroencephalographic study of drowsiness in
simulated driven with sleep deprivation. Int. J. ind.
Ergonom., 35:307–320.
Huang, K. C., Jung, T. P., Chuang, C. H., Ko, L. W., and
Lin, C. T. (2012). Preventing Lapse in Performance
using a Drowsiness Monitoring and Management
System. 34st Annual International Conference of the
IEEE Engineering in Medicine and Biology Society
,
3336–3339.
Jun, Y. N., Douglas, F., and Ulrich, N. (2000). Animated
deformations with radial basis functions. Proceedings
of the ACM symposium on Virtual reality software and
technology, 166–174.
Kenji, I., Satori, H., Teiyuu, K., and Masayoshi, K. (2010).
Feature Factors in Drowsy Expression and Application
of the Factors to Drowsiness Detection Method.
Society of Automobile Engineers of Japan, 41–
45(Japanese).
Marco, J. F., José, M. A., and Arturodela, E. (2010). Real-
Time Warning System for Driver Drowsiness
Detection Using Visual Information. Journal of
Intelligent & Robotic Systems, 59(2):103–125.
Minoru, N., Keiko, Y., and Fumio, K. (2008). Estimation
of Sleepiness using Frequency Components of
Pupillary Response. Biomedical Circuits and Systems
Conference 2008, 357–360.
Mohammad, A. A. and Mohammad, R. (2011). Driver
Drowsiness Detection Using Face Expression
Recognition. IEEE International Conference on Signal
and Image Processing Applications, 337–341.
Nakaho, N., Hiroki, K., Yoshihiro, G., and Keiichi, Y.
(1997). Prediction of Automobile Driver Sleepiness
(2nd Report, Prediction of Sleepiness and
Determination of Alarm Timing). Trans. Jpn. Soc.
Mech. Eng., 63(613): 3067–307 4 (Japanese).
Pai, Y. T., Weichih H., Kuo T. B. J., and Liang Y. S.
(2009). A Portable Device for Real Time Drowsiness
Detection Using Novel Active Dry Electrode System.
31st Annual International Conference of the IEEE
Engineering in Medicine and Biology Society, 3775–
3778.
Ping, W. and Lin, S. (2012). A Method of Detecting
Driver Drowsiness State Based on Multi-features of
Face. 5th International Congress on Image and Signal
Processing, 1171–1175.
Rami N. K., Sarath K., Sara L., and Gamini D. (2011).
Driver Drowsiness Classification Using Fuzzy
Wavelet-Packet-Based Feature-Extraction Algorithm.
IEEE Transactions on Biomedical Engineering,
58(1):121–131.
Satori, H., Teiyuu, K., Kenji, I., Hiroto, N., and Noriyuki,
O. (2010). Drowsiness Detection Using Facial
Expression Features. SAE International, 2010-01-0466.
Vidyagouri, B. H. and Umakant, P. K. (2013). Detection
of Drowsiness Using Fusion of Yawning and Eyelid
Movements. Communications in Computer and
Information Science, 361:583–594.
VISAPP2014-InternationalConferenceonComputerVisionTheoryandApplications
214
