
Indoor Air Quality Monitoring Network Design
based on Uncertainty and Mutual Information
Monika Maciejewska and Andrzej Szczurek
Faculty of Environmental Engineering, Wroclaw University of Technology, Wybrzeże Wyspiańskiego 27,
50-370 Wrocław, Poland
Keywords: Indoor Air Quality, Monitoring, Measurement Point Selection.
Abstract: Poor quality of indoor air is an important problem in the world today. Although credible methodology of
indoor air quality (IAQ) assessment has not been developed so far, the provision of relevant information is
necessary for taking actions towards its control. The currently accepted compromise is to focus on the
measurable physical and chemical parameters of indoor air as the basis for judging the thermal comfort and
chemical IAQ. These quantities show spatial and temporal variability, therefore infrequent or single location
measurements are usually insufficient for gaining an outlook of indoor air quality. Therefore, there are
preferred multipoint, continuous measurements. They may be realized by the indoor air quality monitoring
system. An interesting option for such system is a sensor network. This work presents a statistical method of
choosing the location of the nodes of the sensor network for indoor air quality monitoring. The method is
based on the information measures. The novelty of the presented approach consists in basing the nodes
selection on the information content of the data provided by the sensor network in discrete time moments.
The method was demonstrated as applied to the revision of an indoor air quality monitoring network in an
office building.
1 INTRODUCTION
Indoor air quality (IAQ) is a compelling
contemporary issue (Fanger, 2006). Poor air quality
contributes to the performance decrease, lowered
learning and work productivity and may have
negative impact on human’s health (Wyon, 2004). In
western civilization, the aggravation of IAQ issue
results mainly from the promotion of energy-
efficient construction. The evaluation of new
building technologies is focussed on capturing
energy performance and not assuring proper indoor
air quality (Ng et al., 2012). The perception of the
assurance of acceptable IAQ as being in conflict
with energy efficiency gives preference to airtight
building solutions and lower fresh air delivery rates.
It causes the decreased airing of indoor spaces and
deterioration of the quality of air the building
occupants breathe (Persily&Emmerich, 2012). In
such circumstances the indoor air is frequently
described as stale and unpleasant which gives rise to
the feeling of discomfort. It is worth mentioning that
the perceived discomfort triggers occupants actions
aimed at achieving comfort in ways that are
convenient to them rather than energy-conserving
(Gunay et al., 2013).
In the last years there were intensified the
research efforts aimed at better understanding the
problem of indoor air quality, developing the
methods of its description, assessment and control
(Weschler, 2011).
Indoor air quality is often defined by the extent
to which human requirements are met (Fanger,
2006). For that reason, one of relatively well
documented methods of IAQ assessment utilizes
human judgement. It is bases on the indicator called
percentage dissatisfied (PD) (Fanger, 1988).
Although the perceived air quality (PAQ) reflects
the opinion of people, who are the actual
beneficiaries of high quality of indoor air or suffer
from its deterioration, the method is unsuitable for
the continuous IAQ assessment. It is a considerable
shortcoming of the method. Due to using people, the
evaluation of the particular indoor space is
performed once or, at most periodically. Therefore it
is not a convenient source of information for the
systems which may control indoor air quality, e.g.
337
Maciejewska M. and Szczurek A..
Indoor Air Quality Monitoring Network Design based on Uncertainty and Mutual Information.
DOI: 10.5220/0004697403370344
In Proceedings of the 3rd International Conference on Sensor Networks (SENSORNETS-2014), pages 337-344
ISBN: 978-989-758-001-7
Copyright
c
2014 SCITEPRESS (Science and Technology Publications, Lda.)

heat, ventilation and air conditioning (HVAC)
systems (Marsik and Johnson, 2008).
The information which is useful in such context
may be provided by the instrumental measurement
methods. An instrumental method for assessing
indoor air quality has not been proposed so far. But,
there were identified some parameters of indoor air,
which offer an outlook of its quality. The very
informative parameters are e.g. air temperature and
humidity, which indicate the thermal comfort and
the concentrations of selected contaminants, which
cover the chemical aspect of IAQ. Currently there
are available relatively cheap instruments for the
continuous measurements of some of these
parameters. Majority of them utilizes solutions
provided by the sensor technology (Postolache et al.,
2005, Heinzerling et al., 2013).
The experimental data as well as the modelling
studies show, that the parameters of indoor air
display spatial variation and the time change
(Choi&Edwards, 2008; Li, 2009). The reasons for
that are numerous e.g. the shape and size of the
space, its furnishings, occupancy schema, HVAC
system design and operation, interactions with
outdoor conditions. Therefore, the measurements
performed rarely and in a single location may not be
sufficient for gaining the credible information on the
condition of indoor air. One would rather choose a
solution, which allows for measuring indoor air
parameters in many locations and more frequently.
An option which has a capacity of meeting these
objectives is a sensor system for monitoring indoor
air.
The design of sensor system involves a number
of issues, for example: defining network objectives,
selection of parameters to be measured, the choice of
measurement methods, selection of measuring
devices, establishing measurement procedures,
defining principles of data logging and transmission,
implementing methods of data processing and
analysis (Chen and Wen, 2008).
In this work, we focussed on the problem of
determining the number and locations of the
measurement points in the sensor system for indoor
air monitoring. This task is an important element of
the sensor system design process. The objective of
our work was to develop a method of selecting the
locations of measurement points, based on the
information criterion.
The information criteria were earlier applied in
the context of outdoor air pollution monitoring
networks validation (Husain and Khan, 1983,
Fuentes et al. 2007, Elkamel et al., 2008). The
common feature of these approaches was the
adoption of the perspective of the information
content of the variable. The novelty of the approach,
which is presented in this work, consists in utilizing
the information content of the message, which is
composed of the data provided by the sensor
network in a discrete time moment.
2 METHODS
In this work, the IAQ monitoring network is defined
as the set of sensors placed in the building, at the
defined locations which remain unchanged in time.
In the nodes of the network, the continuous
measurements of the selected parameters of indoor
air are performed and the measurement results are
recorded in an on-going manner. The sensor’s
identity is defined by the location of the
measurement point and by the measured parameter.
2.1 Uncertainty and Mutual
Information of the Message
The presented method for selecting localization of
the nodes of indoor air quality monitoring network
utilizes the concepts of uncertainty and mutual
information in the data set.
In an univariate case, the uncertainity u(x
i
) of an
event x
i
, also called a supprisal, is defined as
(Hartley, 1927):
u
x
log
p
x
(1)
where: p(x
i
) is the probability of that event, and x
i
:
i=1, 2, …, N is the set of all possible outcomes for
the variable X. In our reasoning, the event x
i
is the
observed value of the variable X. The uncertainty
indicates the amount of information lacking in case
the value x
i
of the variable remains unknown. In
other words, it tells the amount of information
received once the outcome x
i
was recorded. The
uncertainty is highest in case the least probable
event occurs, and the opposite. When using
logarithm base 2, the amount of information is
expressed in bits.
In a multivariate case, the uncertainty u(x
1i
, x
2i
,
…, x
ni
) of a set of events x
1i
, x
2i
, …, x
ni
occurring
jointly is defined as:
u
x
log
p
x
p
x
…p
x
(2)
where: p(x
ki
) is the probability of event x
ki
, for the
variable X
k
, where k=1,2,…n, and x
ki
: i=1, 2, …, N
is the set of all possible events for the variable X
k
.
The uncertainty given by formula (2) indicates the
amount of information received when recording the
SENSORNETS2014-InternationalConferenceonSensorNetworks
338

values of variables: X
1
, X
2
, …, X
n
which occurred
jointly. The information content of the message is
highest when the least probable outcomes of all
variables occur. The most likely outcomes reduce
the uncertainty to its smallest level. The formula (2)
is assumed correct, provided the variables are
statistically independent.
The following expression for the mutual
information between two events x
1i
and x
2i
occurring
jointly was proposed (Fano, 1961):
I
x
,x
log
p
x
,x
p
x
p
x
(3)
where: p(x
1i
) and p(x
2i
) are the probabilities of
observing the outcome x
1i
and the outcome x
2i
separately, while p(x
1i
, x
2i
) is the probability of their
joint occurrence. In our reasoning, the event x
1i
is
the realization of variable X
1
, while the event x
2i
represents an occurrence of variable X
2
. If there is
no association between the event x
1i
and x
2i
the
probability of their joint occurrence is comparable
with the product of the probabilities of the
independent events. In such case I ≈ 0. If there is a
connection between the outcomes x
1i
and x
2i
, the
relationship between the probabilities is either: p(x
1i
,
x
2i
) > p(x
1i
)p(x
2i
) and thus I >> 0, or p(x
1i
, x
2i
) <
p(x
1i
)p(x
2i
), which makes I<<0 (Church &
Hanks,1990).
In order to deal with the mutual information in a
more general, multivariate case there was applied
the following formula (Peng et al., 2005):
I
x
,x
,…,x
log
p
x
,x
,…,x
p
x
p
x
…p
x
(4)
where: p(x
1i
, x
2i
,…, x
ni
) is the probability of joint
occurrence of the events x
1i
, x
2i
,…, x
ni
. The events
are realizations of distinct variables: X
1i
, X
2i
,…, X
ni
.
2.2 Method for Choosing Location of
Indoor Air Quality Monitoring
Network Nodes
We show that by applying the concepts of
uncertainty and mutual information of the data there
may be defined an indoor air quality network, which
realizes a predefined task. By the task we understand
providing the measurement data which contains the
required information about the indoor air.
In our concept, the variable X represents the
parameter of indoor air, measured in a single node of
the sensor net. The event x
i
occurs when the
recorded value of the parameter belongs to the
predefined i
th
interval, which is a part of the full
range of values of the variable. It is important that,
in our concept, the message is the data set provided
by the sensor net. The message is associated with the
defined time interval, when one measurement is
performed in every node. Based on formula (1), the
amount of information in the message containing a
single value of the indoor air parameter is highest
when the least likely value of this parameter occurs.
The amount of information is smallest when the
most likely value is observed.
The set of variables X
1
, X
2
, …, X
n
represents one
parameter of indoor air, measured in different nodes
k=1,2, …, n of the sensor net, of size n. The set of
events x
1i
, x
2i
, …, x
ni
refers to the set of outcomes
recorded simultaneously in the nodes. Based on
formula (2) the amount of information in the
message is highest when the least likely value of the
parameter occurs in every node. In the opposite case
i.e. when dealing with the most likely outcomes
everywhere, the information content of the message
provided by the sensor net is smallest.
Assume, the events x
1i
, x
2i
, …, x
ni
recorded at the
same time in different nodes of the sensor net are not
independent. In this case, the uncertainty of the
corresponding message is smaller than given by (2).
In our concept the mutual information is applied to
indicate the degree of association between the data,
recorded in the same time moment in different
nodes. It gives an idea about the information overlap
between the messages on the values of the indoor air
parameters provided by different nodes of the sensor
net. That is, about the information redundancy in the
message.
We proposed to combine the concept of
uncertainty and mutual information into the joint
criterion for selecting the location of the sensor
network nodes. This joint criterion is the maximized
probability of delivering a message loaded with the
defined degree of uncertainty and the defined degree
of redundancy. To implement that, we need to know,
for every combination of nodes, the probability: p1 -
that it delivers the data of the required uncertainty
and the probability p2 - that it delivers the data of
the required mutual information. The probability, p
that a sensor set delivers the information featured by
the defined levels of uncertainty and redundancy
jointly is the product of the probability, p1 and p2.
A limiting case was particularly interesting to us
in this work. We aimed at defining the sensor
network which provides the messages featured by
the highest uncertainty and lowest mutual
information. The sensor network which meets this
assumption would be very appropriate for
monitoring indoor air quality in respect of abnormal
conditions detection.
IndoorAirQualityMonitoringNetworkDesignbasedonUncertaintyandMutualInformation
339

2.3 Implementation of the Method
In the proposed approach the coordinates of the
sensor net nodes are chosen from amongst the
candidate locations.
We propose that the selection of ultimate
locations is based on the screening measurements
performed in candidate locations, prior to
establishing the true sensor network. The choice of
screening measurements as the source of data is
justified by the highest accuracy of the acquired data
as compared to other sources e.g. modelling. In this
approach, the number of measurement points
involved in the screening study shall be bigger than
the final size of the network. However, we would
suggest using considerably less than dozens of them.
For the same reason, the candidate locations must
not be random, but their choice should be content-
wise. A number of premises are worth taking into
consideration. For example, when monitoring the
parameters which are indicative for the thermal
comfort, the distribution of heat and humidity
sources is important. In case of monitoring the
chemical indoor air quality the emission sources and
physicochemical properties of the pollutants shall be
taken into account.
The method of localization selection utilizes the
empirical probability distributions of IAQ
parameters in the candidate locations of the sensor
net nodes. The estimation of the empirical
distribution is based on the measurement data
acquired during the screening study. In order to
assure the appropriate selection of final monitoring
locations it is very important to obtain the most
reliable estimation of the indoor air parameters
probability distribution in candidate locations. It
may be assured by the proper selection of the time
period for the screening study. We suggest that the
period shall be selected to possibly fully cover the
typical examples of the building functioning. The
time resolution of the screening measurements shall
be no less than of the monitoring measurements.
The information measures given by formulas (2)
and (4) are sensitive to the number of data bins used
while calculating the empirical distributions of the
variable. Therefore, in order to assure the
comparability between different sets of nodes, we
assumed a constant number of bins for each indoor
air parameter.
Based on the screening network composed of n
nodes, there may be examined all k-element
combinations, where k<n. The best combination of
nodes is selected for each k-element group. The
necessity to consider the groups separately is a
consequence of the applied information measures
which are not indifferent to the length of the
message. Therefore, with the method the best
network of the predefined size may be chosen. This
feature is an advantage of the method, bearing in
mind the investment cost of the network is
determined by the number of nodes.
In order to identify the configuration of sensor
net nodes which is best for monitoring indoor air
quality episodes, the calculations must be performed
involving several steps. The uncertainty (2) and
mutual information (4) is calculated for every
message obtained in the period of screening
measurements, except for 1 and n-component
messages. We search for the combinations of nodes
which provide the message of highest uncertainty.
Such combination of each size e.g. 2-element, 3-
element and the like is found for every time point.
For every combination of nodes there is found the
probability p1 of fulfilling the criterion of maximum
uncertainty. It is a partial criterion in our method.
The analogical procedure applies regarding the
second partial criterion of minimum mutual
information. The corresponding probability is
denoted p2. The probability p that the particular
combination of sensor nodes fulfils the joint
criterion is the product p1p2. The maximum value of
p indicates the target combination of sensor net
nodes of size k.
3 EXPERIMENTAL
The method was applied to revise an existing IAQ
monitoring network in a building, which hosts open
space type offices. The locations of the measurement
points was based on the heuristics involving e.g. the
information on number of people in the surrounding,
distance from the walls, windows, doors, office
equipment, heaters and air nozzles.
We applied five sensors. They were distributed
on three floors of the building. Sensor1, the pair of
sensors 2 and 3 and the pair of sensors 4 and 5 were
located on different floors. Sensors 3 and 5 were
located in a similar surrounding. The open spaces
hosted about 60 people each and the indoor air had
no direct contact with the external walls of the
building. In spaces where there were located sensors
1, 2 and 4 the air was in contact with the external
walls of the building fitted with the airtight
windows. In each space the windows were exposed
to different sides of the world. Sensor 1 was located
in the most populated surrounding and sensor 2 in
the least populated one.
SENSORNETS2014-InternationalConferenceonSensorNetworks
340
The measuring instruments applied were dedicated
to the continuous measurements of air temperature
and relative humidity. They offered measurement
accuracy of relative humidity ±3% and temperature
±0.5 C. The measurement data was recorded with
the time resolution of 2 min.
The basis for the revision of sensor net was one
week of measurements. In circumstances, the
method was applied for sensor network design this
would be a period of a screening study. While
calculating the empirical probability distributions for
the measured parameters in the measurement points,
we divided the full range of values, recorded in the
one week period, into nine intervals. The same
approach was applied to temperature and relative
humidity data in all candidate nodes.
4 RESULTS AND DISCUSSION
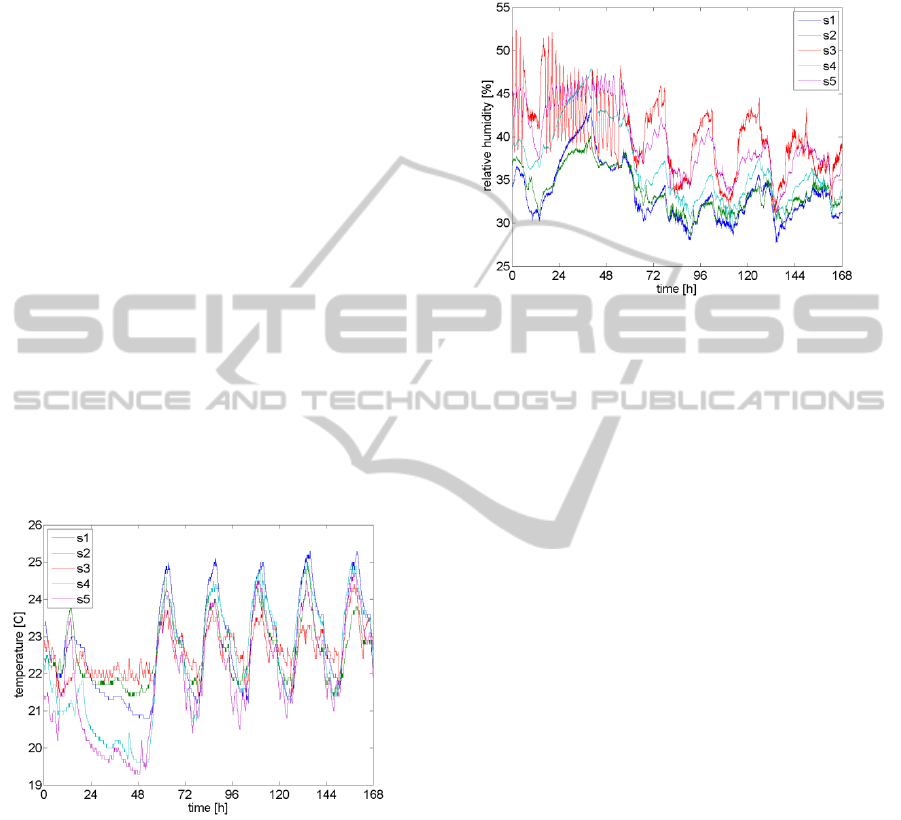
The record of indoor air parameters measured in an
office building is shown in Fig. 1 and in Fig. 2. The
data on temperature (Fig. 1) and relative humidity
(Fig. 2) were collected in course of measurements,
which continued for one week. The study involved
five candidate locations of the sensor net nodes.
Figure 1: Temperature record at five candidate locations of
the sensor net nodes. The screening data was recorded in
course of one week, starting from Sunday.
As shown in Fig. 1 the temperature record at the
candidate locations for the sensor net nodes was
quite similar. Based on Fig. 2, also relative humidity
records in different locations showed similar
regularities. If based the data presented just in this
way, the choice of a sub-network to best monitor
abnormal conditions of temperature and humidity
would not be straightforward.
We approached the task using the sensor net
nodes selection method which was introduced in this
work. Based on this method the sensor net designed
to monitor the infrequent occurrences shall provide
the data loaded with highest uncertainty and lowest
mutual information.
Figure 2: Relative humidity record at five candidate
locations of the sensor net nodes. The screening data was
recorded in course of one week, starting from Sunday.
All sensor combinations were analysed on the
ground of the probability to deliver the messages
featured by the maximum uncertainly. The messages
containing data on temperature and the messages
containing data on relative humidity were analyzed
separately. One element and n-element messages
were excluded from the analysis.
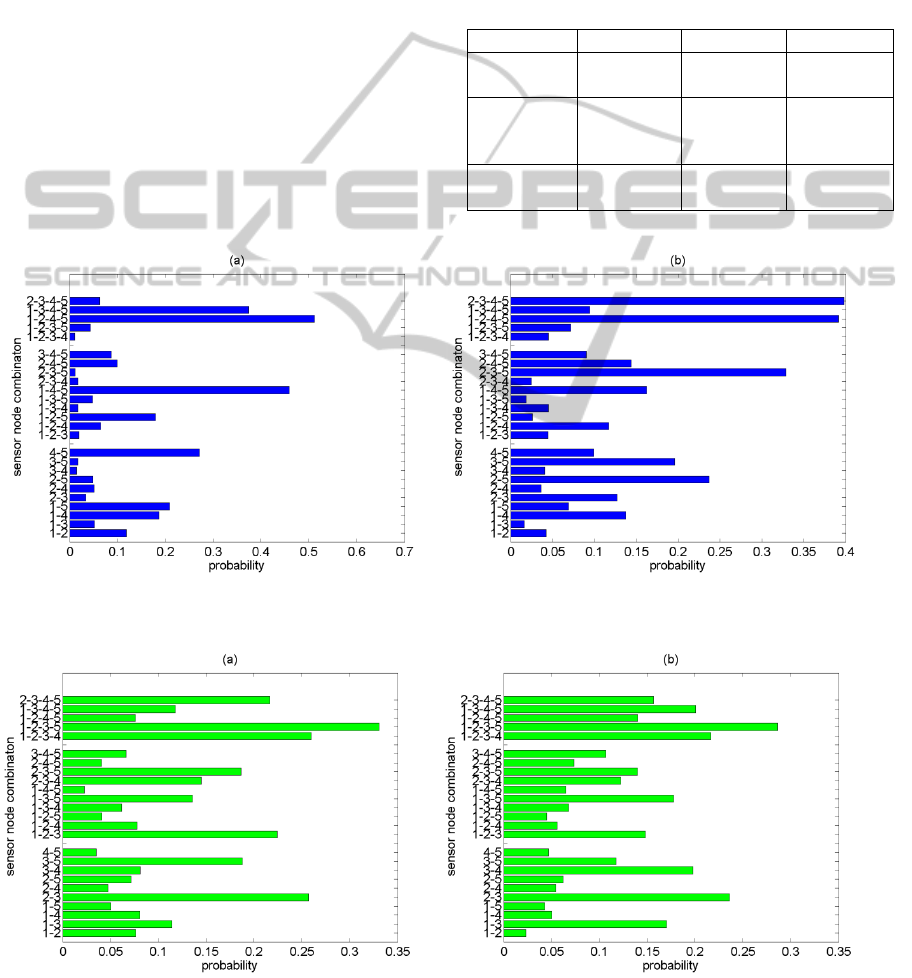
In Fig. 3a there is shown the probability of
acquiring the data of maximum uncertainly on
indoor air temperature, Different combinations of
sensor net nodes were displayed. The analogical
results regarding air humidity are presented in Fig.
4a.
The probability of obtaining the data which has
the smallest mutual information was calculated for
different sensor combinations. One element and n-
element combinations were excluded from the
analysis. The results obtained for temperature are
shown in Fig. 3b. The results on relative humidity
are presented in Fig. 4b.
The sensor combinations were also examined
against the joint criterion of delivering messages
loaded with highest uncertainty and lowest mutual
information. The obtained probabilities are shown in
Fig. 5.
The summary of the best combinations of nodes
for temperature monitoring is provided in Table 1.
The combinations which were best for air humidity
measurements are listed in Table 2.
The criteria of highest uncertainty and lowest
mutual information are complementary at the
conceptual level. The first criterion points at the
IndoorAirQualityMonitoringNetworkDesignbasedonUncertaintyandMutualInformation
341
sensor combinations which detect the least likely
events. The second one allows for minimizing the
redundancy in the provided data set. The results
shown in Fig. 3 and in Fig. 4 well illustrate that the
criteria really led to the selection of different sensor
sets.
If the events recorded in different nodes occurred
independently, the uncertainty criterion would be
sufficient to define the sensor net dedicated for
monitoring the infrequently occurring events.
However, in many cases the events which are
recorded simultaneously in different nodes are
associated with each other. That results in an
information overlap between the data on their
occurrence. For this reason, in our method we
included additionally the mutual information
criterion. It makes the choice of sensor nodes more
realistic. The resulting sensor net shall be best suited
to record the episodes in indoor air quality while
guaranteeing the minimum redundancy of the
provided information. Based on the comparison
between Fig. 5a and Fig. 3a, , the joint criterion led
to selecting different best combinations of
temperature sensors as compared to the ones
indicated by the criterion of maximum uncertainty.
The same observation regarding the best location
humidity sensors results from the comparison
between Fig. 5b and Fig. 4a.
Table 1: Best combinations of sensor net nodes for indoor
air temperature monitoring.
Criterion 2 nodes 3 nodes 4 nodes
Maximum
uncertainty
45 145 1245
Minimum
mutual
information
23 123 1235
Joint
criterion
14 145 1345
Figure 3: Probability of providing the messages on indoor air temperature loaded with: (a) maximum uncertainty, (b)
minimum mutual information, using different combinations of sensor net nodes.
Figure 4: Probability of providing the messages on indoor air humidity loaded with: (a) maximum uncertainty, (b)
minimum mutual information, using different combinations of sensor net nodes.
SENSORNETS2014-InternationalConferenceonSensorNetworks
342
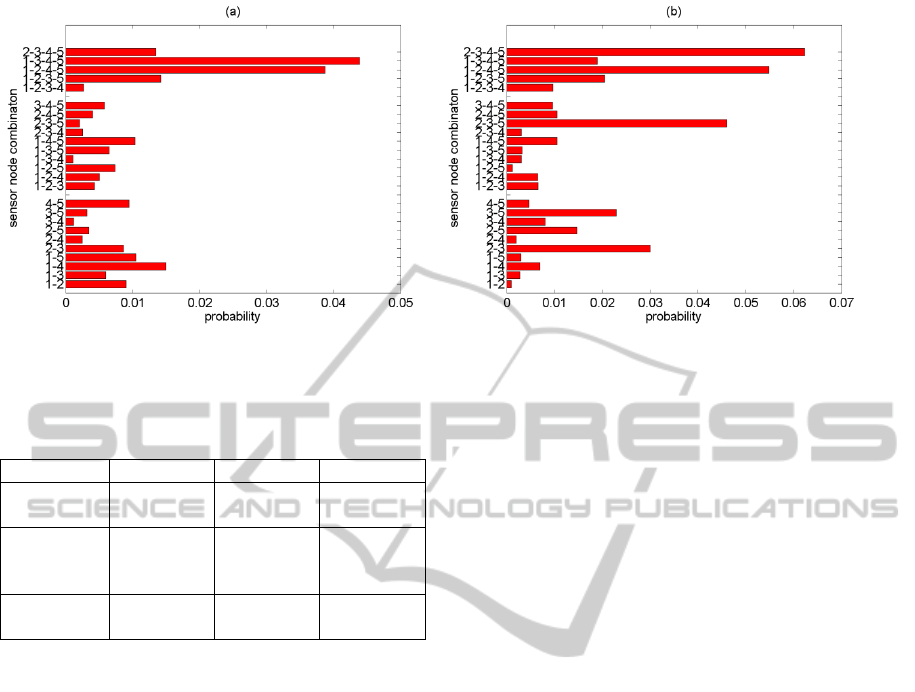
Figure 5: Probability of providing the messages loaded with maximum uncertainty and minimum mutual information on:
(a) temperature, (b) relative humidity, using different combinations of sensor net nodes.
Table 2: Best combinations of sensor net nodes for indoor
air humidity monitoring.
Criterion 2 nodes 3 nodes 4 nodes
Maximum
uncertainty
25 235 2345
Minimum
mutual
information
23 135 1235
Joint
criterion
23 235 2345
In this work we examined the sensor net for
monitoring indoor air temperature and humidity. The
obtained results revealed that different designs were
favoured when monitoring different parameters of
indoor air, with the same objective of detecting
episodes. The temperature and relative humidity are
usually considered as strongly correlated parameters.
Nevertheless the obtained results provided an
argument for designing their monitoring networks
separately. This approach could be potentially
extended to other parameters, which are indicative to
indoor air quality.
5 CONCLUSIONS
In this work there was introduced a method for
indoor air quality monitoring network design. The
method focuses on the selection of the best locations
for the nodes of sensor net which realizes this task.
The main idea of the method consists in defining the
objectives of the network in terms of the measures of
information and applying them to the data provided
by the network.
As the exemplary measures there were applied
the uncertainty and mutual information of the
message. It was shown that they may be applied to
define the indoor air quality monitoring network
which effectively detects the occurrence of untypical
conditions. The appropriate network layout may be
achieved by identifying the combinations of nodes
which are most likely to provide the data (messages)
loaded with maximum uncertainty and minimum
redundancy at the same time.
With the method we revised the existing IAQ
monitoring network composed of temperature and
humidity sensors. It was shown, that in general, the
sensor net which was most suitable for detecting
abnormal conditions of temperature could be
different from the sensor net for the most effective
monitoring of air humidity episodes.
Considering a multivariate composition of indoor
air quality, the obtained results indicate the
complexity of the problem of the design and
realisation of optimum indoor air quality monitoring
networks.
ACKNOWLEDGEMENTS
This contribution was supported by the project: "The
variability of physical and chemical parameters in
time as the source of comprehensive information
about indoor air quality". The project is financially
supported by the National Science Center, Poland,
under the contract No. UMO-2012/07/B/ST8/03031.
REFERENCES
Chen Y. L., Wen J., 2008. Sensor system design for
IndoorAirQualityMonitoringNetworkDesignbasedonUncertaintyandMutualInformation
343

building indoor air protection, Building and
Environment, 43, 12781285.
Choi I. J., Edwards J. R, 2008. Large eddy simulation and
zonal modeling of human-induced contaminant
transport, Indoor Air, 18, 233249.
Church K. W., Hanks P., 1990. Word association norms,
mutual information and lexicography, Computational
Linguistics, 16(1), 2229.
Elkamel A., Fatehifar E., Taheri M., Al-Rashidi M.S.,
Lohi A., 2008. A heuristic optimization approach for
Air Quality Monitoring Network design with the
simultaneous consideration of multiple pollutants,
Journal of Environmental Management, 88(3), 507–
516.
Fanger P. O., 1988, Introduction of the olf and decipol
units tu quantify air pollution perceived by humans
indoors and outdoors, Energy and Building, 12, 16.
Fanger P. O., 2006. What is IAQ? Indoor air, 16,
328334.
Fano R., 1961. Transmission of Information: A Statistical
Theory of Communications. MIT Press, Cambridge,
MA.
Fuentes M., Chaundhuri A., Holland D. M., 2007.
Bayesian entropy for spatial sampling design of
environmental data, Environmental and Ecological
Statistics, 14(3), 323340.
Gunay H. B., O’Brien W., Beausoleil-Morrison I., 2013, A
critical review of observation studies, modelling and
simulation of adaptive occupant behaviors in offices,
Building and Environment, 70, 3147.
Hartley R. V. L., 1927. Transmission of information,
International congress of Telegraphy and Telephony,
Lake Como, Italy.
Heinzerling D., Schiavon S., Webster T., Arens E., 2013,
Indoor environmental quality assessment models: A
literature review and a proposed weighting and
classification scheme, Building and Environment, 70,
210222.
Husain T., Khan U., 1983. Shannon’s entropy concept in
optimum air monitoring network design, The Science
of Total Environment, 30, 181190.
Li Q., Yoshino H., Mochida A., Lei B., Meng Q. Zhao L.,
Lun Y., 2009. CFD study of the thermal environment
in an air-conditioned train station building, Building
and Environment, 44, 14521465.
Ng L.C., Musser A., Persily A.K., Emmerich S.J., 2012.
Indoor air quality analyses of commercial reference
buildings, Building and Environment, 58, 179
187.
Marsik T, Johnson R., 2008. HVAC air-quality model and
its use to test a PM2.5control strategy, Building and
Environment, 43, 1850–1857.
Persily A.K., Emmerich S.J., 2012. Indoor air quality in
sustainable, energy efficient buildings, HVAC&R
Research, 18(1), 117.
Peng H., Long F., Ding Ch., 2005. Feature selection based
on mutual information: Criteria od Max-Dependency,
Max-relevance and Min-Redundancy, IEEE
Transactions on Pattern Analysis and Machine
Intelligence, 27(8), 12261238.
Postolache O., Pereira M., Girão P., 2005. Smart Sensor
Network for Air Quality Monitoring Applications,
IMTC 2005 – Instrumentation and Measurement
Technology Conference, Ottawa, Canada, 1719 May
2005.
Weschler C. J., 2011. Chemistry in indoor environments –
20 years of research, Indoor Air, 21, 205–218.
Wyon D. P., 2004. The effects of indoor air quality on
performance and productivity, Indoor Air, 14(7),
92101.
SENSORNETS2014-InternationalConferenceonSensorNetworks
344
