
Face Recognition based on Binary Images for Link Selection
Sanghun Lee
1
, Soochang Kim
2
, Young-hoon Kim
2
and Chulhee Lee
1
1
Electrical And Electronic Engineering, Yonsei University, 134 Shinchon-dong, Seodaemoon-gu, 120-749,
Seoul, Republic of Korea
2
Electronics and Telecommunications Research Institute, 161, Gajeong-dong, Yusong-gu, 305-700,
Daejeon, Republic of Korea
Keywords: Binary Image, Difference of Gaussian, Face Recognition, Image Registration, Link Selection, Scale
Pyramid.
Abstract: A face recognition system which utilizes binary facial images and a bitwise similarity calculation method is
proposed for link selection between mobile devices. As a pre-processing step, normalized differences of
Gaussian and facial region estimation were used to handle illumination conditions. Binary images were used
to extract facial feature sets that did not exceed 700 bytes. Scale pyramids and XNOR+AND similarity
scores were used for fast feature matching between reference data sets and pre-processed test data. The
proposed method achieved about an 85.9% recognition rate with a database that consisted of 135 facial
images with various head poses, obtained by enrolling one reference data set per subject.
1 INTRODUCTION
Recent advances in communication technology and
mobile devices have enabled the development of
wireless communications such as Wireless Fidelity
(O'sullivan et al., 1996), Near Field Communication
(Zimmerman, 1996), etc. Modern mobile devices
can access each other through compact, low-cost,
low-power, secure and cordless communication
systems. However, a problem with these devices is
that initializing connections between mobile devices
requires prior knowledge of the target device (e.g. a
unique ID of that device). Suppose that Alice wants
to connect Bob’s smartphone using Bluetooth. Alice
first needs to turn on the Bluetooth mode and find
the name of Bob’s device on her mobile display.
Although this is a reliable and secure way to connect
wirelessly, it is not intuitive. In the proposed link
selection system, Alice can connect by manually
selecting Bob’s face on her display. Since Bob’s
face is used as his ID, Alice doesn’t have to ask him
about anything or even remember an unfamiliar
nickname. The only thing she has to do is to select a
target on her display that shows a number of objects.
To use this link selection method, each mobile
device broadcasts a feature set of its owner’s face.
This feature set can be used for recognizing the
device by another device, which receives and
compares the feature set with a selected facial area.
Second, each feature set has a limited data size. In
most protocols, there is a limit on the size of the
broadcasting signals and we set the data size of this
feature set not to exceed 700 bytes (as a requirement
of communication channel capacity). Third, we
assumed the device was also receiving signals from
several neighboring devices at the same time, so it
had to search the target device by matching the
selected facial area and the received feature sets of
broadcasted signals. Finally, we assumed that the
computing power of each device was relatively low
compared to that of a desktop computer.
Consequently, the matching algorithm could not be a
complex one. Thus, the main purpose of our
research was to develop a face recognition system
requiring a small amount of channel capacity (under
700 bytes) by using binary images for the link
selection application.
2 OVERVIEW OF THE METHOD
The proposed system is shown in Fig. 1. The pre-
processing chain discussed in earlier research (Tan
and Triggs, 2007), which computes a normalized
difference of Gaussian (DoG), was used to produce
illumination-invariant facial images. We applied
589
Lee S., Kim S., Kim Y. and Lee C..
Face Recognition based on Binary Images for Link Selection.
DOI: 10.5220/0004738605890593
In Proceedings of the 9th International Conference on Computer Vision Theory and Applications (VISAPP-2014), pages 589-593
ISBN: 978-989-758-004-8
Copyright
c
2014 SCITEPRESS (Science and Technology Publications, Lda.)

Figure 1: The proposed method consists of pre-processing, similarity calculation and decision steps.
additional facial region estimation by using a skin
colour model (Chai and Ngan, 1999) in the YCbCr
colour space, as well as global intensity shift and
binary result images to obtain pose-invariant facial
images. Each device stored a binary image of the
owner’s face (i.e. a reference image) and
broadcasted this image as a feature set. This pre-
processing step was applied to both reference and
test images. The manually selected facial area was
used as a test image. Since the reference image size
was fixed due to the data size limitation, the sizes of
the reference images and test image differed.
Therefore, using the sliding window scheme
(Colmenarez and Huang, 1997), image registration
was performed at multiple scales to find the largest
correlation score. Then, we chose the device that
provided the highest score. The broadcasting signals
also contained communication ID information such
as IP addresses. This information was used to
initialize the link between the two devices.
3 FACE FEATURE EXTRATION
3.1 Illumination Normalization
Various illumination conditions and camera settings
can affect overall face recognition performance.
Since the proposed matching algorithm was used to
directly compare the features of a test image in a
pixel-wise manner with those of a reference image,
essential facial features had to be preserved while
compensating for the illumination effects. The pre-
processing method was applied to gray-scale facial
images for illumination normalization. It consisted
of gamma correction, difference of Gaussian filters
and contrast equalization (Fig. 2b).
(a) (b) (c) (d) (e) (f) (g) (h)
Figure 2: (a) Original images (b) illumination normalized
images (c) global intensity shifted images (d) binary
images (e) facial regions obtained from YCbCr colour
space based skin colour model (f) face region estimation
(g) AND operation of (d) and (f) (h) dilation operation
3.2 Global Intensity Shifting & Image
Binarization
After contrast equalization, the average intensities of
the processed images differed slightly, as shown in
Fig. 2c. The last person with glasses displayed low
intensity pixels. Backgrounds, glasses, or hair styles
affect contrast equalization since the procedure has
to be applied to the entire image. To allow for these
variations, we shifted the average intensity of each
image so that each image showed a specific value:
,
,
∑
,
,
∑
,
.
(1)
where
,
and
,
represent pixel intensity
values at a point
,
of image and shifted image
. We calculated the average intensity values of all
the illumination normalized facial images and
Similarity Calculation
Manually Face
Cro
pp
in
g
Construct scale
py
ramids
Feature
extraction
XNOR+AND operation
for ima
g
e re
g
istration
Test Image
Face recognition /
Connection initialization
Broadcasted
face feature sets
Face feature extraction
Grayscale
YCbCr color
space conversion
Illumination
normalization
Face region estimation
with face color model
Image
Binarization
AND
operation
Dilation
operation
Input RGB
image
face feature
set
VISAPP2014-InternationalConferenceonComputerVisionTheoryandApplications
590

obtained 135. Then, we used this result as a
reference so that the shifted image
showed the
same average intensity value. Finally, binary images
were produced as follows:
,
1, 0
,
0, otherwise
(2)
The threshold point was empirically set to 109
so that each binary image retained important facial
features such as eyes, eyebrows, a nose tip and a
mouth (Fig. 2d). However, outlines of faces, hairs
and glasses still appeared in the binary images.
3.3 Face Region Estimation
The YCbCr skin colour model (Chai and Ngan, 1999)
was used for face region estimation. A
transformation matrix was used to convert the RGB
space to an YCbCr colour space as follows:
,
,
,
16
128
128
65.758 129.057 25.064
37.945 74.494 112.439
112.439 94.154 18.285
,
,
,
(3)
Face
,
1,77
,127,133
,173
0,otherwise
(4)
Then, applying (4) to the YCbCr images produced
face candidate regions, as shown in Fig. 2e. A
morphological closing operation was used to fill the
holes in the candidate regions. Here we adopted a
5×5 square template for the closing operation (Fig.
2f). Then, by using the candidate regions, the
unnecessary parts (e.g., hair, face outline, etc.) were
partially removed (Fig. 2g). Lastly, a 3×3 dilation
operation was applied to reduce the effect of head
pose variations (Fig. 2h).
4 SIMILARITY CALCULATION
4.1 Choosing Reference Images
We assumed that each reference image was captured
and cropped to show all the necessary facial features
including eyes, eyebrows, a nose tip, and a mouth.
The size of the reference image had to be small
enough to be fit in a limited packet size, since we
assumed that mobile devices use a limited data
transfer channel for initializing connections between
devices. A 64×64 binary image was chosen for the
reference images since it only needed 512 bytes to
preserve the details of the facial features. In general,
several image compression algorithms such as
RunLength Encoding or Deflate can be used to
compress binary images.
Figure 3: (a) The width of a reference image
R
64 (b)
the width of a user selected test image u and the
corresponding minimum face area of a test image r (c-1)
u : r = 2 : 1 (c-2) u : r = 1.75 : 1 (c-3) u : r = 1.5 : 1 (c-4) u :
r = 1.25 : 1 (c-5) u : r = 1 : 1 (d) The width of user
cropped images were fixed with u = 128.
Figure 4: Scale Pyramids (Lowe, 1999) for each test image
were constructed into three steps.
4.2 Scale Pyramids
The scale of a test image differs depending on
camera settings: resolution, distance, lens, and
zooming. Thus, image registration had to be
performed for the test images at multiple scales.
Scale pyramids (Lowe, 1999) were used in our
image registration scheme. We let , and denote
the width of a reference image, the width of a user
cropped test image and the width of the minimum
face area of a test image, respectively (Figs. 3a-b). It
is obvious that should be larger than R. As
mentioned above, a user can crop a test image in
various ways (Fig. 3c). Thus, we assumed that the
ratio of and did not exceed 2.5.
To reduce the registration time, we constructed
3-step scale pyramids with different width intervals
(Fig. 4). After performing image registration at 15
different scales, we chose the highest correlation
score.
4.3 XNOR+AND Correlation
We let
and
denote the reference data set and the
(a)
(c-1) (c-2) (c-3) (c-4) (c-5)
(b)
(d-1) (d-2) (d-3) (d-4) (d-5)
64
80
96
160
92
88
84
108
104
100
102
106
112
FaceRecognitionbasedonBinaryImagesforLinkSelection
591
test data set, respectively. Then, the Pearson
product-moment correlation coefficient r between
and
was calculated by
∑
,
,
∑
,
∑
,
∑
,
∑
,
∑
,
∑
,
(5)
where and denote the pixel position and is the
number of pixels. We simplified this as the phi
coefficient (Guilford, 1941) if the bit depth of
and
were 1 (i.e. binary image). However, calculating
the Pearson product-moment correlation coefficient
required high cost operations. Thus, we proposed a
new correlation score method, XNOR+AND
correlation score u, as follows:
,
↓
,
,
∧
,
(6)
where ↓ and ∧ denote the XNOR and
AND operation, respectively. Since the range of
varied between 0 and 2, was normalized by
2
(7)
If the reference image is fixed, this normalization
can be skipped for faster computation. Both the
XNOR and AND operations presented correlations
between two binary images. The XNOR operation
showed information about the overlapping areas of
both the face feature regions (1s) and the non-face
feature regions (0s). On the other hand, the AND
operation considered only the face feature regions.
The non-face feature regions (0s) also provided
information on the overall face shape. However, the
AND operation considered only the facial regions.
On the other hand, the XNOR operation considered
both facial and non-facial regions. However, noise
areas in the facial regions and those in the non-facial
feature regions were treated equally. By using both
the AND operation and the XNOR operation, noise
areas in the non-face feature regions had fewer
influences on the correlation score estimation.
4.4 Head Pose Variation Compensation
Head pose estimation is one of the important issues
in face recognition. 3D model-based methods,
learning-based methods and active appearance
models are frequently used for pose-invariant face
recognition. However, these methods were not
suitable since reference sets continuously vary and
the necessary long processing times may not be
useful with mobile devices.
We assumed that a small amount of head
rotations in yaw and pitch angles can be ignored by
using binary images. Also, a dilation operation was
applied to minimize the small differences in the pose
variations. The proposed XNOR+AND score was
robust against these head pose variations.
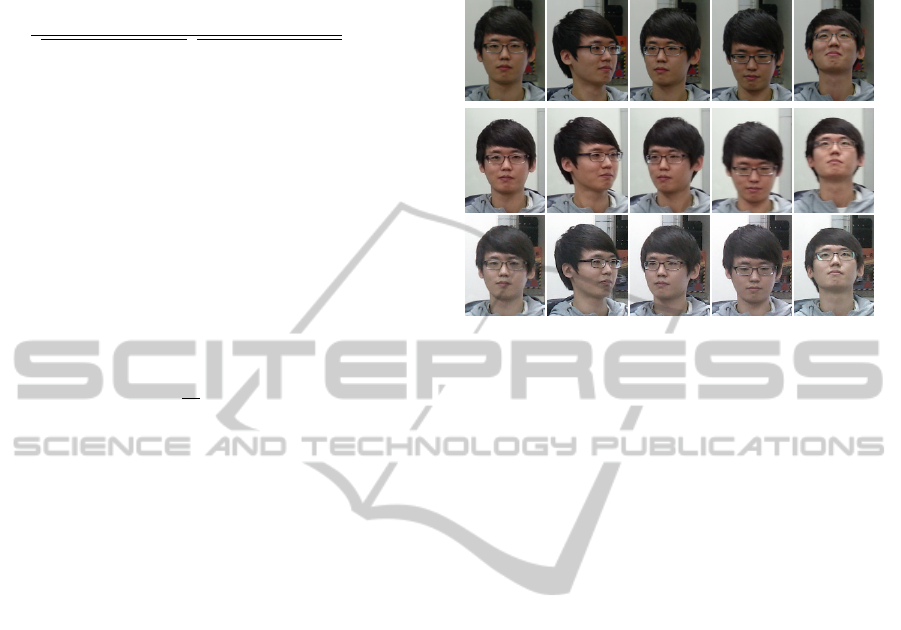
(a)
(b) (c) (d) (e)
Figure 5: Cropped facial images taken from original
images of Samsung Galaxy S3 (upper row), Sky Vega X
(middle row) and Samsung NX10 (lower row). (a) frontal
face (b) -15 ~ -45˚ yaw (c) +15 ~ +45˚ yaw (d) -15 ~ -45˚
pitch (e) +15 ~ +45˚ pitch angle tilted.
5 EXPERIMENTS
All the reference images were manually cropped to
6464 pixels. The test image sizes were generally
larger than those of the reference images.
Recognition rates of gray images (8-bit images) with
and without the pre-processing procedures are
shown below for comparison.
Our test database consisted of 135 indoor facial
images taken from two mobile phones and a DSLR
camera. There were nine subjects with five different
head poses, including frontal faces. As shown in Fig.
5, 15 facial images were taken for each person and
they sometimes contained blurred images.
Table 1 shows a performance comparison. Scale
pyramid image registration was applied to all the
methods. The proposed method with the
XNOR+AND similarity measure achieved the best
overall performance (85.93%). The proposed
method also showed the best performance among all
pose variations. With the grayscale images, which
were produced from the RGB images without the
pre-processing procedure, the overall accuracy was
61.48%. When the pre-processing procedure was
used (Tan and Triggs 2007), the overall accuracy
improved to 68.15%. When the Pearson correlation
was used, the overall recognition rate was 83.7%.
VISAPP2014-InternationalConferenceonComputerVisionTheoryandApplications
592

Table 1: Recognition performances achieved when enrolling one frontal face image.
Methods Bit Depth Criteria
Recognition Rates (%) Processing Time (sec/image)
f -y +y -p +p Overall
Grayscale 8 Pearson 100.00 33.33 40.74 70.37 62.96 61.48 2.156
(Tan and Triggs, 2007) 8 Pearson 88.89 62.96 66.67 62.96 59.26 68.15 2.421
Proposed method
1 Pearson 96.30 77.78 85.19 81.48 77.78 83.70 0.705
1 XNOR+AND 96.30 85.19 85.19 81.48 81.48 85.93 0.575
6 CONCLUSIONS
In this paper, we proposed a link selection method
for mobile device communications. Potential target
devices broadcasted their ID features extracted from
the owners’ faces. Then, a user connected a target
device by selecting the target device owner’s face
from his/her device display. We proposed an
efficient matching method that used pre-processing,
binarization and a simplified similarity measure. The
experimental results were promising.
ACKNOWLEDGEMENTS
This research was funded by the MSIP (Ministry of
Science, ICT & Future Planning), Korea in the ICT
R&D Program 2013.
REFERENCES
Chai, D., Ngan, K. N., 1999. Face segmentation using
skin-color map in videophone applications. Circuits
and Systems for Video Technology, IEEE Transactions
on, 9(4), 551-564.
Colmenarez, A. J., Huang, T. S., 1997. Face detection with
information-based maximum discrimination. In
Computer Vision and Pattern Recognition, 1997.
Proceedings., 1997 IEEE Computer Society
Conference on (pp. 782-787). IEEE.
Haartsen, J., 1998. Bluetooth-The universal radio interface
for ad hoc, wireless connectivity. Ericsson review,
3(1), 110-117.
Guilford, J. P., 1941. The phi coefficient and chi square as
indices of item validity. Psychometrika, 6(1), 11-19.
Lowe, D. G., 1999. Object recognition from local scale-
invariant features. In Computer Vision, 1999. The
proceedings of the seventh IEEE international
conference on (Vol. 2, pp. 1150-1157). IEEE.
O'sullivan, J. D., Daniels, G. R., Percival, T. M., Ostry, D.
I., Deane, J. F., 1996. U.S. Patent No. 5,487,069.
Washington, DC: U.S. Patent and Trademark Office.
Tan, X., Triggs, B., 2007. Enhanced local texture feature
sets for face recognition under difficult lighting
conditions. In Analysis and Modeling of Faces and
Gestures (pp. 168-182). Springer Berlin Heidelberg.
Zimmerman, T. G., 1996. Personal area networks: near-
field intrabody communication. IBM Systems Journal,
35(3.4), 609-617.
FaceRecognitionbasedonBinaryImagesforLinkSelection
593
