
Methodologies and Tools to Support Design and Development of
New Products
Ana Dias
1
, António Abreu
1
and João Matias
2
1
Mechanical Engineering Departamental Area, Superior Institute of Engineering of Lisbon, Lisbon, Portugal
2
Electromechanical Engineering Department, Beira Interior University, Covilhã, Portugal
Keywords: New Product Development, Graph, NPD Tools, Innovation, Suppliers, Quality, Project, Decision.
Abstract: Nowadays, companies, even the small ones, need to use more efficient working methods such as
"transnational." The market may still be local or regional, but the competition is global. To be competitive,
companies need to develop innovative products and introduce them to the market at an acceptable price, in
proper time and with a higher quality level. According to some authors, the survival strategy of the
companies is related to the development of methodologies that are able to design, develop and provide,
through efficient processes, innovative products and high quality. In this context, this paper aims to classify
and characterize the main methodologies and tools used in new products development. This aims are
supported by the graphs theory that is briefly addressed.
1 INTRODUCTION
The increasing globalization of markets, especially
in the last decade, caused profound changes in the
structure, organization and manner of operation of
businesses. The working methods and management
of the past are less and less adapted to the turmoil of
the modern world. In the current world scenario, at
the macroeconomic level is possible to identify a set
of variables that influence the competitiveness of
companies, for example, the energy crisis associated
with the continuous increase in oil prices and the
emergence of new trading powers, such as China
and India, have all created new threats to European
Industry (De Feo and Bar-El, 2002).
In order to be competitive companies must
develop capabilities that will enable them to respond
quickly to market needs. Nowadays it’s possible to
identify variables that influence the development of
production processes such as market pressures to:
improving quality, reducing production time and
costs, increased production flexibility and
concentration on core competences (Finster, 2001).
On the other hand, the product life cycle is
becoming shorter which strongly increases the rate
at which the process of design and/or development
of new products occur. The most frequently
introduction of new products in the market with
shorter intervals of time has been, in recent times,
the survival strategy of some companies to win new
customers and as a response to the diversity of
options available (Christopher, 1992) and
(Creveling, 2003).
Based on a survey and applying the graph theory
this article contributes to identify and characterize
the main methodologies and tools used in processes
of new products development (NPD), and their
interrelationships among them.
2 TOOLS USED IN NPD
Base on literature a number of tools/methodologies
focused on different perspectives to support NPD
processes have been proposed over time in various
disciplines.
From literature review carried out, it was found
that there is no consensus regarding the terminology
of methodology and tool, that means these concepts
are mistaken for each other (Sun and Zhao, 2010).
Therefore, in this article, are considered as
“methodological tools” those that are both
methodologies and tools, and as “instrumental tools”
those that are used as support of methodological.
In order to identify the most relevant tools used
in NPD and their inter-relations, a survey on web of
167
Dias A., Abreu A. and Matias J..
Methodologies and Tools to Support Design and Development of New Products.
DOI: 10.5220/0004764901670173
In Proceedings of the 3rd International Conference on Operations Research and Enterprise Systems (ICORES-2014), pages 167-173
ISBN: 978-989-758-017-8
Copyright
c
2014 SCITEPRESS (Science and Technology Publications, Lda.)

science (549 articles were selected, gathering the
period between 2002 and 2013) was conducted.
Taking into account the data collected, the tools
were divided in groups, regarding de theme that
matches with each tool under the NPD. Table 1
shows some examples of associated tools to NPD
processes.
Table 1: Classification of NPD supporting tools.
Discipline
Tools/Methodologies
Methodological Instrumental
Project
TRIZ (theory for
inventive problem
solving)
ARIZ; Matrix of
contradictions; S-
Field model
Creative design
Analogy-based
design
Axiomatic Design
Pugh analysis;
DOE; DFX
Logistics
Suppliers
Development
Involvment (SDI)
Quality
Quality Function
Development
(QFD)
Kano model; House
of quality (HOQ);
Balanced Scorecard
(BSC); Ishikawa or
Fishbone analysis;
Design for Failure
Modes and Effects
Analysis
(DFMEA); Pareto
or ABC analysis
Design for Six
Sigma (DFSS)
DFSS cycles
(DMADV, DCCDI,
DCOV, DDOV,
DMADIC,
DMADOV,
DMEDI, ICOV,
IDOV, ID
2
OV,
I
2
DOV e PIDOV)
Design Support
Robust design
Tolerance design
Modular design
Decision
Support
Analytical
Hierarchy Process
(AHP)
Case Based
Reasoning (CBR);
Data Envelopment
Analysis (DEA);
Delphi panel
3 SURVEY FINDINGS
3.1 Brief Decription of Methodological
Tools to Support NPD
Among the tools to support innovation and
creativity, TRIZ that means in English: "Theory for
Inventive Problem Solving", and is a specific
support for innovation development project, product
or process engineering or technology. More
surprisingly, the reference of the concept TRIZ-
fractal that means self-similarity in transformations
based on TRIZ tools to address knowledge
management TRIZ (Pin et al., 2011) uses the matrix
of contradictions and innovative principles in order
to solve problems (Berdanosov and Redkolis, 2011).
Another tool of this group is known as "Creative
Design". Creativity is necessary to generate
alternative solutions, requiring the involvement of
the designer or the creative team responsible for the
design. This process has not only creative inspiration
and imagination with these people, but also with
methods and tools that allow the manifestation of
creativity. There is research indicating that creativity
to find solutions to product design , comes often in
direct analogy with nature, and hence the concept of
"Bionic" which consists in analyzing the functioning
of natural systems or processes, reproducing after
their early solution (Detanico, 2010). From this
analogy often arise new outstanding contributions in
the process of NPD. These adaptations allow the
creation of forms, functions, or even similar
conduct. A creative design analogy is an important
reasoning process that allows the generation of new
artifacts, using ideas from the fields of technical
and/or scientific sometimes distant. Such is the case
with analogues derived from nature. Here therefore a
good creative genesis for the project: the analogy: it
is designated as “the design approach based on
analogy" (Gomes et al., 2006).
Yet another tool of this group is known as
"Axiomatic Design" that is a tool for creating
solutions synthesized with the aim of developing
products, processes or systems that satisfy perceived
needs through the mapping of customer desires in
"Functional Requirements" (FRs) turning them into
"Design Parameters" (DPs) (Yang and El-Haik,
2009). Functional requirements represent the goals
of the project that means the aims to be achieved (Li
et al., 2011). There are some vulnerabilities
concerning the axiomatic design: violation of their
two axioms, by coupling systems; or by the
complexity. That is why it is understood that the
DFSS can help overcome these problems.
Regardless of the vulnerabilities identified, the
axiomatic design is a methodological tool designed
to analyze in a systematic way, the transformation of
customer needs, FRs into DPs and relating them
(Yang and El-Haik, 2009).
One tool from logistics group corresponds to the
involvement of suppliers in NPD. Many authors
have demonstrated empirically that a NPD draft
ICORES2014-InternationalConferenceonOperationsResearchandEnterpriseSystems
168

participating vendors, induce many benefits
particularly in terms of reducing lead-times, reduced
project costs, including product and quality
improvement project and product (Wynstra, et al.,
2012). That is, the Suppliers Development
Involvement (SDI) has a decisive effect on the
performance of a NPD project. There were detected
three distinct factors that make up the apparent
involvement of suppliers (Jayaram, 2008):
information sharing and communication,
involvement in the project itself; quality compliance
and development of related infrastructure. That
means supplier involvement in NPD clearly
comprises a multidimensional perspective.
Quality Function Deployment (QFD), following
the philosophy of "Total Quality Management
(TQM)", and has been considered as a strategy that
the entire organization is focused on continuous
improvement (Li et al., 2012) and (Mendonça et al.,
2007). This entrepreneurial attitude has necessarily
to take into account at all times the will and needs of
customers (Ghinato, 1998). Approach in the context
of methodologies and tools based on the Quality
function, integrates undoubtedly the strategy or
methodology is portrayed primarily by its specific
tools or others associated with the project,
production or innovation (Ghinato, 1998). In support
of this assertion, were correlated in a robust manner,
greater speed in NPD with a more demanding of
quality processes and related tools (Sun and Zhao,
2010). As instrumental tools of QFD, the best
known are "House of Quality" (HOQ), Kano model,
BSC/KPIs (Balanced Scorecard/Keys Performance
Indicators), Failure Modes and effects
Analysis/Design Failure Modes and Effects Analysis
(FMEA/DFMEA), cause-effect or fishbone diagram
(also known as the Ishikawa diagram) and Pareto or
ABC analysis.
Design for Six Sigma (DFSS) is a
methodological tool project developed under the Six
Sigma (SS) philosophy in order to support
continuous improvement in the stage of mass
production and whose focus is the design and
development of profitable products, processes and
services, meeting the needs and expectations of
customers (voice of customer) and other
stakeholders (Jou, et al., 2010), including suppliers
as already noted. This aim involves the use of an
integrated set of tools, in order to provide and
improve the quality level obtained before the start of
production or harvesting. SS approach focuses on
the production phase and/or operation and DFSS has
its focus on the design and development phase.
Thus, it is possible to substantially reduce the costs
associated with the life cycle of the product, service
or process, since the DFSS is a preventive approach
(Yang and El-Haik, 2009), which aims to predict the
occurrence of failures and prevent unfold in stages
following. DFSS, whose methodology based (the
first one came and that subsequently led variants, is
the DMADV. SS philosophy was developed
precisely to achieve this goal. DFSS as well as their
tools instrumental also called cycles (Shahin, 2008):
"Define, Measure, Analyze, Improve, Control”
(DMAIC)/"Define, Measure, Analyze, Design,
Verify" (DMADV) among others, can considered as
an integrated whole in the universe’s most
comprehensive quality or DFSS methodology
(Shahin, 2008).
A tool from the support design decision group is
the “Robust Design”. Terminological factors are
referred to as "noise", such as temperature, humidity,
dust, deterioration, and so on. Which are the cause
of these deviations which result is loss of product
quality. Such damage can be evaluated using a
function "loss" which was initially proposed by Lee
and Tang (2000). Such a proposal is to determine the
loss function of the product, to optimize through
statistical techniques. Such analyzes allow us to
identify the optimal parameters of draft which
minimizes or eliminates the harmful influence of
such factors "noise", product performance or NPD.
Thus, instead of isolating the product to develop the
noise factor, which in addition to any hard
execution, can become expensive undoubtedly the
production process, the robust engineering presents
itself instead as a valid proposal to implement
projects that eliminate these same factors noises in
the product's intention. Taguchi method consists in
obtaining products sufficiently robust in order to
achieve high quality with respect to any fluctuations
that influence the environment of the NPD and even
those that may occur during the production process
(Kang et al., 2007).
Another tool from the previous noticed group is
the “Tolerance Design”. DFSS usually uses to drive
defects per million opportunities (DPMO) (Santos,
2009). This measurement is the average number of
defects per unit normalized, if one million, seen
during a production sample mean, divided by the
number of opportunities for the existence of a
product defect, a defect is considered as non-
compliance with requirements. These requirements
are defined in the specification or tolerance of
products or processes, still in the design phase of the
NPD, and can determine one or more forms of
production of each of the component parts, rather
than the use of other processes (Singh, et al., 2005).
MethodologiesandToolstoSupportDesignandDevelopmentofNewProducts
169

It is therefore a tool methodological tools that can
use instruments towards the optimization of
tolerances even before the actual geometric
dimensioning (Zhang et al., 2010). A robust
engineering is not compatible with large projects
with dimensioning of clearances that have tolerated
maintenance costs outside the criteria of a six sigma
production (Hagen and Park, 2013). This is therefore
a design type intended mainly for the production and
construction of machines, organs and parts where
the gaps are tolerated function of the dynamic
equilibrium and stability of the structure as a whole.
The last tool from the same group as the two last
noticed is the “Modular Design”, it corresponds to
the outsourcing, both parts of the project, as
production parts or components to a third logistics
part (3lp), whose integration is a crucial task both
with respect to the phases of the project, such as
when outsourcing regards the production process
(Salvador and Villena, 2013). The modular design
can be presented by the facet of knowledge sharing
in NPD, and conclude that this strategy has positive
impacts on their organizations and products
developed in (Huang et al., 2010). This methodology
of modular design of the product, from the
normalization of constituent parts, it introduces a
large degree of flexibility in the range of range of
the final product. Although it will primarily
economies of scale owing variety of end products
and that also enables power in certain circumstances,
economies of diversity (scope) (Dornier et al.,
1998). With regard to the reporting of this
"modularized design" is the practice of design,
production and assembly of complete products from
different modules from various sources, as occurs
for example in modular computers, automobiles, and
so on.
Finally, the most important tool from the
decision support group is the “Analytical Hierarchy
Process” (AHP). This is a methodology useful in
screening and ranking the various decisions that
must be made in companies engaged in the NPD,
primarily with respect to the various alternatives
under consideration. Due to the consideration of a
large number of quantitative and qualitative criteria
and lack of sufficient and concrete data, it is often
the situation in which the members of the project
group NPD have to make decisions in such
situations of uncertainty. As with other tools or
techniques, for example the DEA or, at the planning
stage when the product specifications, the weighting
(assigning weights) of factors and criteria is an
essential exercise, and should be done in a way as
reliable as possible (Chan et al., 2006). These
criteria need to be considered and evaluated at the
design and like the other methods, the solution may
pass through the involvement of a group of experts
multifunction (Fuzzy-Delphi). In obtaining the
hierarchy adopted for making such decisions, the
application of AHP tool, enables the distribution and
selection of the most important among the various
comparison and evaluation (Ayag and Ozdmir,
2009).
3.2 Graph of the Most used
Methodological Tools in NPD
The survey on web of science mentioned in point 2,
leaded to make the matrix shown in figure 3 that
relates the most important and used tools in NPD.
Hence it was found the following:
1. From a first group arise that: the robust design;
AHP and QFD are used very often in NPD (20.6
% of analyzed articles)
2. Of the six tools specified in respect of 22
analyzed (23.5 %) corresponded, on the whole,
more than half of the articles surveyed (51.5 %);
3. The observations were less in the downward
direction: the cause and effect diagram or (fish-
bone or Ishikawa) and DFMEA (about 1 % of
the total products);
4. The tools support the quality function of NPD
lead with 27 % of the articles;
5. The tools supporting innovation function
accounted for 23.8 % of the research articles,
soon followed by tools supporting project
(excluding the DFSS) with 16.6 % of the tools
and decision support with 15.8 %. The tools of
DFSS projects for six sigma productions were
scrutinized with 11.6 % of the total;
6. AS tools focusing on the involvement of
suppliers in collaborative processes stayed with
5.1%. Despite being by far the least scientifically
working group, differentiation which show the
other face is so substantial that do not hesitate
whether to maintain classification as special tool;
7. The tools support the quality function are those
that interact more with the other while being the
tool DFMEA (instrumental) used less and also
less interacts ;
8. Of total tools, articles related to methodological
tools was 65.5 % , while the corresponding
articles of the type tools instrumental presented
with the remaining 34.5 %;
9. The methodological tools used in most scientific
papers were DFSS, TRIZ and the robust project
ICORES2014-InternationalConferenceonOperationsResearchandEnterpriseSystems
170
with 45.7 % for the set of methodological tools
and 28.1 % of the total;
10. The tools used were more instrumental HOQ, the
DEA and the DOE with 70.2 % of the total of
such tools and 21.4 % of the total sample
However, if it is adopted the term model as a
simplified representation of the study object which
contains not all elements, but only those considered
relevant, graphs can be used to model
interrelationships. Thus, the "nodes" are used to
represent the tools while the "links" are used to
represent the relationships between tools
(Wasserman and Faust, 1994).
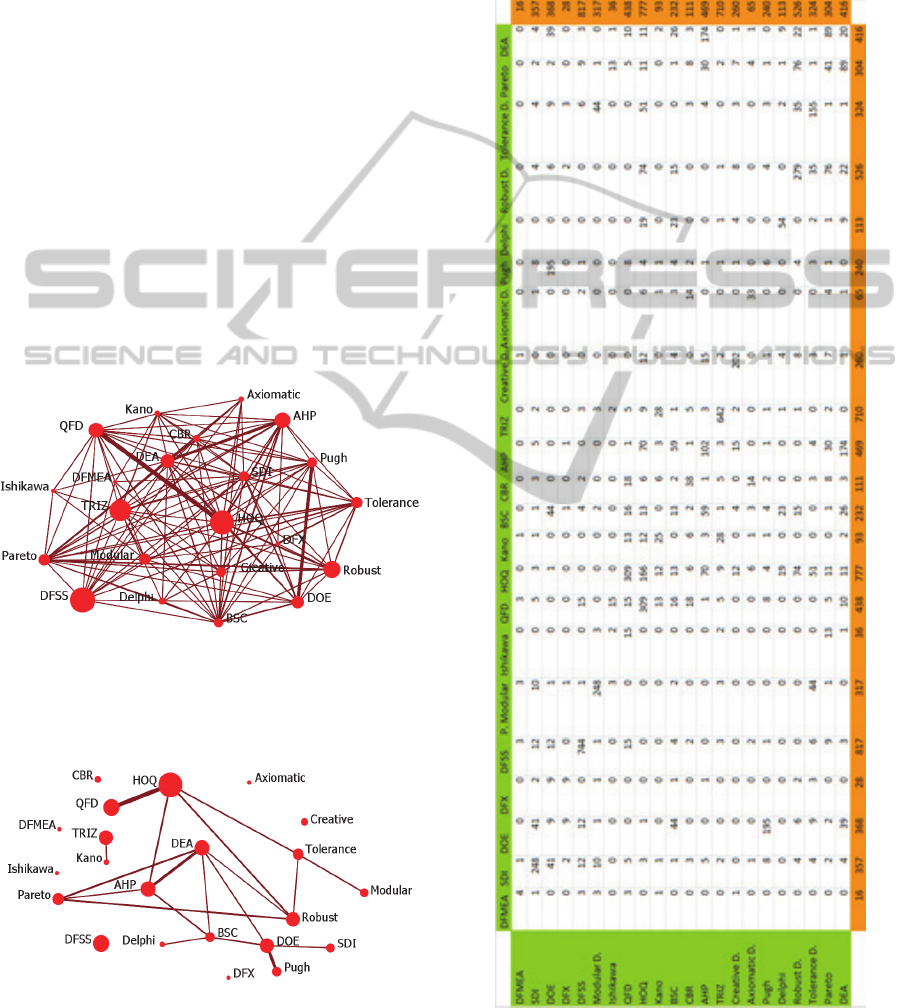
The cells of the matrix shown in figure 3 were
used with ORA software, generating the graph
shown in figure 1. This figure illustrates the network
of tools and their inter-relationships in NPD, where
the nodes’ size represents the number of times that a
tool has been given reference in the literature during
the period in analysis, and link’s width represents
the number of times that two tools are used
simultaneously in NPD.
Figure 1: Importance of tools and their interrelationship in
NPD.
In Figure 2, are represented the relations more
relevant.
Figure 2: Simplified graph with the most relevant
interrelationship in NPD.
One interesting advantage of using a graph
approach is the possibility to analyze in detail the
‘sub-structures’ that may be present in the network.
Divisions of tools into cliques, i.e. sub-structures of
a network in which tools are more closely and
intensely linked to one another than they are to other
tools of the network, can be important to detect
patterns of interrelationships between them.
Figure 3: Matrix obtained from a survey conducted on
web of science (594 articles were selected, gathering the
period between 2002 and 2013).
MethodologiesandToolstoSupportDesignandDevelopmentofNewProducts
171

On the other hand, at micro level the knowledge
how a tool is embedded in a sub-structure within a
network, may be important to understand its
applicability. For instance, some tools can act as
‘bridges’ between groups of tools.
Furthermore, applying metrics used in networks
(graphs) for instance the concept of local centrality it
is possible to identify that the most relevant tools
used in NPD, alone or in complementary with others
tools, are respectively, the HOQ DFSS and TRIZ
(29.3 % of total sample).
4 CONCLUSIONS
The literature review involves intrinsically NPD
with a panoply of tools both methodological and
structural root as a mostly instrumental. There were
analyzed 22 of these tools, the most important has
been possible with the survey of about seven
thousand articles referenced in the web of science,
interrelated and viewed graphically with the help of
graphs appropriate. This selection addressed to the
surface 10 to the Methodological tools, nevertheless
accounted for 65.5% of the total sample collected.
The tools in use are classified into two types:
methodological and vehicles. The first, by itself or
as a complement to other, structure a project NPD
(for example: TRIZ, DFSS or SDI). The latter alone
can not structure a project or set of NPD, but which
are recurrently used as support, support or other
instrument (for example: Pareto analysis, balanced
scorecard or BSC and Delphi panel).
REFERENCES
De Feo, J. and Bar-El, Z., 2002. Creating strategic change
more efficiently with a new design for Six Sigma
process, Journal of Change Management, Vol. 3, No.
1, pp.60–80.
Detanico, F. B., Teixeira, F. G. e Silva, T. K., 2010, A
Biomimética como Método Criativo para o Projeto de
Produto, Design & Tecnologia, 02, pp. 101-113.
Finster, M., 2001. From continuous improvement to
continuous innovation, Quality Management Journal,
Vol. 8, No.4.
Christopher, M., 1992. Logistics and Supply Chain
Management, Second Edition, Prentice Hall.
Creveling, C. M., Slutsky J. L., and Antis D. Jr., 2003.
Design for Six Sigma – In Technology and Product
Development, Prentice Hal PTR.
Wasserman, S. and Faust, K., 1994. Social Network
Analysis - Methods and Applications, Cambridge
University press.
Pin, C. S., Haron, F., Sarmady, S., Talib, A. Z. and
Khader, A. T., 2011 Applying TRIZ principles in
crowd management, Safety Science, 49, pp. 286–291.
Berdanosov, V. and Redkolis, E., 2011. TRIZ – Fractality
of mathematics, Procedia Engineering, 9, pp. 461 -
472.
Ulrich, K. T. and Eppinger, S. D., 2002. Product, Design
and Development, 2nd Edition, Irwin McGraw-Hill.
Gomes, P., Seco, N., Pereira, F. C., Paiva, P., Carreiro, P.,
Ferreira, J. L. and Bento, C., 2006. The importance of
retrieval in creative design analogies, Knowledge-
Based Systems, 19, pp. 480 - 488.
Yang, K. and El-Haik, S. B., 2009. Design for Six Sigma –
A Roadmap for Product Development, Second Edition,
McGraw-Hill.
Li, J. Y., Chen, X. B. and Zhang, W. J., 2011. Axiomatic-
Design-Theory-Based Approach to Modeling Linear
High Order System Dynamics, IEEE/ASME
Transactions on Mechatronics, 16, (2), (2011), pp.
341-350.
Wynstra, F., Anderson, J. C., Narus, J. A. e Wouters, M.,
2012. Supplier Development Responsibility and NPD
Project Outcomes: The Roles of Monetary
Quantification of Differences and Supporting-Detail
Gathering, Journal of Production Innovation
Management, 29, pp. 103–123.
Jayaram, J., 2008. Supplier involvement in new product
development projects: dimensionality and contingency
effects, International Journal of Production Research,
46 (13), pp. 3717–3735.
Li, Y-L., Tang, J-F., Chin, K-S., Han, Y. and Luo, X-G.,
2012. A rough set approach for estimating correlation
measures in quality function deployment, Information
Sciences
, 189, pp. 126–142.
Mendonça, M. C. L. V. and Dias, J. C. Q., 2007.
Postponement in The Logistical Systems of the New
Automobiles Marketed in Portugal: The Brands And
Quality, Total Quality Management & Business
Excellence, 18 (6), pp. 681-696.
Ghinato, P., 1998. Quality control methods: Towards
modern approaches through well established
principles, Total Quality Management, 9 (6), pp. 463 –
477.
Sun, H. and Zhao, Y., 2010. The empirical relationship
between quality management and the speed of new
product development, Total Quality Management, 21
(4), pp. 351–361.
Jou, Y. T., Chen, C. H., Hwang, C. H., Lin, W. T. and
Huang, S. J., 2010. A study on the improvements of
new product development procedure performance – an
application of design for Six Sigma in a semi-
conductor equipment manufacturer, International
Journal of Production Research, 48 (19), 1, pp. 2010,
5573–5591.
Shahin, A., 2008. Design for Six Sigma (DFSS): lessons
learned from world-class companies, International
Journal of Six Sigma and Competitive Advantage, 4
(1), pp. 48-59.
Lee, C. L. and Tang, G. R., 2000. Tolerance design for
products with correlated characteristics, Mechanism
ICORES2014-InternationalConferenceonOperationsResearchandEnterpriseSystems
172

and Machine Theory, 35, pp. 1675 – 1687.
Kang, N., Kim, J. and Park, Y., 2007. Integration of
marketing domain and R&D domain in NPD design
process, Industrial Management & Data Systems, 107
( 5-6), pp. 780-801.
Santos, D., 2009. Beyond Six Sigma - A Control Chart for
Tracking Defects per Billion Opportunities (dpbo),
International Journal of industrial Engineering-theory
Applications and Practice, 16, Special Issue: SI(3),
pp. 227-233.
Singh, P., K., Jain, S. C. and Jain, P. K., 2005. Advanced
optimal tolerance design of mechanical assemblies
with interrelated dimension chains and process
precision limits, Computers in Industry, 56, pp. 179–
194.
Zhang, J., e Li, S. P., Bao, N.S., Zhang, G. J. and Gu, P.
H., 2010. A robust design approach to determination
of tolerances of mechanical products, CIRP Annals -
Manufacturing Technology, 59, pp. 195–198.
Hagen, M. and Park, 2013. Ambiguity Acceptance as a
Function of Project Management: A New Critical
Success Factor, Project Management Journal, 44 (2),
pp. 52–66.
Salvador, F. and Villena, V. H., 2013. Supplier integration
and npd outcomes: conditional moderation effects of
modular design competence, Journal of Supply Chain
Management, 49 (1), pp. 87-113.
Huang, T-T., Le Chen, and Stewart, E. A., 2010. The
moderating effect of knowledge sharing on the
relationship between manufacturing activities and
business performance, Knowledge Management
Research & Practice, 8, pp. 285–306.
Dornier, P. P., Ernest, R., Fender, M. and Kouvelis, P.,
1998. Global Operations and Logistics -Text and
Cases, John Wiley & Sons, Inc.
Chan, F., Chan, H., Lau, H. and Ip, R., 2006 An AHP
approach in benchmarking logistics performance of
the postal industry, Benchmarking: An International
Journal, 13 (6), pp.636–661.
Ayag, Z. and Ozdemir, R. G., 2009. A hybrid approach to
concept selection through fuzzy analytic network
process, Computers & Industrial Engineering, 56, pp.
368–379.
MethodologiesandToolstoSupportDesignandDevelopmentofNewProducts
173
