
Do Specific Text Features Influence Click Probabilities
in Paid Search Advertising?
Tobias Blask
Institute of Electronic Business Processes, Leuphana University of Lueneburg, Luneburg, Germany
Keywords:
Bayesian Statistics, Bayesian Analysis of Variance, Search Engine Advertising, Sponsored Search, Paid
Search Advertising, Multivariate Testing.
Abstract:
Paid Search Advertisers have only very few options to influence the user’s decision to click on one of their ads.
The textual content of the creatives seems to be one important influencing factor beneath its position on the
Search Engine Results Page (SERP) and the perceived relevance of the given ad to the present search query.
In this study we perform a non reactive multivariate test that enables us to evaluate the influence of specific
textual signals in Paid Search creatives. A Bayesian Analysis of Variance (BANOVA) is applied to evaluate
the influence of various text features on click probabilities. We conclude by finally showing that differences
in the formulation of the textual content can have influence on the click probability of Paid Search ads.
1 INTRODUCTION
Internet search engines play a key role in the modern
information society. Not only do they serve the in-
formation needs of their users but they also represent
an important source of customer acquisition for a va-
riety of companies (Jansen and Mullen, 2008; Alby
and Funk, 2011). Internet search engine companies
also generate significant amounts of revenue through
Paid Search Advertising. While still growing rapidly,
Paid Search Advertising already dominates the online
media spending of companies that advertise on the
internet. Developed in 1998 by Overture, this form
of advertising uses text advertisements and a list of
keywords. The advertiser also usually provides at-
tributes to each of these keywords, but always indi-
cates the amount of money he is willing to pay for a
click on an ad for a specific keyword (CPC
max
)(Jansen
et al., 2009). Every time a user types a query into
a search engine, personalized result pages are gener-
ated based on the user’s location, search history and
other factors. If ads are available that could prob-
ably satisfy the need of the user, the search engine
displays these ads alongside the organic results. If
more than one advertiser is willing to pay for the dis-
play of an ad, the search engine typically auctions
the position of these ads among all interested parties
through a Generalized Second Price Auction (GSP)
(Jansen, 2011; Varian, 2009). Only the advertiser
that wins the auction by getting a click on its ad is
charged by the search engine. The effective Cost-
Per-Click (CPC
e f f
) is the maximum bid of the ad-
vertiser with the subsequent highest bid plus a small
additional fee. In practice, search engine companies
use a more robust mechanism to maximize their prof-
its by rewarding keyword/ad combinations that have
a high relevance to users (often referred to as the
quality score). Although detailed calculations are not
disclosed, the key metric is claimed to be the his-
toric Click-Through Rate (CT R) where available, oth-
erwise an expected click probability for the specific
advertiser-ad-keyword combination is used. An in-
teresting issue for advertisers is how to maximize the
probability that a given user will click on one of their
advertisements, ultimately fulfilling a defined goal on
their website. In practice there are only limited op-
tions to do so. One is to optimize the relevance of
an advertisement by only choosing keyword / landing
page combinations that provide a suitable offer to the
respective query of a given user. Additionally, adver-
tisers can maximize click probability by influencing
the position of an ad on the SERP via the CPC
max
and by improving the ad quality. Finally, optimizing
the wording of creatives to communicate advantages
over the competition may help users with their deci-
sion on which ad to click. In the present paper we
concentrate on the impact of various signals in text ad-
vertisements. We analyze a non-reactive multivariate
test in which users are confronted with some defined
variations of ads containing information on trust and
55
Blask T..
Do Specific Text Features Inï
ˇ
n
´
Cuence Click Probabilities in Paid Search Advertising?.
DOI: 10.5220/0005048400550062
In Proceedings of the 11th International Conference on e-Business (ICE-B-2014), pages 55-62
ISBN: 978-989-758-043-7
Copyright
c
2014 SCITEPRESS (Science and Technology Publications, Lda.)

pricing that has been differently formulated or com-
pletely omitted. We evaluate the probability that a
user will click on a given Paid Search text ad by us-
ing a Bayesian Analysis of Variance (BANOVA). Fi-
nally, we illustrate that variations in the text of a cre-
ative have significant influence on click probabilities
in Paid Search.
2 PAID SEARCH ADVERTISING
An interesting topic for the current research is eval-
uating the factors that influence the probability that
a given user will click on a specific advertiser’s ad.
These factors have been widely studied since Paid
Search Advertising first began; however, due to a lack
of opportunity to observe search engine user behav-
ior, complete coverage of all factors influencing the
click probability is no easy task. Evidence suggests
that one of the most influential factors is the ad po-
sition within the Paid Search results, which depends
on the CPC
max
and quality score. The quality score
is used by search engines to determine the quality of
an advertisement and is based primarily on the histor-
ical CT R of a given keyword/ad combination. There
is a strong correlation between decreasing ad position
and a decreasing CT R (Richardson et al., 2007; Agar-
wal et al., 2011). In principle, the top positions lead
to high CT Rs. From an advertiser’s perspective, it
is appealing to be able to predict the future CT R of
a given ad or even better to find rules for predicting
click probability in advance. As research has pro-
gressed, several models have been developed to ex-
plain the influence of the position bias on the CT R.
Crasswell, Zoeter and Taylor (Craswell et al.,
2008) present several models for predicting the CT R:
(a) baseline model, (b) mixture model, (c) examina-
tion model, and (d) cascade model . The findings were
originally based on organic search results, but they
are applicable to Paid Search results as well (Agarwal
et al., 2011). The underlying assumption of the (a)
baseline model is that a user screens every search re-
sult and then decides, which one best fits the query.
As a result, the click probabilities for each individ-
ual search result are identical and independent of its
position. The (b) mixture model extends the baseline
model and divides user behavior into two groups. One
group behaves as described in the baseline model,
while the other group clicks randomly on one of the
first search results. The (c) examination model refers
to findings from eye tracking studies, which state
that, with declining position, the probability of a click
also declines (Joachims et al., 2005; Joachims et al.,
2007). The (d) cascade model is, owing to the high
degree of explanation by click data, one of the most
applied explanation approaches. The basic assump-
tion is that the user scans each search result from top
to bottom, comparing the relevance of each ad with
the relevance of the ad before it. The user continues
scanning the results until the perceived ad relevance
reaches a certain level and the user clicks.
One challenge is to predict the CT R of keywords
or keyword combinations for potential future Paid
Search ads. A proposed solution is aggregating histor-
ical data from similar keywords (Regelson and Fain,
). Here, the CT R is represented as a function of po-
sition, independent of a bid. The resulting developed
models do not focus on a certain advertiser. The same
clustering approach can be applied in optimizing the
search engines’ profit (Dave and Varma, 2010). There
are also models that take into account the quality
score (Gluhovsky, 2010). The General Click Model
model developed by Zhu et al. (Zhu et al., 2010),
focuses on the CT R prediction of long-tail queries,
based on a Bayesian network.To address the the afore-
mentioned position bias, Zhong et al. (Zhong et al.,
2010) incorporate post-click user behavior data from
the clicked ad’s landing page into the click model to
refine the estimation of the perceived user relevance
after clicking on a specific ad. A similar approach
using Dynamic Bayesian networks can be found in
Chappelle and Zhang (Chapelle and Zhang, 2009).
Several models based on historical click data are lim-
ited in that they lack consideration of a possible user
learning effect. Taking Gauzente’s results as an ex-
ample, it has been shown that past user satisfaction
with Paid Search results influences current click be-
havior (Gauzente, 2009). In addition to the incorpo-
ration of position data and the perceived relevance of
presented ads, the CT R of an advertisement is also af-
fected by the relationship between organic and Paid
Search results. Listing the results in Paid and organic
search results for one company at the same time leads
to a higher CT R(Yang and Ghose, 2010; Blask et al.,
2011). What has often been overlooked is the influ-
ence that specific text patterns have on click probabil-
ities.
3 CASE STUDY
It is part of a Paid Search Advertising manager’s daily
routine to test different versions of a specific ad. In
practice, at least two variations of an ad are tested
against each other in each ad group. One commonly
method is to replace the weaker performing version of
an ad with the stronger variation after enough clicks
are generated to identify which one is performing bet-
ICE-B2014-InternationalConferenceone-Business
56

ter. Anecdotal evidence and personal experience often
play an important role in this process, and the knowl-
edge gained from tests is often not preserved within
an organization. In this paper we present a method
for multivariate tests based on historical data that is
able to enhance the options of working with unbal-
anced study designs in A/B and multivariate tests.
This ultimately improves advertisers’ ability to rec-
ognize low performing ads sooner than with conven-
tional ANOVA methods. What makes these models
interesting is the ability to take prior knowledge into
account where only sparse data are available.
Figure 1: Variations of Paid Search ads similar the textual
ads used for this study.
For this study, selected elements have been al-
tered in a number of Paid Search text advertisements
for very similar commercial Google search queries.
These queries may lead to a business offer from the
advertiser and an online product purchase, as can be
seen in fig. 1. The advertisers’ product is a major in-
vestment for the average private customer. The data
were generated directly by Google Adwords as part of
the normal conducted from 2012 to 2013. The result-
ing data set contains a large number of Paid Search
key performance indicators (KPI) for the given pe-
riod. All advertisements that had less than 100 im-
pressions in the given period were filtered out. To en-
sure that only the impact of the specific text alteration
is analyzed and to exclude other factors that would
blur the results (especially the aforementioned strong
position effects), we only analyze the advertisements
that were displayed above the organic search results
and that were part of the described multivariate test.
For this study, we take almost 3 million ad impres-
sions resulting in more than 300,000 clicks and a to-
tal of 1.976 ads into account. The occurrences of the
examined text features in the ads are shown in table 1.
The aggregated CT R for each ad over the whole test
period is used for the analysis. The resulting mean
CT Rs are displayed in fig 3. The nominal variables
Title, Body 1, Body 2, Display-URL of the landing
page for each ad are also included.
In this study we want to predict the metric vari-
able CT R by using the described nominal textual pre-
dictors. As such, ANOVA is a valid method of choice
for us. For the given data the model can be formulated
as written in equation (1) with the predictor variables
presence of trust seal information and presence of
pricing information denoted as⃗x
1
and⃗x
2
. β serves as
a deflection parameter. β
0
indicates the baseline value
of the prediction. For example, if x
2
is at the value of
x
2k
, a deflection of β
2k
is added to the baseline. Ulti-
mately the sum of all deflections of β
1
and β
2
have to
have a sum of zero for both predictors.
y = β
0
+
⃗
β
1
⃗x
1
+
⃗
β
2
⃗x
2
+
⃗
β
1×2
⃗x
1×2
= β
0
+
J
1
∑
j=1
β
1
,
j
x
1
+
J
2
∑
j=1
β
2
,
j
x
2
+
J
1
∑
j=1
J
2
∑
k=1
β
1×2, j,k
x
1×2, j,k
with the constraints
J
1
∑
j=1
β
1 j
= 0 and
J
2
∑
k=1
β
2k
= 0 and
J
1
∑
j=1
β
1×2, j,k
= 0∀k and
J
2
∑
k=1
β
1×2, j,k
= 0∀k
(1)
Even a brief look at the numbers in table 1 makes
it clear that the research design is not very well bal-
anced. Only four ads contain trust seal and concrete
pricing information from the advertiser’s database,
while 345 contain no trust seal information but do
include concrete pricing information. This could
lead to serious computational difficulties in tradi-
tional ANOVA, which is the reason that we follow
Kruschke’s approach (Kruschke, 2010). We use a
Bayesian estimation to perform the data analysis us-
ing a hierarchical prior as illustrated in fig. 2 . The
goal of this analysis is to estimate the additive and in-
teractive β values for each level of⃗x.
The following assumptions are made regarding
the hierarchical prior: The observed data y
i
is as-
sumed to be normally distributed around the predicted
value or central tendency µ
i
. As defined and illus-
trated by Kruschke (Kruschke, 2010), the equation
above the observed data distribution in fig 2 illustrates
that the predicted value is composed from the base-
line (β
0
) plus additive deflection (β
0
+
⃗
β
1
⃗x
1
+
⃗
β
2
⃗x
2
)
caused by each predictor individually, and interactive
deflection (
⃗
β
1×2
⃗x
1×2
) caused by the combination of
the given predictors. The basic assumptions about the
respective β
i
can be found in the distributions in the
top level of fig. 2. Here, we indicate that all β
i
are nor-
mally distributed around zero. The variances of all β
i
are estimated from the given data. The hyperdistribu-
tions are applied separately to the various predictors
and interactions. This is due to the assumption that
the magnitude of the effect of the predictive variable
⃗x
1
is probably not informative on the magnitude of the
effect of ⃗x
2
(Kruschke, 2010).
As previously mentioned, we want to predict CT R
using variations of the nominal predictors ”trust seal
information” and ”pricing information”, denoted
DoSpecificTextFeaturesInfluenceClickProbabilitiesinPaidSearchAdvertising?
57
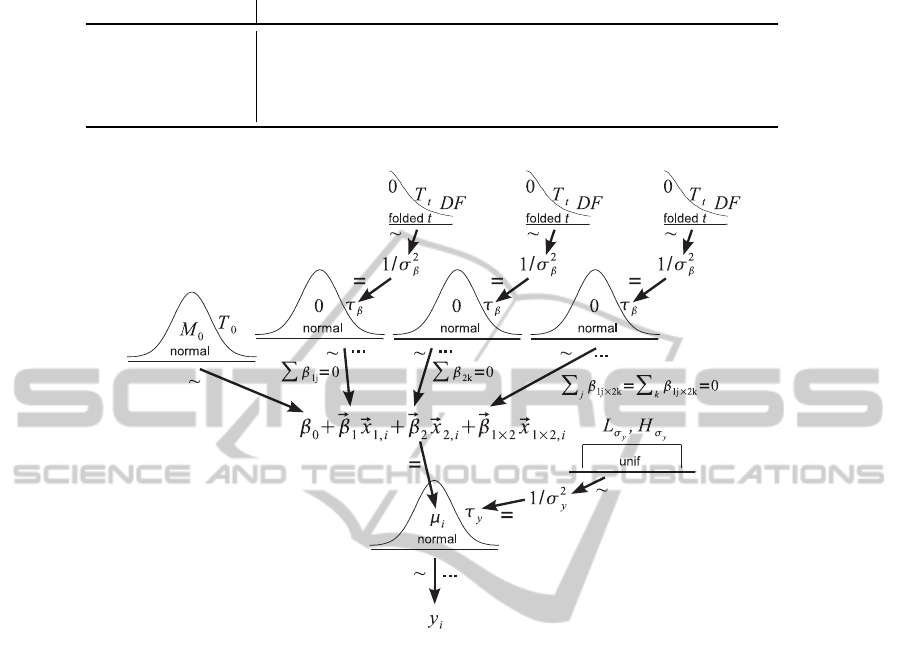
Table 1: Occurences of text features in the dataset (trust information(x1) and pricing information(x2)).
no trust info(X1A1) test winner( X 1A2 trust seal(X1A3)
no pricing( X 2B1) 789 99 330
no deposit( X 2B2) 20 35 91
save x %(X2B3) 91 84 101
real price(X2B4) 39 306 4
Figure 2: Hierarchical dependencies for two-way BANOVA (Kruschke, 2010).
as ⃗x
1
and ⃗x
2
. Both variables have several levels.
⃗x
1
includes ”no trust information given” (x
1A1
),
”unspecified test winner information given” (x
1A2
)
and ”concrete trust seal and test winner informa-
tion given”(x
1A3
). ⃗x
2
includes ”no pricing informa-
tion”(x
2B1
), ”no deposit”(x
2B2
), ”percentage of sav-
ings given”(x
2B3
) and ”concrete pricing informa-
tion from database given”(x
2B4
). Although that we
have an unbalanced study design and very few obser-
vations for one of the cases, we can see from fig 3 that
ads with different contents gain significantly varying
CT Rs.
The results of the Bayesian analysis concerning
the effects of the text features are shown in fig 4. The
top left histogram shows that the baseline (β
0
) for the
given combinations of text features is at 0.114. This
is quite high in terms of average Click-Through Rates
in Paid Search Advertising in general, at least for such
a great number of queries as we observed within the
test period in the context of the given campaigns. This
could be a good hint for the fact that the campaigns
have already been very well organized and optimized
in terms of relevance to the specific queries that lead
to the display of ads of the given advertiser on Search
Engine Results Pages. Which influences selected text
features have in such an environment can be seen in
the remaining histograms in fig. 4. Each histogram
illustrates deflections from the baseline for any given
feature combination. The third histogram in the first
row for example indicates that 95% of the most cred-
ible values that have to be subtracted from the base-
line to describe the effect of the text feature ”unspec-
ified test winner information” fall in the area between
0.0282 and 0.0164 (β1
2
) with the most probable value
at 0.0213. What is really interesting and makes this
kind of analysis so helpful in the case of unbalanced
study design is the additional information concerning
the 95% HDI (Highest Density Interval) for each es-
timation. This interval illustrates the area in which
95% of all credible parameter values for the respective
level of a variable are situated. This becomes espe-
cially important when it comes to levels of a variable
with only very few observed data points where the in-
group variance is estimated with the help of the prior
ICE-B2014-InternationalConferenceone-Business
58

1
1
1
0.04 0.06 0.08 0.10 0.12 0.14 0.16
TrustLevels
Click-Through Rate
2
2
2
3
3
3
4
4
4
A1 A2 A3
PricingLevels
4
3
2
1
B4
B3
B2
B1
Figure 3: Mean CT R values for ads with different text feature combinations.
knowledge from other levels within the same predic-
tive variable.
We estimate the effects for each of the groups
but we are also interested in the answer to the ques-
tion whether the groups are credibly different from
each other. In typical A/B test scenarios for exam-
ple this can be examined by applying an NHST t-test
or a Bayesian Parameter Estimation of t-distributions
for the comparison of two groups (Kruschke, 2012;
Blask, 2013). For the case of more than two predictive
variables this can also be done via contrast analysis in
Multifactor Analysis of Variance (MANOVA).
What we additionally want to investigate in this
study is the overall effect of having information about
a trust seal in the Paid Search Ads of the advertiser
and the effects of various levels of pricing informa-
tion. One answer to this question comes from the
analysis whether there is a credible difference in click
probabilities between ads that do not contain any spe-
cific trust information (x
1A1
) and and those that in-
clude the text feature (x
1A2
and x
1A3
). The histograms
in fig 5 that the effect of having unspecified test win-
ner information in the ad does not help the advertiser
to gain a higher CTR. In fact the analysis does reveal
that having no trust information is credibly better than
the announcement of an unproven test winner state-
ment. Including a trust seal information into the ad
does not have such a negative effect. In fact about
two thirds of the credible values for the effect, includ-
ing the most probable value, indicate that this feature
may slightly help the advertiser. What is also true is
that the zero value is included in the 95% HDI what
makes it very probable that there is no credible im-
provement in the advertisers performance by includ-
ing this feature. What we can derive from the analysis
is the fact that it makes credibly more sense to include
the proven trust seal into the ad compared to unproven
test winner statement as can be seen in the right his-
togram in fig 5. So, in terms of trust seal information
it becomes quite clear what the better choice might be
for the given company. It makes no mistake by taking
concrete and proven information on trust seals into
their ads. What they should not expect is a significant
boost in terms of click probability.
What is not so clear until now is the question
which level of pricing information finally leads to the
best click probability. What we can see is that there
seem to exist two differently performing clusters. On
the one hand there are the ads that contain a concrete
pricing information from the database of the given ad-
vertiser (x
2B4
) and ads that contain a specific discount
in percent as text feature (x
2B3
) and on the other hand
there are the ads with no pricing information at all
(x
2B1
) and those advertising that no deposit has to be
made (x
2B2
). These two groups are credibly different
from each other as can be seen in the histograms in fig
DoSpecificTextFeaturesInfluenceClickProbabilitiesinPaidSearchAdvertising?
59

Baseline
E0
0.105 0.115 0.125
mean 0.114
95% HDI
0.108 0.12
x1: A1
E1
1
-0.010 0.000 0.010 0.020
mean 0.00864
95% HDI
0.000902 0.0164
x1: A2
E1
2
-0.035 -0.025 -0.015 -0.005
mean -0.0213
95% HDI
-0.0282 -0.0148
x1: A3
E1
3
-0.01 0.00 0.01 0.02 0.03
mean 0.0126
95% HDI
0.00291 0.0224
x2: B1
E2
1
0
.030 -0.020 -0.010 0.000
mean -0.014
95% HDI
-0.0209 -0.00685
x2: B2
E2
2
-0.04 -0.03 -0.02 -0.01 0.00
mean -0.0167
95% HDI
-0.0258 -0.00785
x2: B3
E2
3
-0.010 0.000 0.010
mean 0.00177
95% HDI
-0.00612 0.00938
x2: B4
E2
4
0.00 0.02 0.04 0.06
mean 0.0289
95% HDI
0.0134 0.044
x1: A1 , x2: B1
E12
1,1
-0.03 -0.02 -0.01 0.00
mean -0.0128
95% HDI
-0.0214 -0.00401
x1: A2 , x2: B1
E12
2,1
0.01 0.02 0.03 0.04
mean 0.0233
95% HDI
0.0142 0.0326
x1: A3 , x2: B1
E12
3,1
-0.03 -0.02 -0.01 0.00 0.01
mean -0.0106
95% HDI
-0.0212 0.000176
x1: A1 , x2: B2
E12
1,2
-0.01 0.01 0.03 0.05
mean 0.0289
95% HDI
0.0152 0.043
x1: A2 , x2: B2
E12
2,2
-0.06 -0.05 -0.04 -0.03 -0.02
mean -0.0403
95% HDI
-0.05 -0.0302
x1: A3 , x2: B2
E12
3,2
-0.02 0.00 0.01 0.02 0.03 0.04
mean 0.0114
95% HDI
-0.00166 0.0242
x1: A1 , x2: B3
E12
1,3
-0.04 -0.03 -0.02 -0.01 0.00
mean -0.0221
95% HDI
-0.0324 -0.0119
x1: A2 , x2: B3
E12
2,3
-0.01 0.00 0.01 0.02 0.03
mean 0.00995
95% HDI
0.000302 0.0194
x1: A3 , x2: B3
E12
3,3
-0.01 0.01 0.02 0.03 0.04
mean 0.0121
95% HDI
0.000242 0.0247
x1: A1 , x2: B4
E12
1,4
-0.02 0.00 0.02 0.04
mean 0.00589
95% HDI
-0.0118 0.0242
x1: A2 , x2: B4
E12
2,4
-0.03 -0.01 0.01 0.03
mean 0.00704
95% HDI
-0.00882 0.0224
x1: A3 , x2: B4
E12
3,4
-0.08 -0.04 0.00 0.04
mean -0.0129
95% HDI
-0.0393 0.0135
Figure 4: Beta value posterior distributions for each variation given the data (x1 = trust seal informaton (x1:A1 = no
trust info, x1:A2 = unspecified test winner information, x1:A3 = concrete trust seal and test winner information), x2 = pricing
information (x2:B1 = no pricing, x2:B2 = no deposit, x2:B3 = save x%, x2:B4 = concrete pricing information from database)).
X1 Contrast: A1vA2
1 A1 + -1 A2
0.00 0.01 0.02 0.03 0.04 0.05
mean 0.0298
0% < 0 < 100%
95% HDI
0.0194 0.0407
X1 Contrast: A1vA3
1 A1 + -1 A3
-0.04 -0.02 0.00 0.02 0.04
mean -0.00404
69.4% < 0 < 30.6%
95% HDI
-0.02 0.0127
X1 Contrast: A2vA3
1 A2 + -1 A3
-0.06 -0.04 -0.02 0.00
mean -0.0338
100% < 0 < 0%
95% HDI
-0.0488 -0.0194
Figure 5: Contrasts for various levels of trust seal information (X1).
X2 Contrast: B1vB2
1 B1 + -1 B2
-0.02 -0.01 0.00 0.01 0.02
mean 0.00282
30.7% < 0 < 69.3%
95% HDI
-0.00807 0.0139
X2 Contrast: B1vB3
1 B1 + -1 B3
-0.03 -0.02 -0.01 0.00
mean -0.0157
100% < 0 < 0%
95% HDI
-0.0243 -0.00695
X2 Contrast: B1vB4
1 B1 + -1 B4
-0.08 -0.06 -0.04 -0.02 0.00
mean -0.0427
100% < 0 < 0%
95% HDI
-0.0634 -0.0227
X2 Contrast: B2vB3
1 B2 + -1 B3
-0.04 -0.03 -0.02 -0.01 0.00 0.01
mean -0.0185
99.9% < 0 < 0.1%
95% HDI
-0.0307 -0.00668
X2 Contrast: B2vB4
1 B2 + -1 B4
-0.10 -0.08 -0.06 -0.04 -0.02 0.00
mean -0.0455
100% < 0 < 0%
95% HDI
-0.0674 -0.0238
X2 Contrast: B3vB4
1 B3 + -1 B4
-0.06 -0.04 -0.02 0.00 0.02
mean -0.027
99.4% < 0 < 0.6%
95% HDI
-0.0479 -0.00629
Figure 6: contrasts for various levels of pricing information (X2)
ICE-B2014-InternationalConferenceone-Business
60

6. In detail, everything, including no pricing informa-
tion at all (x
2B1
), seems to be be better than advertising
”no deposit” (x
2B2
). The next best text feature in terms
of pricing is to give an exact value for the percentage
that a user can save on the advertiser’s website (x
2B3
).
This feature is performing credibly better than those
mentioned above. What is the best way to communi-
cate pricing in Paid Search Ads - given the data - is
to provide exact pricing information from the adver-
tiser’s database (x
2B4
). In fact it is credibly superior to
any other feature in terms of pricing communication,
given the observed data.
4 CONCLUSIONS AND
OUTLOOK
What we applied in this paper offers a valid way to
evaluate text features and other nominal predictive
variables where tests are an essential part of the daily
business. In terms of substantive issues it is the hard
facts that the potential customers are looking for when
they research in a search engine. The more spe-
cific information on pricing is provided in an ad
- the better is the chance of winning the customers
click. Building up trust is one good feature for an ad-
vertiser to support this effect or even substitute parts
of this positive effect if they do not have competi-
tive prices or special rebates available. In this spe-
cific case this has been achieved by communicating
the existence of a credible trust seal in the ad-copy.
What we did not asses in this research but would find
interesting for an ongoing investigation is the ques-
tion whether these findings have additional impact on
the conversion probability on the advertiser’s landing-
page as well. Applying Bayesian ANOVA to mul-
tivariate tests in Online Advertising, especially Paid
Search Advertising, has various advantages compared
to applying conventional Analysis of Variance. This
is especially true for unbalanced data like the present
one. One obvious limitation to the results is that they
should probably only be true for advertisers with com-
petitive prices. Additionally this test should be re-
peated for a number of other advertisers from various
industries to answer the question whether these obser-
vations can be generalized.
REFERENCES
Agarwal, A., Hosanagar, K., and Smith, M. D. (2011). Lo-
cation, Location, Location: An Analysis of Profitabil-
ity of Position in Online Advertising Markets. Journal
of Marketing Research, 48(6):1057.1073.
Alby, T. and Funk, B. (2011). Search Engine Marketing in
Small and Medium Companies: Status Quo and Per-
spectives. In Cruz-Cunha, M. and Varaj
˜
ao, J., editors,
E-Business Managerial Aspects, Solutions and Case
Studies, pages 206–221. igi-global.
Blask, T. (2013). Applying Bayesian Parameter Estimation
to A / B Tests in E-Business Applications : Examining
the Impact of Green Marketing Signals in Sponsored
Search Advertising. In Proceedings of the Interna-
tional Conference on e-Business (ICE-B 2013).
Blask, T., Funk, B., and Schulte, R. (2011). Should Com-
panies Bid on their Own Brand in Sponsored Search?
In Proceedings of the International Conference on e-
Business (ICE-B 2011), pages 14–21, Seville, Spain.
Chapelle, O. and Zhang, Y. (2009). A dynamic bayesian
network click model for web search ranking. In
Proceedings of the 18th international conference on
World wide web - WWW ’09, page 10, New York, New
York, USA. ACM Press.
Craswell, N., Zoeter, O., Taylor, M., and Ramsey,
B. (2008). An experimental comparison of click
position-bias models. In Proceedings of the interna-
tional conference on Web search and web data mining
- WSDM ’08, page 8, New York, New York, USA.
ACM Press.
Dave, K. S. and Varma, V. (2010). Learning the click-
through rate for rare/new ads from similar ads. In
Proceeding of the 33rd international ACM SIGIR con-
ference on Research and development in information
retrieval - SIGIR ’10, number July, page 897, New
York, New York, USA. ACM Press.
Gauzente, C. (2009). Information search and paid results
proposition and test of a hierarchy-of-effect model.
Electronic Markets, 19(2-3):163–177.
Gluhovsky, I. (2010). Forecasting Click-Through Rates
Based on Sponsored Search Advertiser Bids and In-
termediate Variable Regression. October, 10(3):1–28.
Jansen, B. and Mullen, T. (2008). Sponsored search: an
overview of the concept, history, and technology. In-
ternational Journal of Electronic Business, 6(2):114–
131.
Jansen, B. J., Flaherty, T. B., Baeza-Yates, R., Hunter, L.,
Kitts, B., and Murphy, J. (2009). The Components and
Impact of Sponsored Search. Computer, 42(5):98–
101.
Jansen, J. (2011). The Serious Game of Bidding on Key-
words. In Understanding Sponsored Search Core El-
ements of Keyword Advertising, chapter 8, pages 176–
201. Cambridge University Press.
Joachims, T., Granka, L., Pan, B., Hembrooke, H., and
Gay, G. (2005). Accurately interpreting clickthrough
data as implicit feedback. In Proceedings of the 28th
annual international ACM SIGIR conference on Re-
search and development in information retrieval - SI-
GIR ’05, page 154, New York, New York, USA. ACM
Press.
Joachims, T., Granka, L., Pan, B., Hembrooke, H., Radlin-
ski, F., and Gay, G. (2007). Evaluating the accuracy
of implicit feedback from clicks and query reformula-
tions in Web search. ACM Transactions on Informa-
tion Systems, 25(2):1–26.
DoSpecificTextFeaturesInfluenceClickProbabilitiesinPaidSearchAdvertising?
61

Kruschke, J. K. (2010). Doing Bayesian Data Analysis :
A Tutorial with R and BUGS, volume 1. Academic
Press.
Kruschke, J. K. (2012). Bayesian Estimation Supersedes the
t Test. Journal of experimental psychology. General.
Regelson, M. and Fain, D. C. Predicting Click-Through
Rate Using Keyword Clusters. In ACM, editor,
EC’06.
Richardson, M., Dominowska, E., and Ragno, R. (2007).
Predicting clicks: estimating the click-through rate for
new ads. In Proceedings of the 16th international con-
ference on World Wide Web, pages 521–530. ACM
New York, NY, USA.
Varian, H. (2009). Online ad auctions. American Economic
Review, 99(2):430–434.
Yang, S. and Ghose, A. (2010). Analyzing the Relationship
Between Organic and Sponsored Search Advertising:
Positive, Negative, or Zero Interdependence? Market-
ing Science, 30(1):1–22.
Zhong, F., Wang, D., Wang, G., Chen, W., Zhang, Y., Chen,
Z., and Wang, H. (2010). Incorporating post-click
behaviors into a click model. Annual ACM Confer-
ence on Research and Development in Information
Retrieval, pages 355–362.
Zhu, Z., Chen, W., Minka, T., Zhu, C., and Chen, Z. (2010).
A novel click model and its applications to online
advertising. In Proceedings of the third ACM inter-
national conference on Web search and data mining,
pages 321–330. ACM.
ICE-B2014-InternationalConferenceone-Business
62
