
Combining Top-down and Bottom-up Visual Saliency
for Firearms Localization
Edoardo Ardizzone, Roberto Gallea, Marco La Cascia and Giuseppe Mazzola
DICGIM, Universita’ degli Studi di Palermo, Palermo, Italy
Keywords:
Firearms Detection, Visual Saliency, Probabilistic Model.
Abstract:
Object detection is one of the most challenging issues for computer vision researchers. The analysis of the
human visual attention mechanisms can help automatic inspection systems, in order to discard useless infor-
mation and improving performances and efficiency. In this paper we proposed our attention based method to
estimate firearms position in images of people holding firearms. Both top-down and bottom-up mechanisms
are involved in our system. The bottom-up analysis is based on a state-of-the-art approach. The top-down
analysis is based on the construction of a probabilistic model of the firearms position with respect to the peo-
ple’s face position. This model has been created by analyzing information from of a public available database
of movie frames representing actors holding firearms.
1 INTRODUCTION
The human visual system is able to easily detect an in-
teresting object in natural scenes through the selective
attention mechanism, that discard useless informa-
tion, selecting the most relevant ones for higher-level
cognitive processing. The attention process selects
visual information on the basis of both saliency in
the image (bottom-up, task-independent process), and
of prior knowledge about the context and the objects
in the scene (top-down, task dependent process). In
the top-down process, attention detects salient areas
through understanding and recognition mechanisms.
Bottom-up processing is a primitive function of the
human vision system and responds to various stim-
uli such as intensity, color, and orientation, etc. In a
generic scene analysis, both of them are integrated for
a faster visual search. Models of integration are natu-
ral in human vision, but are difficult to define for com-
puter vision applications. In fact, searching for a par-
ticular object in a scene can be extremely difficult, as
one has to consider all possible views that the object
can take. In our work we are interested in searching
for firearms locations, particularly in scenes where
people are holding firearms. The proposed system is
based on a combination of a bottom-up saliency map
and top-down information, obtained from the analysis
of the relative positions of the firearm with respect to
the face of a person in the scene. In the next section
we illustrate some state-of-the-art methods for visual
saliency analysis and attention based object recogni-
tion. In section 3 we present our firearms localiza-
tion system. In section 4 we discuss and evaluate our
experimental results. A conclusive section ends the
paper.
2 PREVIOUS WORKS
Many computational implementations of visual atten-
tion models have been published in the past years.
Several works proposed algorithms to extract bottom-
up saliency information, exploiting different features:
multiscale information (Itti et al., 1998), graph based
activation maps (Harel et al., 2007), colors (Liu et al.,
2011; Kovacs and Sziranyi, 2007), isophotes and
color histograms (Valenti et al., 2009), distribution of
the interest points (Ardizzone et al., 2011). The au-
thors of (Judd et al., 2009) studied the relationship
between computer generated saliency maps and maps
created by tracking the gaze of people looking at a
number of test images. Other works focused on top-
down information: (Gao et al., 2009), (Kanan et al.,
2009), (Oliva et al., 2003). In literature there are
also some theories on mechanisms of integration be-
tween bottom-up and top-down information: Feature
Integration Theory (Treisman and Sato, 1990), Bi-
ased Competition Model (Desimone and Duncan, ),
Guided Search (Wolfe, 1994), Optimal Gains (Naval-
pakkam and Itti, 2007). Many scientific works rely on
25
Ardizzone E., Gallea R., La Cascia M. and Mazzola G..
Combining Top-down and Bottom-up Visual Saliency for Firearms Localization.
DOI: 10.5220/0005054300250032
In Proceedings of the 11th International Conference on Signal Processing and Multimedia Applications (SIGMAP-2014), pages 25-32
ISBN: 978-989-758-046-8
Copyright
c
2014 SCITEPRESS (Science and Technology Publications, Lda.)

object recognition, which often focus on two aspects
of the problem: extracting features from images, and
classifying these features.
Even if Computer Vision researchers achieved im-
pressive results on object detection in the last years
(Lowe, 2004; Viola and Jones, 2004), this is still an
open research field. Many factors, such as changes
in viewpoint and scale, illumination, partial occlu-
sions and multiple instances further complicate the
problem of object detection (Uijlings et al., 2013;
Felzenszwalb et al., 2010; Vedaldi et al., 2009; Lopez
et al., 2012). Attentional frameworks have been pro-
posed to speed up the visual search (Bonaiuto and Itti,
2005) without exploiting top-down knowledge about
the target. The VOCUS-model from (Frintrop, 2006)
use both a bottom-up and a top-down version of the
saliency map: the bottom-up map is similar to that of
Itti and Koch’s, while the top-down map is a tuned
version of the bottom-up one, and the total saliency
map is a linear combination of the two maps with
user provided weights. The authors of (Oliva et al.,
2003) show that top-down information extracted from
the context of the scene can modulate the saliency
of image regions during the task of object detection.
Regarding firearms detection, that is the topic of our
paper, notwithstanding the importance of the topic
in the era of social network and anti-terrorism strug-
gles for the authorities, just a few works were pro-
posed. Among these (Zhang and Blum, 1997; Yang
and Blum, 2002; Xue and Blum, 2003) proposed tech-
niques to reveal concealed firearms, by fusing infor-
mation from multiple sources (thermal/infrared (IR),
millimeter wave (MMW), and visual sensors). How-
ever, to the best of our knowledge, no methods based
solely on image information exist.
3 PROPOSED SYSTEM
The proposed system is based on the combination
of the information from two different attention pro-
cesses: a bottom-up saliency map and a top-down
saliency map. Figure 1 shows the scheme of the over-
all system. Regarding the bottom-up analysis, we
used in our system the GBVS approach by (Harel
et al., 2007) which is based on a biologically plau-
sible model, and it consists of two steps: activation
maps on certain feature channels and normalization,
which highlights conspicuity. The top-down anal-
ysis is based on the construction of a probabilistic
model, able to estimate the regions of an image where
a firearm is more likely to be found, with respect to
the position of the person’s face. The main idea is to
build the statistics of a large set of samples and then fit
a model onto it, which is then applied to every image
to analyze. This approach will be further explained in
the next subsections, after the description of dataset
used to create the probabilistic model.
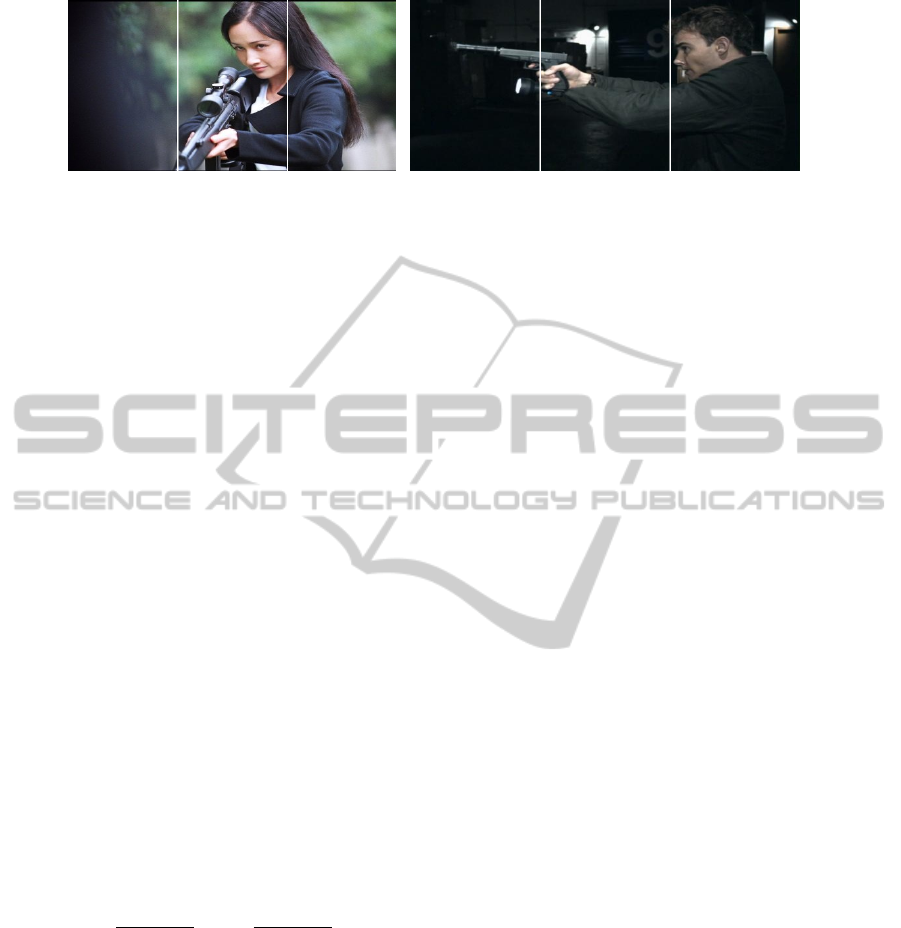
3.1 Dataset Description
Due to the large number of images required, a com-
prehensive dataset had to be acquired. However,
a large realistic database with a variety of firearms
is hard to be built from scratch. For this reason
the images available in the “Internet Movie Firearms
Database” (IMFDB)
1
were used. The database is
composed of several thousands images taken from
movie scenes. Each image represents one or more
persons holding one or more firearms. Images
are middle quality color spanning from 0.06 to 2
megapixels. Figure 2 shows some examples of im-
ages taken from the database.
3.2 Dataset Annotation
In order to obtain reliable statistics from the images,
they required to be manually annotated with some la-
bels. Then, several metrics were measured. In par-
ticular, 1000 images were labeled with the following
information:
• Image filename;
• Image size, both horizontal I
w
and vertical I
h
;
• Firearm position W
px
and W
py
and size, both hori-
zontal W
w
and vertical W
h
.
• Face position F
px
and F
py
and size, both horizontal
F
w
, and vertical F
h
.
From these elements, additional information is ex-
tracted, namely:
• Distance from face to firearm d
w− f
normalized
w.r.t. face size;
• Orientation of the firearm w.r.t. the subject face
α
w− f
;
• The area of the firearm bounding box;
• The area of the face bounding box.
Note that each measure is normalized w.r.t. face
sizes, in order to make the values comparable
notwithstanding the subject size or image resolution.
1
Internet Movie Firearms Database (IMFDB) -
http://www.imfdb.org/
SIGMAP2014-InternationalConferenceonSignalProcessingandMultimediaApplications
26
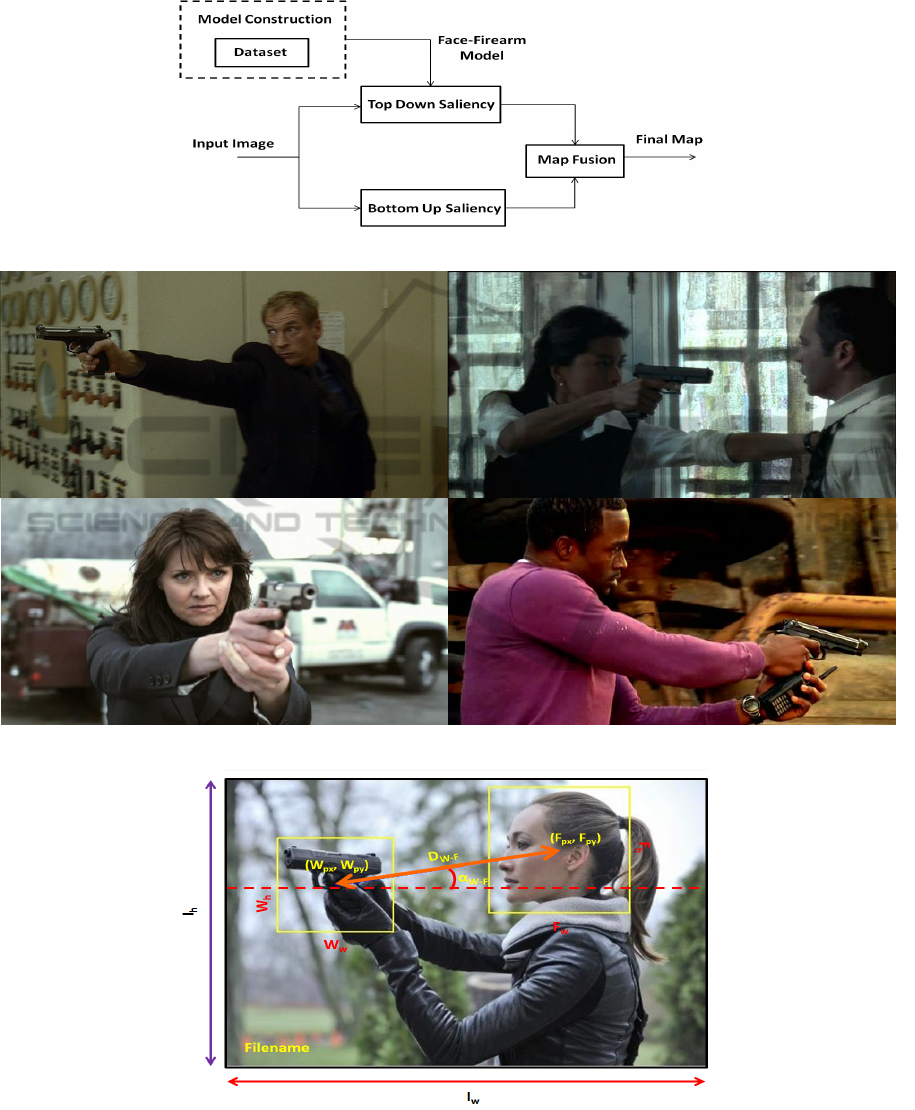
Figure 1: Blocks diagram for the proposed system.
Figure 2: Example images from the Internet Movie Firearms Database - IMFDB.
Figure 3: Annotated measures for the dataset: Horizontal I
w
and vertical I
h
image size; firearm position W
px
and W
py
and size,
both horizontal W
w
and vertical W
h
; face position F
px
and F
py
and size, both horizontal F
w
, and vertical F
h
.
3.3 Model Construction
The key idea is that a person holding a firearm has a
pose which generally follows some constraints, due
to physical reasons (for example, his/her arm exten-
sion), or more practical ones (for example he/she is
taking aim), making the probability distribution of the
firearm position not-uniform across the image. Some
CombiningTop-downandBottom-upVisualSaliencyforFirearmsLocalization
27
(a) (b)
Figure 4: Two examples of image subdivision to categorize the images w.r.t. face position.
other considerations could be done. As an example,
considering a subject head located on the left of the
image, the firearm is very likely to lie on its right (and
viceversa). Moreover, if the head is large w.r.t. the
whole image, the firearm is likely to lie close to the
face (the image is a portrait of an aiming person). Fol-
lowing these considerations, the whole dataset was
subdivided according to two criteria: face position
and face extensions w.r.t. image sizes. For the first
categorization, each image was partitioned into three
regions as shown in Figure 4. The purpose of using
such regions is mainly to find out if the subject is on
the left, center or right. Note that an horizontal sub-
division was not required because faces are located
only in the upper regions of the images. The second
categorization is made on a face size basis. If the face
surface is at least as large as the 30% of the whole
image surface, the face is labeled as “large”, other-
wise as “small”. These are only two possible types
of models that can be built by analyzing the dataset
information.
The Firearm Probability Map is computed as the
a posteriori probability of the firearm position, condi-
tioned by the face position, registered with respect to
the face center and rescaled with respect to the face
size: Eqs.(1, 2)
P
w
(x, y) = P(W
′
px
, W
′
py
|F
px
, F
py
), (1)
W
′
px
=
W
px
− F
px
F
w
W
′
py
=
W
py
− F
py
F
h
, (2)
where
- (W
px
, W
py
) and (F
px
, F
py
) are the coordinates of the
center of mass of the bounding box that includes the
firearm and the face, respectively, in the inspected im-
ages of the dataset;
- (W
′
px
, W
′
py
) are the registered and rescaled coordi-
nates of the weapons.
- F
w
and F
h
are the horizontal and the vertical size of
the bounding box of the detected face.
For creating the required model, a statistics over some
dataset quantities was assessed. In particular the joint
histogram of d
w− f
and α
w− f
was built. The result is
shown in Figure 5 and Figure 6 respectively for face
position and face size categorization. In the plot x
values refer to d
w− f
and y values refer to α
w− f
. As
expected, the distributions are considerably dissimi-
lar in the different cases related both to face positions
(Figure 5). Also, even when considering face size, is
evident that when the face is large, the distance of the
firearm from it is small and viceversa.
In the direction of building the probability maps,
the joint histograms are converted from polar to
cartesian coordinates, values are then low-passed to
smooth the distribution. An example of the resulting
maps is shown in Figure 7(b). Note that the coordi-
nates of the map are normalized w.r.t. face size and
are centered on (x, y) = (0, 0).
For applying the model to a test image, once the
face position has been detected, the top-down map M
needs to be registered to the image by being traslated
to the face center and scaled to reflect face size. Fi-
nally, the resulting map M
d
is recovered by combining
M with GBVS saliency S
GBV S
. Such operation has a
dual purpose:
• Filter out non-salient regions underlying the
firearm probability map.
• Filter out salient regions NOT underlying the
firearm probability map.
Scalar product between maps was chosen as integra-
tion operator (Eq.3).
M
d
= M · S
GBV S
. (3)
Figure 7(a-f) shows the whole process: the original
image is used to guide the registration of the proper
top-down probability map (according to face position
and size). Then the map is integrated with the GBVS
saliency to recover the final firearm saliency.
4 EXPERIMENTAL TESTS,
RESULTS AND DISCUSSION
As described in Section 3, the top-down model has
been built by analyzing 1000 images from the Inter-
net Movie Firearms Database. In our tests we selected
SIGMAP2014-InternationalConferenceonSignalProcessingandMultimediaApplications
28
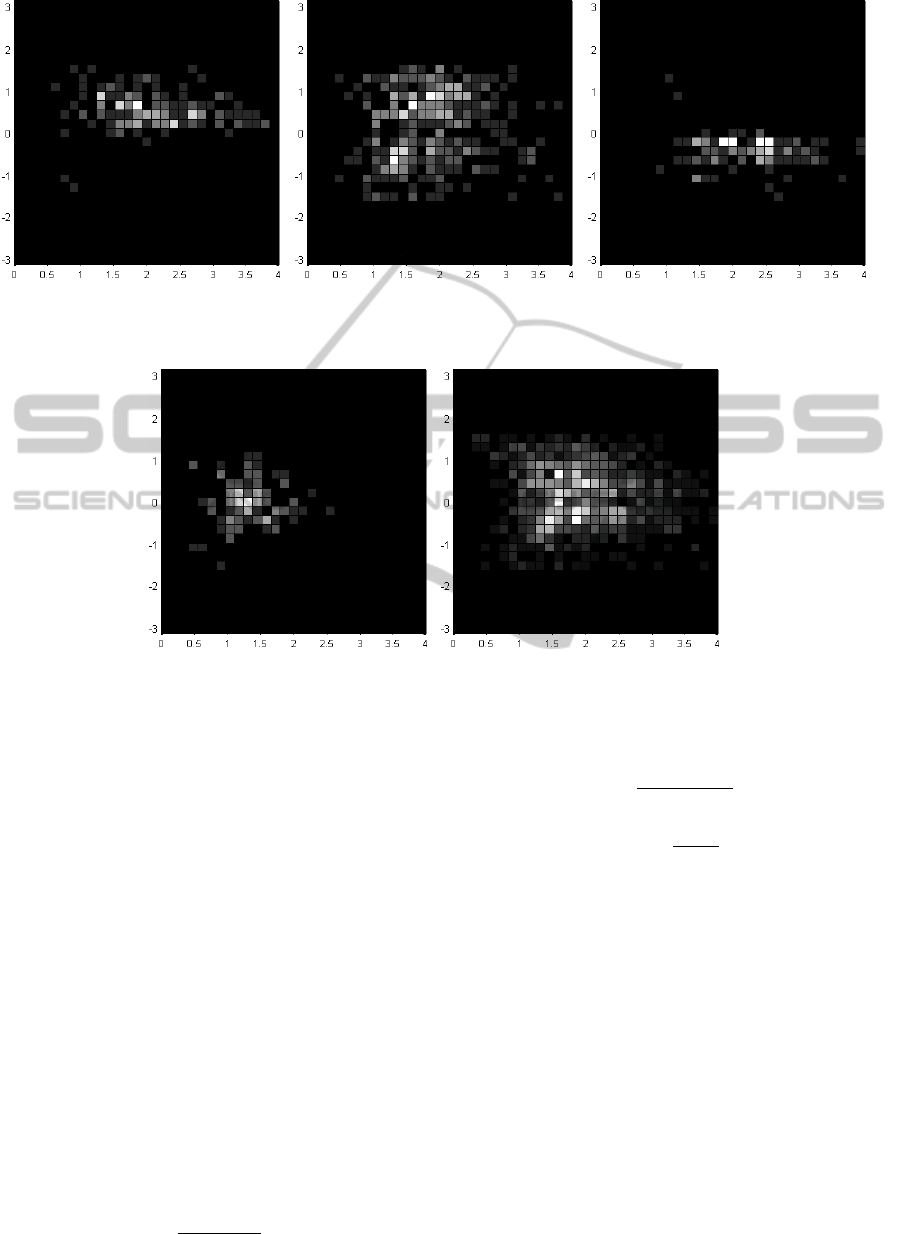
(a) Left (b) Center (c) Right
Figure 5: Joint histograms for d
w− f
and α
w− f
for the three image categories related to face position. From (a) to (c) are
shown histograms for faces located on the left (a), center (b) and right (c) regions of the images.
(a) Large (b) Small
Figure 6: Joint histograms for d
w− f
and α
w− f
for the two image categories related to face size, for large faces (a) and small
faces (b) respectively. Note that when faces are large, distances are mostly small and vice-versa.
1000 more images from the database, and we anno-
tated them by drawing the bounding box of the areas
that include the firearms. Therefore, for each test im-
age, we have a binary map that indicates the position
of the firearm, that is our reference ground truth mask
for that image. As well, the output map of the system
is obtained from the input image, once the position of
the face in the image is known. In this work we are not
interested in the face detection process, as there are
many works in literature (e.g. Viola and Jones (Viola
and Jones, 2004)) that achieve impressive results. The
output map is then thresholded, after normalization,
by different threshold values, in the range of [0,0.95]
with step 0.05. Finally, the bounding boxes of the
connected components of the binarized map are taken
as our output binary mask (see Figure 8). To evaluate
the accuracy of our localization system we compare
the binary mask of the detected map M
d
, for a given
threshold, with the reference binary mask M
r
of that
image, in terms of recall, precision and F-measure:
P = n
(M
d
∩ M
r
)
n(M
d
)
, (4)
P =
n(M
d
∩ M
r
)
n(M
r
)
, (5)
F
1
= 2
P · R
P + R
(6)
where:
• R is the recall, the ratio of the number of pixels in
the intersection of the detected mask M
d
and the
reference mask M
r
, and the number of pixels in
M
r
;
• P is the precision, the ratio of the number of pixels
in the intersection of the detected mask M
d
and
the reference mask M
r
, and the number of pixels
in M
d
;
• F1 is the F-measure, that is the is the harmonic
mean of precision and recall.
In our experiments we divided the test dataset into
three subsets: images in which the faces are on the
left, on the center or on the right part of the scene,
then we evaluated three different top-down models.
CombiningTop-downandBottom-upVisualSaliencyforFirearmsLocalization
29
(a) Original image (b) top-down map (c) Registered map
(d) GBVS map (e) Integrated map (f) Overlay
Figure 7: Firearm detection process: the original image (a) is used to determine which of the top-down top-down map (b) has
to be used. The map is then registered onto the image, according to face position and size (c). GBVS saliency (d) is integrated
with the top-down map to obtain the final firearm probability map (e). An overlay of the map with the original image is shown
in (f).
(a) Input image (b) Reference mask
(c) Thresholded output
mask
(d) Output bounding box
Figure 8: Evaluation process. Input image (a); reference mask, annotated by hand (b); binarized output mask (c) with
threshold=0.35; bounding box (d) of the mask in (c). In our experiments we compare the mask in (b) with the mask in (d).
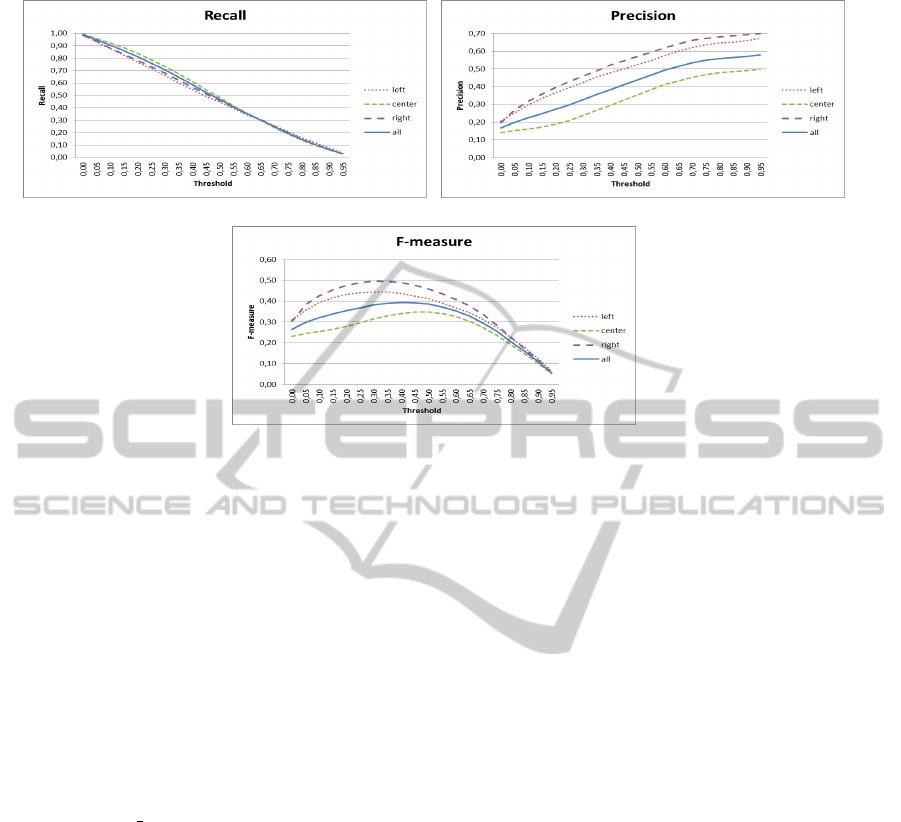
Figure 9(a-c) shows the results obtained in the three
cases, and with all the data, in terms of recall, preci-
sion and F-measure. We observed that when the face
is located on the right or on the left part of the image
results are better than those obtained when the face is
on the center. This could be reasonably expected as,
when the person is on the center of the image, there
is, more or less, the same probability to find a firearm
on the left or on the right side of the person. In fact
the top-down model, in this case, is symmetrical with
respect of the face position, and the output masks in-
clude more pixels than in other two cases, resulting in
a little bit higher recall and a much lower precision.
The best threshold value is that which maximizes the
F-measure, i.e. the best tradeoff between recall and
precision, and it is equal to 0.35 for the “left” and
“right” models, and to 0.4 for the “center” model. Re-
sults are very encouraging, especially for the “left”
and the “right” models.
5 CONCLUSIONS AND FUTURE
WORKS
In this paper we showed that top-down and bottom-
up information can be effectively integrated for object
detection purposes. In particular in our work we are
interested in finding the location of firearms in natural
scenes representing people holding firearms. The al-
gorithm would be extended to include firearm shape
validation in order to suppress some false positives.
We also consider to integrate information about the
pose of the face in the firearm position estimate.
The proposed system has been designed to be
a step of more complex architectures, with applica-
tions in video surveillance systems, crime prevention
mechanisms, forensics analysis, etc. With this goal in
our future works we plan to create a complete process
pipeline for the analysis of images of armed persons:
from people localization, to firearms position estima-
SIGMAP2014-InternationalConferenceonSignalProcessingandMultimediaApplications
30
(a) (b)
(c)
Figure 9: Experimental results: recall (a), precision (b), and F-measure (c). Results are shown for the three cases we analyzed
in our experiments, in terms of the face position in the image (left, center and right), and with all the data.
tion (that is the topic of this paper), to firearm detec-
tion (to identify whether an object held in the hand by
a person is a firearm or a harmless item) and classi-
fication (to distinguish between some firearm classes,
once a firearm has been detected).
ACKNOWLEDGEMENTS
This work has been funded by the MIUR (Italian
Ministry of Education, University and Research) Ital-
ian project PON01 01687, SINTESYS - Security and
INTElligence SYStem. We also acknowledge Mr.
Francesco Toto who contributed with his work to the
implementation and in the testing phase.
REFERENCES
Ardizzone, E., Bruno, A., and Mazzola, G. (2011). Visual
saliency by keypoints distribution analysis. In ICIAP
(1), pages 691–699.
Bonaiuto, J. J. and Itti, L. (2005). Combining attention and
recognition for rapid scene analysis. In Proceedings of
the 2005 IEEE Computer Society Conference on Com-
puter Vision and Pattern Recognition (CVPR’05) -
Workshops - Volume 03, CVPR ’05, pages 90–, Wash-
ington, DC, USA. IEEE Computer Society.
Desimone, R. and Duncan, J. Neural mechanisms of selec-
tive visual attention. Annu Rev Neurosci, pages 193–
222.
Felzenszwalb, P., Girshick, R., McAllester, D., and Ra-
manan, D. (2010). Object detection with discrimina-
tively trained part based models. Pattern Analysis and
Machine Intellingence, 32(9).
Frintrop, S. (2006). VOCUS: A Visual Attention System for
Object Detection and Goal-Directed Search. Lecture
Notes in Artificial Intelligence. Springer.
Gao, D., Han, S., and Vasconcelos, N. (2009). Discriminant
saliency, the detection of suspicious coincidences, and
applications to visual recognition. IEEE Transac-
tions on Pattern Analysis and Machine Intelligence,
31(6):989–1005.
Harel, J., Koch, C., and Perona, P. (2007). Graph-based
visual saliency. In Advances in Neural Information
Processing Systems 19, pages 545–552. MIT Press.
Itti, L., Koch, C., and Niebur, E. (1998). A model of
saliency-based visual attention for rapid scene anal-
ysis. IEEE Transactions on Pattern Analysis and Ma-
chine Intelligence, 20(11):1254–1259.
Judd, T., Ehinger, K., Durand, F., and Torralba, A. (2009).
Learning to predict where humans look. In IEEE In-
ternational Conference on Computer Vision (ICCV).
Kanan, C., Tong, M. H., Zhang, L., and Cottrell, G. W.
(2009). SUN: Top-down saliency using natural statis-
tics. Visual cognition, 17(6-7):979–1003.
Kovacs, L. and Sziranyi, T. (2007). Focus area extraction
by blind deconvolution for defining regions of interest.
IEEE Trans. Pattern Anal. Mach. Intell., 29(6):1080–
1085.
Liu, T., Yuan, Z., Sun, J., Wang, J., Zheng, N., Tang,
X., and Shum, H.-Y. (2011). Learning to detect a
salient object. IEEE Trans. Pattern Anal. Mach. In-
tell., 33(2):353–367.
Lopez, A. M., Vanrell, M., Bagdanov, A. D., Van de Wei-
CombiningTop-downandBottom-upVisualSaliencyforFirearmsLocalization
31

jer, J., Anwer, R. M., and Khan, F. S. (2012). Color
attributes for object detection. 2013 IEEE Conference
on Computer Vision and Pattern Recognition, 0:3306–
3313.
Lowe, D. G. (2004). Distinctive image features from scale-
invariant keypoints. Int. J. Comput. Vision, 60(2):91–
110.
Navalpakkam, V. and Itti, L. (2007). Search Goal Tunes
Visual Features Optimally. Neuron, 53(4):605–617.
Oliva, A., Torralba, A., Castelhano, M. S., and
M.Henderson, J. (2003). Top-down control of visual
attention in object detection.
Treisman, A. and Sato, S. (1990). Conjunction search revis-
ited. In Journal of Experimental Psychology: Human
Perception and Performance, pages 459–478.
Uijlings, J. R. R., Van de Sande, K. E. A., Gevers, T., and
Smeulders, A. W. M. (2013). Selective search for ob-
ject recognition. International Journal of Computer
Vision.
Valenti, R., Sebe, N., and Gevers, T. (2009). Image saliency
by isocentric curvedness and color. In In ICCV.
Vedaldi, A., Gulshan, V., Varma, M., and Zisserman, A.
(2009). Multiple kernels for object detection. In Pro-
ceedings of the International Conference on Computer
Vision (ICCV).
Viola, P. and Jones, M. J. (2004). Robust real-time face
detection. Int. J. Comput. Vision, 57(2):137–154.
Wolfe, J. M. (1994). Guided Search 2.0: A revised model
of visual search. Psychonomic Bulletin & Review,
1(2):202–238.
Xue, Z. and Blum, R. S. (2003). Concealed Weapon De-
tection Using Color Image Fusion. In Proceedings of
6th International Conference of Information Fusion,
volume 1, pages 622–627.
Yang, J. and Blum, R. S. (2002). A statistical signal process-
ing approach to image fusion for concealed weapon
detection. In IEEE Intl. Conf. on Image Processing,
pages 513–516. Marcel Dekker.
Zhang, Z. and Blum, R. S. (1997). Region-based image fu-
sion scheme for concealed weapon detection. In In
Proceedings of the 31st Annual Conference on Infor-
mation Sciences and Systems, pages 168–173.
SIGMAP2014-InternationalConferenceonSignalProcessingandMultimediaApplications
32
