
Detection of Gait Events and Assessment of Fall Risk Using
Accelerometers in Assisted Gait
A. Tereso
1
, M. Martins
1
, C. P. Santos
1
,
M. Vieira da Silva
2
, L. Gonçalves
1
and L. Rocha
1
1
Industrial Electronics Dep., Minho University, Guimarães, Portugal
2
Braga Hospital, Braga, Portugal
Keywords: Walker, Accelerometer, Assisted-Gait, Stability, Fall Risk, KOA (Knee Osteoarthritis), TKA (Total Knee
Arthroplasty).
Abstract: The use of the walker in rehabilitation has increased in the past few years. Therapists evaluate patient’s
rehabilitation by observation and subjective tests. Thus, it is necessary the use of an assistive tool which can
measure and quantify the patient’s walker-assisted movement and stability, providing an objective clinical
assessment. The aim of this study is to detect differences in assisted gait when using the assistive devices
(ADs) – crutches, standard walker and rollator (4-wheeled walker) with forearm supports (RFS) - in patients
with knee osteoarthritis (KOA) that suffered the surgery - Total Knee Arthroplasty (TKA). Additionally, it
is to verify the link between gait parameters and acceleration signals.
The evaluation is reached by the use of two 3 axis-accelerometers. The signals extracted from the sensors, at
the ankle and trunk, are related to gait events and evaluation of fall risk, respectively. Results show that
despite the differences between the signals obtained with the three ADs and with the subjects in this study, it
is possible to identify effectively the gait parameters and prove the stability that the RFS provides.
1 INTRODUCTION
Pain relief and the improvement of knee function are
the two main reasons for total knee arthroplasty
(TKA) in cases of Knee Osteoarthritis (KOA). KOA
patients suffer by pain, stiffness and decreased range
of motion of the knee, which provokes the reduction
of their mobility (Kaufman et al., 2001).
Precise motor function evaluation in
rehabilitation programs is a major challenge in
clinical practice and has gained widespread interest
with recent technologies. Nowadays, in assistive
device rehabilitation, therapists evaluate patient’s
rehabilitation by observation and subjective tests.
Such information is qualitative and final clinical
decisions are strongly empirical and subjective. This
evaluation can be more objective and quantitative, if
it applies gait techniques that allow a systematic
study and characterization of the human locomotion
like accelerometers - low cost wearable sensor
systems. These devices are easy to use, can be
positioned closed to the places that are supposed to
be, are portable and have several biomedical
applications (Watanabe et al., 2011).
In this study, it is proposed to assess gait parameters
(stance, swing, stride time, etc.) and their variability
in assisted gait with three different assistive devices
(ADs) (crutches, standard walker and rollator with
forearm supports (RFS)) with KOA patients that
suffered the surgery TKA. This evaluation was
reached with two accelerometers placed at the ankle
to detect gait events (toe-off and heel strike) and at
the trunk to assess the centre of mass (COM)
displacement of the subject. These will provide
information about the stability provided by the ADs,
as well as estimation of fall risk. The choice of the
spatiotemporal (stride, swing and stance time,
velocity, cadence and step length) over the
kinematics parameters, it was because these
parameters provide an objective measurement tool
and can help in evaluating KOA severity,
effectiveness of treatment and might help in disease
management (Debi et al. 2011). It was not possible
to compare in this study the assisted gait with
unassisted gait, because at the moment of this
evaluation, the patients were in recovery from the
surgery (between 3
rd
and 5
th
day after surgery), so
they only could walk with the help of ADs. The
788
Tereso A., Martins M., P. Santos C., Vieira da Silva M., Gonçalves L. and Rocha L..
Detection of Gait Events and Assessment of Fall Risk Using Accelerometers in Assisted Gait.
DOI: 10.5220/0005117507880793
In Proceedings of the 11th International Conference on Informatics in Control, Automation and Robotics (ICINCO-2014), pages 788-793
ISBN: 978-989-758-039-0
Copyright
c
2014 SCITEPRESS (Science and Technology Publications, Lda.)

KOA patients are characterized by slow speed,
shorter step length and shorter single limb support
(Debi et al. 2011). Nowadays, the recovery of KOA
patients is made with the help of crutches. However,
this type of AD provides an unnatural gait
performance and the patients cannot alleviate their
pain while walking. Thus, it is intended on this study
to find a better solution for the recovery of KOA
patients, providing a better gait performance in
terms of cadence, speed, comfort and safety. The
authors hypothesized that the RFS is a better
solution.
The localization of the accelerometer depends on
the purpose of the study in terms of gait assessment.
In (Sabatini et al. 2005; Doheny et al. 2012), they
only used 1 accelerometer positioned at the centre of
the foot of the subject to identify gait parameters,
but the signal had too much noise and was very
irregular. Also, the sensor can be located at the trunk
and at the ankle (Lee et al. 2010) for gait evaluation.
However, to detect gait events (toe-off and heel
strike) it is preferable to place the sensor at the
ankle, over the trunk, since it is more sensitive to
changes on the lower limbs, providing more
information about gait events (Lee et al. 2010). In
order to detect automatically such events, the
selected method of this study will be based on (Lee
et al. 2010). Thus, assisted-gait evaluation with an
accelerometer still remains to be validated and in
this study it will be performed with the sensor at the
ankle. In this case, since the subjects have the knee
injured, it would make sense the placement of the
sensor at the knee, to better assessment. However, in
this study we intended to evaluate the gait and detect
gait events, so, since the magnitude of acceleration
increases from the head to the ankle (Mathie et al.
2004), the signal in the ankle will be more precise
and reliable.
To assess the risk of fall, a sensor should be
located near the COM since it is the best place to
evaluate with accuracy (Vaughan et al. 1999). Thus,
in this work, an accelerometer is placed at the level
of the trunk (sacrum), closed to the COM to evaluate
its displacement. The assessed COM displacement
parameters are based in (Doheny et al. 2012).
However, the evaluation performed in (Doheny et al.
2012) was done for the standing position and not
during walk. Thus, this study aims to verify the
potential of using an accelerometer placed on the
trunk to assess fall risk in assisted gait.
Overall, the goal of this study is to detect
differences between three ADs in assisted gait by
analysing which parameters are most affected by the
use of the crutches, standard walker and RFS in
patients with KOA, considering gait events and the
trunk parameters. As far as the authors know, there
are no references on the use of accelerometers in
assisted gait with any ADs, only in non-assisted gait.
Furthermore, it is intended to verify and validate if
the data extracted from the accelerometers is able to
detect gait events and changes on the variability of
the parameters in assisted gait. The authors expect
that the RFS produce the most stable and less
variable gait, because of the support provided by the
forearms, relatively to the others ADs.
The article is organized as follows. In section 2 it
is presented the algorithm, the processing
implemented and the parameters analysed. Section 3
briefly reveals the results that were obtained.
Sections 4 and 5 are referenced to the discussion and
conclusions of these results, respectively.
2 METHODS
2.1 Subjects
A group (N=7) of subjects (3 men and 4 women)
aged 67.3 5.06 years that were diagnosed with
KOA and suffered the surgery TKA were selected to
the trials. The study was conducted at Hospital of
Braga, approved by the Ethical Committee, and all
the patients signed the informed consent. All trials
were filmed with a video camera.
2.2 Test Procedure
In order to assess the effect of the ADs on gait, tests
are conducted using crutches, standard walker and
RFS (ASBGO walker developed by the authors’
team). All the ADs are shown in Figure 1. In these
tests, subjects had to walk approximately 10m with
the ADs, along a corridor. 3 walking trials for each
subject and AD are realized. Then, the mean and
standard deviation are estimated for each gait
parameter. For each patient the height of the Ads is
adjusted. To measure the accelerations of the lower
limb and the trunk, two inertial sensors are used.
These sensors (SMI, MP6000 of InvenSense, which
include an accelerometer and a gyroscope, both of
them are 3-axial) need a computer and a base station
(CC2530 of Texas Instrument).
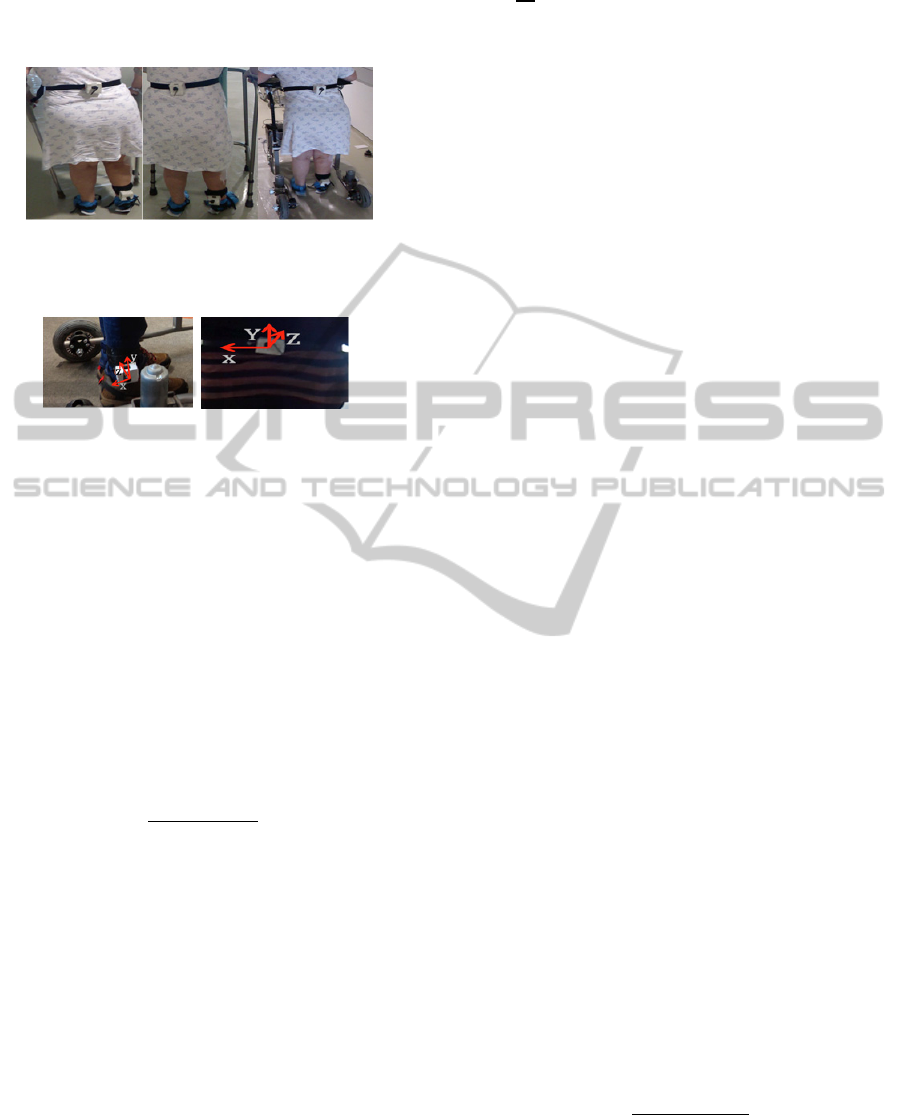
In this study only the accelerometer is used. Two
sensors are used, for simplicity, attached to the ankle
of the leg with the injured knee and at the sacrum
(trunk). The used system configuration and the
coordinates of reference for the ankle and trunk are
shown in Figure 2. The x-axis, y-axis and z-axis
DetectionofGaitEventsandAssessmentofFallRiskUsingAccelerometersinAssistedGait
789
correspond to the medio-lateral (ML), vertical (V)
and anterior-posterior (AP) accelerations,
respectively.
Figure 1: ADs used in this study. Left image: Crutches;
centre image: standard walker; and right image: RFS
ASBGo walker).
Figure 2: Description of the axis of the accelerometer at
the right ankle (left image) and at the trunk (right image).
2.3 Data Acquisition and Processing
2.3.1 Detection of Gait Parameters
The algorithm implemented in this study for the
detection of gait events (heel strike and toe-off) is
based on (Lee et al. 2010). These two events are
essential for the calculation of gait parameters like
stance and swing phase.
The implementation consists on the detection of
the time peak of Heel Strike (HS) and Toe-Off (TO)
events. First, at each instant of time, the data of each
axis is summed and transformed to produce the
‘Signal Vector Machine’, represented by s:
(1)
Where a
x
, a
y
and a
z
are the ML, V and AP
accelerations, respectively.
This step is applied since acceleration is highly
influenced by the position of the sensor and the 3
axis have significant information. Second, s is
filtered by a low pass filter (f
pass
=6Hz, f
stop
=10Hz) to
extract features related to the gait cycle,
∑
,
(2)
where b
i
corresponds to the coefficients of the
filter. These coefficients are obtained by running the
fdatools interface in MATLAB. Third, a least-square
polynomial derivative approximation filter
eliminates noise (points that could be considered
wrongly as peaks),
1
10
1
1
3
24
(3)
After this processing, the final step consists on
the peak detection. For each gait cycle there are two
peaks, each of them corresponding to a gait event
(HS and TO). Before this last step, it was necessary
to remove some sample points from the start and end
of each test, which correspond to the period of
acceleration and deceleration in gait, respectively.
the duration of these periods is irregular. To validate
the detection of such events, it was used one FSR
(Force Sensitive Resistor) under the right heel,
attached to the shoe, to measure these events.
After detecting both events, some gait
parameters can be calculated. The gait cycle is
divided in two phases – stance and swing. The
majority of the gait cycle is spent in stance phase
(60%) and the rest in swing phase (40%). The stance
phase corresponds to the moment that the foot is in
contact with the ground. The swing phase is the
period during which the leg is out of the ground,
moving to the next strike. Thus, stance phase begins
with HS event and finishes with TO event. Swing
phase begins with TO and finishes with HS. Once
stance and swing phases are detected, stride time,
cadence, average velocity and step length gait
parameters can be calculated. These parameters were
calculated as in (Sabatini et al. 2005; Henriksen et
al. 2004).
2.3.2 Assessment of the Fall Risk
The evaluation of the risk of falling of the subject is
reached by an accelerometer attached to the trunk.
All the processing applied in these signals is adapted
from (Doheny et al. 2012). A band-pass filter of fifth
order between 0.1-10Hz filters the signals, to restrict
the signal. Then, to obtain the displacements of the
subject’s COM the acceleration signals are double
integrated, using a trapezoidal method. The error
associated to the integration (low frequency drift) is
reduced by subtracting the mean of the acceleration
signals before and after each integration, and then
implementing a second-order polynomial fit and a
high-pass filter of fifth order to 0.1Hz.
These signals enable to determine the Root Mean
Square (RMS) for AP and ML directions, sway
range AP and Ml and horizontal displacement of the
COM (Dhor), given by,
(10)
where dML and dAP are obtained after both
integrations and correspond to the displacements in
AP and ML directions, respectively. Then, it is
ICINCO2014-11thInternationalConferenceonInformaticsinControl,AutomationandRobotics
790
calculated the horizontal displacement of the COM.
These parameters enable to assess the risk of falling
of the patient.
2.3.3 Statistical Analysis
For each parameter the mean and standard deviation
was calculated. Then, a Student’s t-test was
performed to compare the results obtained with the
crutches and standard walker with the RFS. The
level of significance was set to p<0.05.
3 RESULTS
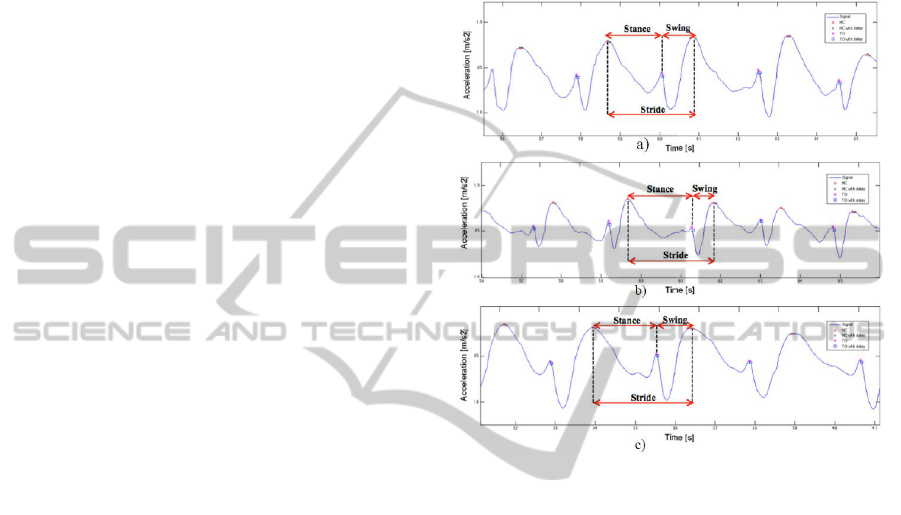
Figure 4 show portions of the signals of one of the
patients with the crutches, standard walker and RFS,
acquired with the accelerometer attached to the
ankle. As mentioned before, it was used one FSR to
validate the detection of the gait events. The FSR
detects 60ms and 30ms earlier the HS and TO
events, respectively. In the three graphs, it is
indicated, by different markers, both the instants of
HS and TO detected by the accelerometer and by the
FSR. It is also identified some of the gait parameters
determined in the study. Figure 5 a and b are a
portion of the AP and ML accelerations of the trunk,
respectively, with each AD, acquired by the
accelerometer placed at the sacrum. It is
discriminated the AP and ML accelerations. Table 1
presents the mean and standard deviation of each
parameter for 7 patients for the three ADs. As one
can see in Table 1, the values of p-values less than
0.05 were obtained for the same parameters among
the different ADs (stride and stance time, velocity,
cadence and sway range ML). Relatively to the
values, the crutches provide the higher stride, stance,
swing time and step length. The RFS has the lower
values for these parameters, except for the velocity
and cadence. Considering the values acquired by
(Martins et al. 2013) with a similar RFS, but with
laser sensor, for the same diagnosis, one can see that
they have obtained similar values.
In terms of the parameters obtained by the
accelerometer at the trunk, all of them were greater
for the crutches and smaller for the RFS, except for
the RMS AP.
4 DISCUSSION
The goal addressed in this work is to detect
differences between the ADs for the assisted gait.
Hence, the gait parameters are studied in order to
verify which are most affected in patients with
KOA, relatively to gait events and fall risk.
Furthermore, it is intended to verify and validate if
the data extracted from the accelerometer is able to
detect gait events in assisted-gait. As it can be seen
in figure 4 for each gait cycle it is possible to
observe two peaks (HS and TO).
Figure 4: Portion of the signals of the ankle of a patient
walking with a) crutches b) standard walker and c) RFS.
The x-axis and y-axis correspond to the time and
acceleration, respectively. The red triangle and the black
cross correspond to HS and HS with delay, respectively.
The rose star and blue square are relative to the TO and
TO with delay. These graphics are in accordance to (Lee
et al. 2010).
For the assisted gait with crutches, standard walker
and RFS, the moment of HS occur at t=58.5s,
t=59.7s and t=34.0s and TO at t=60.1s, t=61.3s and
t=35.5s, respectively. This means that for each gait
cycle and for each device, it can be detected the time
that the foot contacts the ground and the time that it
leaves the ground, respectively. Hence, with the
identification of these two events, it is possible to
determine the desired gait parameters. The recorded
signals for walking trials are very similar to those
presented in the literature for free walking (Lee et al.
2010). Therefore, it was reasonable to take into
account these signals for further analysis.
Thus, it can be concluded that accelerometers
can effectively be used in the gait analysis of
assisted gait since they verify a relationship between
the measured acceleration signal and gait events.
By observation of Table 1, comparing the stance
DetectionofGaitEventsandAssessmentofFallRiskUsingAccelerometersinAssistedGait
791
Figure 5: Portion of the signals a) AP and b) ML of the
trunk for one patient. The first, second and third for each
graph, correspond to crutches, standard walker and RFS,
respectevely.
Table 1: Devices used and calculated parameters. The
mean and the standard deviation for the parameters for
assisted gait with the three ADs are listed. The values
between brackets correspond to the percentage of the gait
cycle. D:Device, P:Parameters, Cr:Crutches, p:p-value,
SW:Standard Walker, ST:Stride Time, SgT:Swing Time,
StT:Stance Time, C:Cadence, v:Velocity, SL:Step Length,
DC:Displacement COM, R AP:RMS AP, R ML:RMS ML,
SR AP:Sway Range AP, SR ML:Sway.
D P Cr p SW p RFS
Acc.(Ankle)
ST (s)
4.39 1.99
0.03
3.73 1.12
0.01
2.65 0.66
SgT
(s)
1.42 0.53
(32.35%)
0.22
1.21 0.57
(32.44%)
0.65
1.12 0.31
(42.26%)
StT
(s)
2.93 1.56
(67.65%)
0.03
2.51 0.59
(67.56%)
0.005
1.47 0.67
(57.74%)
Camera
C
(step/
min)
25.76
13.86
0.008
30.59
10.16
0.002
43.35
14.12
v
(m/s)
0.11
0.05
0.02
0.09
0.04
0.004
0.20 0.03
SL
(m)
0.31
0.10
0.26
0.29
0.18
0.96
0.29 0.09
Acc.(Trunk)
DC
(m)
1.17
0.49
0.13
0.69
0.19
0.57
0.52 0.28
R AP
(m/s
2
)
0.69
0.24
0.49
0.49
0.08
0.56
0.61 0.29
R ML
(m/s
2
)
0.48
0.34
0.42
0.40
0.10
0.16
0.32 0.06
SR
AP
(m)
1.95
1.25
0.21
1.14
0.30
0.62
0.89 0.56
SR
ML
(m)
1.080.13
0.01
0.770.18
0.007
0.52 0.17
and swing percentages for the crutches, standard
walker and RFS, one can see that the stance phase is
67.65%, 67.56% and 57.74% and the swing phase is
32.35%, 32.44% and 42.26%, respectively.
Considering that normal free gait is characterized by
having 60% of stance phase and 40% of swing phase
(Vaughan et al. 1999), the results obtained with
RFS are the more approximated to these normal
values. The stance (58.06%) and swing (41.92%)
phases percentage are similar to the ones obtained
by Martins et al. (2013) and they justified these
values by the fact that these patients are better
supported by the RFS, and they feel less pain when
loading the affected joint, allowing to perform a
more natural gait. The greater swing phase
percentage with the RFS, relatively to the others
ADs, could be explained by the existence of the
forearm supports, which provide a greater support.
Relatively to the stance phase percentage, it was
verified a decrease with the RFS, comparatively to
the others ADs. Since impaired gait and/or fear of
falling usually results in an increase of stance time
(Kloos et al. 2012), this result shows that the RFS
offered excellent support and stability for the user,
by increasing his sense of security relatively to the
others ADs. The crutches produced the greater stride
time and, consequently, greater stance and swing
time, relatively with the others ADs, which is good,
because it means that the patient spent more time
with the leg, that has the knee injured, in the ground
– stance phase. On the other side, the RFS the lower
values for the stride, stance and swing time, because
of the continuous movement of the subject with this
device. The value of the velocity for assisted gait for
the patients is lower than for the healthy (Martins et
al. 2013). Considering our values, the standard
walker shows the lower value for velocity. This may
be explained because, to walk with this device, the
patient has to stop, lift the AD and move forward,
performing an unnatural gait. On the other side, the
RFS has the higher values for velocity and cadence.
So, this device is the nearest to the healthy and can
be explained by the continuous movement of the
subject with the RFS.
Finally, the step length is almost identical for the
ADs, so devices preserve this feature. The little
increase of the step length for the crutches may be
reached by the fact that these patients have already
walked with crutches before this study.
In terms of the evaluation of the fall risk, in
(Kloos et al. 2012) it is mentioned that the
variability is an indicator of fall risk, which means
that the increase of variability increases the risk of
fall. Thus, the variability of the stride, stance and
swing time (Table 1) was analysed in this study for
further fall risk analysis. As one can see, the
standard deviation is lower for the gait with the RFS
than the others ADs. Therefore, it can be verified
that the RFS provides a greater stability for the
patient. Relatively to the parameters obtained by the
ICINCO2014-11thInternationalConferenceonInformaticsinControl,AutomationandRobotics
792

accelerometer at the trunk, it is known that the
greater they are, the greater is the risk and trend of
fall (Doheny et al. 2012). In Table 1, it is shown that
the crutches present the higher values, so these
devices are of higher risk to the user and the RFS
produced the lower values, except for RMS AP.
Considering the AP signal, it corresponds to the
forward and backward movement of the trunk. One
can see in Figure 5 a) that for the three devices the
signal is positive, meaning that the trunk is leaning
forward when the patient walks. However, the signal
is much higher for the RFS than the others ADs.
This happens because the RFS has to be pushed and
by observation of the authors, users had to lean
forward while pushing this device. This factor can
be due to an incorrect walker height adjustment.
Thus, the AP signal can be an important indicative
for posture correction as well as walker height
adjustment. Therefore, further studies will be
conducted to evaluate this potential clinical
indicator. In terms of ML signal in Figure 5 b), the
RFS presented the lower values, relatively to the
other ADs. The ML movement is a little attenuated
by the RFS and this happens because the user is
supported by the forearm support of RFS, preventing
the trunk oscillation in this direction.
Finally, relatively to the variability of the signals
of the trunk, it is shown in Table 1, that crutches
present a higher standard deviation for all of the
parameters, except for the sway range ML and RMS
AP. The first is higher for the standard walker. The
latter is higher for the RFS as expected, because of
the leaning of the trunk to the front.
To conclude, the authors see the RFS as the best
device for these patients since it provides higher
stability to the users, less risk of fall, a more natural
gait and a continuous movement.
5 CONCLUSION
This work used accelerometers located at the injured
leg’s ankle and trunk to verify and validate the
association between the accelerations signals and the
gait events, detect gait parameters and assess the fall
risk in assisted-gait with crutches, standard walker
and RFs. Further, it was possible to determine
efficiently all the proposed gait parameters in all
devices with patients diagnosed with KOA.
Additionnaly, it can be verified that the RFS
provides a greater stability, reducing the risk of fall
and inducing a more natural gai performance.
ACKNOWLEDGEMENTS
This work has been supported by FCT – Fundação
para a Ciência e Tecnologia in the scope of the
project: PEst-OE/EEI/UI0319/2014.
REFERENCES
Debi, R. et al., 2011. Correlation between single limb
support phase and self-evaluation questionnaires in
knee osteoarthritis populations. Disability and
rehabilitation, 33(13-14), pp.1103–9.
Doheny, E. P. et al., 2012. Displacement of centre of mass
during quiet standing assessed using accelerometry in
older fallers and non-fallers. Annual International
Conference of the IEEE Engineering in Medicine and
Biology Society. 2012, pp.3300–3.
Elbaz, A. et al., 2012. Can single limb support objectively
assess the functional severity of knee osteoarthritis?
The Knee, 19(1), pp.32–5.
Henriksen, M. et al., 2004. Test – retest reliability of trunk
accelerometric gait analysis. Gait & Posture, 19,
pp.288–297.
Kaufman, K. R. et al., 2001. Gait characteristics of
patients with knee osteoarthritis. Journal of
biomechanics, 34(7), pp.907–15.
Kloos, A. et al., 2012. The impact of different types of
assistive devices on gait measures and safety in
Huntington’s disease. PloS one, 7(2), p.e30903.
Lee, J.-A. et al., 2010. Portable activity monitoring system
for temporal parameters of gait cycles. Journal of
medical systems, 34(5), pp.959–66.
Martins, M. et al., 2013. Assessment of walker-assisted
human interaction from LRF and wearable wireless
inertial sensors. In Internation Congress on
Neurotechnology, Electronics and Informatics.
Neurotechnix. pp. 1–8.
Mathie, M. J. et al., 2004. Accelerometry: providing an
integrated, practical method for long-term, ambulatory
monitoring of human movement. Physiological
Measurement, 25(2), pp.R1–R20..
Sabatini, A. M. et al., 2005. Assessment of Walking
Features From Foot Inertial Sensing. IEEE transactions
on bio medical engineering, 52(3), pp.486–494.
Vaughan, C., Davis, B. & Connor, J. C. O., 1999.
Dynamics of Human Gait 2nd ed. C. Vaughan, ed.,
Cape Town, South Africa: Kiboho Publishers.
Watanabe, T. et al., 2011. A preliminary test of
measurement of joint angles and stride length with
wireless inertial sensors for wearable gait evaluation
system. Computational intelligence and neuroscience,
2011, p.975193.
DetectionofGaitEventsandAssessmentofFallRiskUsingAccelerometersinAssistedGait
793
