
Exploratory Analysis of Ventilation Signals from Resuscitation Data of
Newborns
Huyen Vu
1
, Trygve Eftestøl
1
, Kjersti Engan
1
, Joar Eilevstjønn
2
, Jørgen E. Linde
3,5
and Hege Ersdal
4,5
1
Department of Electrical Engineering and Computer Science, University of Stavanger, Stavanger, Norway
2
Strategic Research, Laerdal Medical AS, Stavanger, Norway
3
Department of Pediatrics, Stavanger University Hospital, Stavanger, Norway
4
Department of Anesthesiology and Intensive Care, Stavanger University Hospital, Stavanger, Norway
5
Department of Health Sciences, University of Stavanger, Stavanger, Norway
Keywords:
Ventilation Signal Processing, Therapeutic Parameters, Newborns, Statistical Significance Test, P-value,
Exploratory Data Analysis Framework.
Abstract:
Prevention of neonatal mortality and morbidity because of birth asphyxia is still a major challenge. In a
non-breathing baby, resuscitation including manual ventilation should start within one minute after birth. In-
formation extracted from ventilation signals might give a good indication of the effectiveness of therapy. A
framework for exploratory data analysis was developed facilitating the development of signal parameters to
identify the relationships between certain signal characteristics and various outcome groups. Low p-values
found for some ventilation parameters indicates that the method presented could be useful in discovering fac-
tors and parameters that might be important for the outcome of ventilation therapy and for guiding further
treatment.
1 INTRODUCTION
In an asphyxiated infant, positive pressure ventilation
should commence within 1 minute after birth accord-
ing to the International Liaison Committee on Resus-
citation guidelines for neonatal resuscitation (ILCOR,
2010). Ventilation of newborns is challenging be-
cause it is time critical and involving complicated in-
teractions between newborn pathophysiology and the
clinical treatment. Determining beneficial character-
istics of different ventilation parameters is necessary
for clinicians in order to improve neonatal treatment
and survival.
Five ventilation parameters were derived from bag
mask ventilation pressure and flow signals. The hy-
pothesis is that certain characteristics of these ven-
tilation parameters could relate to specific neonatal
conditions and improvement in outcome and thus be
useful for guiding further treatment. “Apgar score”
is an universal scoring system to evaluate the clini-
cal status of the baby after birth, usually performed
at 1, 5, 10 and 20 minutes. The evaluation is based
on five subjective factors: Appearance (skin color),
Pulse (heart rate), Grimace response (or reflex irri-
tability), Activity and muscle tone, and Respiration
(breathing rate and effort). Each factor is scored on a
scale from 0 to 2 (the best score). Thus, the total score
is from 0 to 10. The 1-minute score reflects the im-
mediate condition of the baby after birth, whereas the
5-minute score shows how the cardio-respiratory tran-
sition from intrauterine to extrauterine life progresses.
In this exploratory study, the change in Apgar score
from 1 minute to 5 minutes is used as the measure of
effectiveness of ventilation. An improved score for
an asphyxiated baby, implies a positive response to
the ventilation given and vice versa.
The International Liaison Committee on Resus-
citation and the World Health Organization provide
healthcare workers with guidelines for neonatal re-
suscitation (ILCOR, 2010; WHO, 2011). However,
the optimal values of pressure, volume and frequency
during positive pressure ventilation of newborns are
still unclear although research is growing in this field
(Perlman et al., 2012). The interaction between me-
chanical ventilation parameters and the physiology of
the lungs has been investigated, concluding that it was
difficult to select an effective respirator setting be-
cause the results were highly dependent on the char-
12
Vu H., Eftestøl T., Engan K., Eilevstjønn J., E. Linde J. and Ersdal H..
Exploratory Analysis of Ventilation Signals from Resuscitation Data of Newborns.
DOI: 10.5220/0005176800120020
In Proceedings of the International Conference on Bio-inspired Systems and Signal Processing (BIOSIGNALS-2015), pages 12-20
ISBN: 978-989-758-069-7
Copyright
c
2015 SCITEPRESS (Science and Technology Publications, Lda.)

acteristics of the newborns population (Ramsden and
Reynolds, 1987). Software systems to extract ventila-
tion parameters and to provide decision support dur-
ing mechanical ventilation has been previously stud-
ied (Ciurea et al., 2011; Tehrani, 2011; Schulze et al.,
1984). However, very little research is done to un-
derstand the different initial situation of manual posi-
tive pressure ventilation during resuscitation at birth.
In this previous group work (Vu et al., ), we have
analysed ECG signal from the novel Laerdal New-
born Resuscitation Monitor (LNRM) developed by
Laerdal Global Health to investigate effects of venti-
lation parameters during initial resuscitation on heart
rate changes.
In this work, by using signal analysis of wave-
forms in the recorded biophysical signals, we detect
and parameterize events defined as inflations from the
start of pressing the bag to the end of exhalation. Fur-
thermore we propose a data explorative approach to
identify ventilation parameters which might be deter-
minant for beneficial neonatal outcome.
2 MATERIALS AND METHODS
2.1 Dataset
This exploratory analysis is based on data from the
“Safer Births” project at Haydom Lutheran Hospital
in Northern Tanzania. Haydom is a resource lim-
ited rural hospital with a great shortage in health care
staff. During the study period, basic newborn re-
suscitations (i.e. stimulation, suction, and bag mask
ventilation) and Apgar scoring were predominantly
conducted by midwives, always observed by trained
research assistants recording the findings on a data
collection form. The implementation of the research
project was approved by National Institute for Medi-
cal Research (NIMR) in Tanzania and Regional Com-
mittee for Medical and Health Research Ethics (REK)
in Norway.
The Laerdal Newborn Resuscitation Monitor
(LNRM) is a resuscitation monitor designed for re-
search use in low resource settings where newborn
resuscitations usually are performed by a single care
provider. The whole set up is presented in figure 1.
LRNMs were employed in the labour ward of
Haydom to measure various physiological data such
as ECG signals through dry-electrode ECG measured
on the thorax, CO
2
concentration, airway pressure
and flow signals. ECG signal was sampled at 500
Hz, CO
2
signal was sampled at 20 Hz, pressure and
flow signals were sampled at 100 Hz. A flow-sensor
(Acutronic Medical Systems AG) is arranged between
the face mask and the resuscitator bag. The air-
way adapter also connects two plastic tubes with the
LNRM: one tube draws a small sample of exhaled air
(50 ml/min) for standard CO
2
measurement (Masimo
Sweden AB), and one tube is used for standard pres-
sure measurement.
The dataset contains recording of 218 infants col-
lected between July 2013 to June 2014 with complete
signals. Quality control and management of all re-
search data were performed on a daily basis by local
research staff.
2.2 Processing and Parameterization of
Ventilation Signals
To characterize the ventilations given by healthcare
workers, we detected bag-mask ventilation events by
using two signals: the airway pressure and the flow
signals from the ventilation sensors. We define five
ventilation parameters: average ventilation frequency,
average peak inspiratory pressure (PIP), average ex-
pired volume, initial peak inspiratory pressure, and
ventilation time percentage (the percentage of time of
ventilation sequences in the total time of ventilation
including pauses).
Airway Pressure Signal
In this paper, the term “ventilation event” corresponds
to pressing the ventilation bag. The start of one ven-
tilation event is detected when the value of pressure
increases from baseline then exceeds a threshold of 5
mbar. The PIP of each ventilation event is the maxi-
mum value of the pressure signal as illustrated in fig-
ure 2.
A “pause” is defined as the period of time when
the pressure signal value is lower than 5 mbar for
more than 3 seconds. A “ventilation sequence” rep-
resents several continuous ventilation events without
pauses. This is explained in the figures 3 and 4. The
“total ventilation time” is the time from the first to
the last ventilation event including pauses as shown
in figure 5. Among the five ventilation parameters,
four of them are derived from the pressure signal and
can be described as follows:
• The average ventilation frequency ( f
v
av
) is the ra-
tio of total number of ventilation events (n
v
i
) over
the sum of duration of each ventilation sequence
(t
i
). This parameter represents how fast healthcare
workers press the ventilation bag.
f
v
av
=
∑
i
n
v
i
∑
i
t
i
(1)
ExploratoryAnalysisofVentilationSignalsfromResuscitationDataofNewborns
13
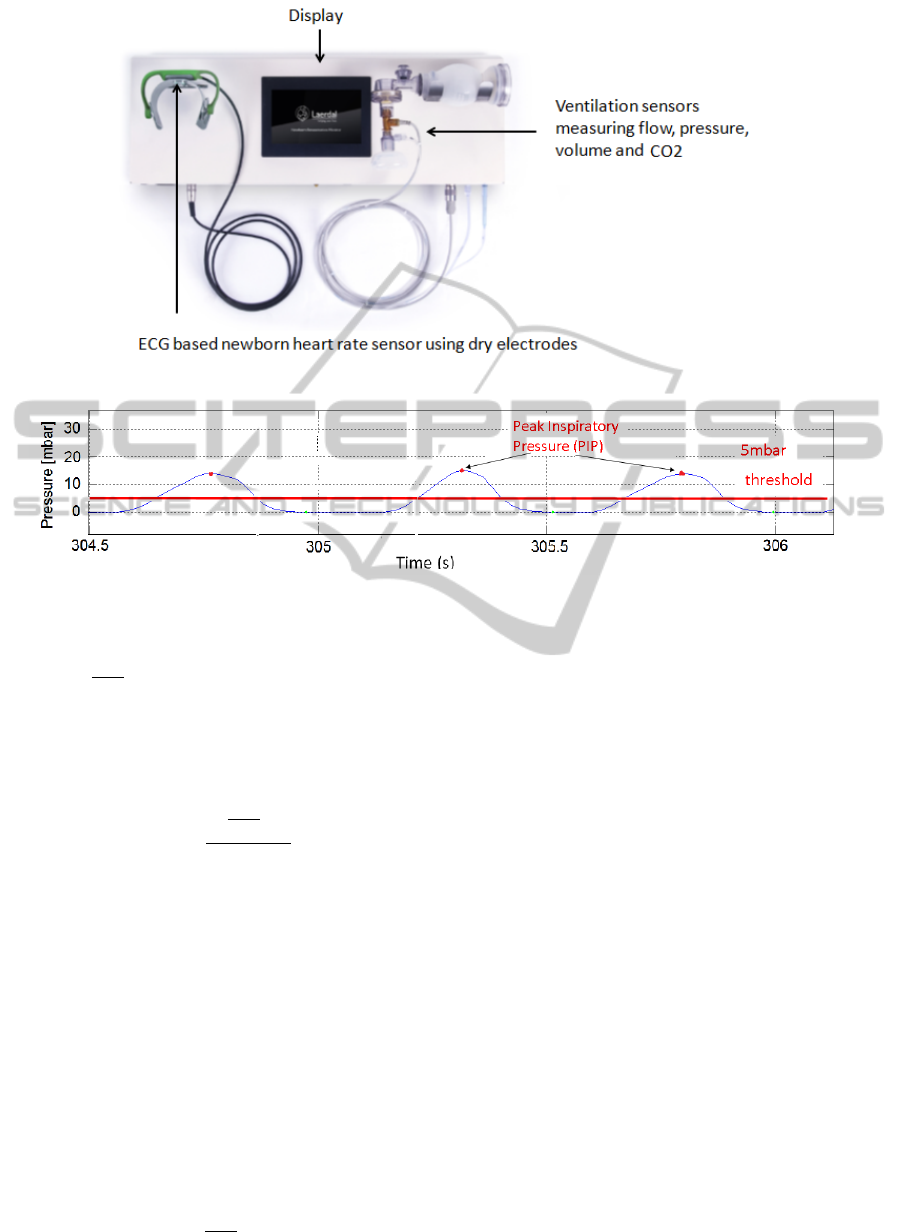
Figure 1: Laerdal Newborn Resuscitation Monitor.
Figure 2: Pressure signal - Detection of ventilation event and PIP.
• The average PIP (PIP
av
) is the “weighted aver-
age” of mean values of PIPs of ventilation se-
quences (PIP) where the weight is the duration of
each ventilation sequence (t
i
), which means that
the long sequences dominate to the PIP
av
more
than the short sequences. This parameter shows
the average peak inspiratory pressure applied for
ventilation.
PIP
av
=
∑
i
PIP
i
∗t
i
∑
i
t
i
(2)
• Initial peak inspiratory pressure (PIP
init
) is the
first average PIP value of the first ventilation se-
quence that has the duration longer than 0.5 sec-
ond. This parameter represents the initial peak in-
spiratory pressure to open the lung.
• Ventilation time percentage (V T
PRC
) is the per-
centage of sum of duration of all ventilation se-
quences in the total ventilation time (T
v
). This pa-
rameter shows the percentage of time the rescuer
spending on ventilation during the whole venti-
lation procedure. For example, V T
PRC
= 60 %
means that 60 % of the total ventilation time is
spent for ventilation effort and 40 % of time could
be used for other resuscitation methods.
V T
PRC
=
∑
i
t
i
T
v
∗ 100% (3)
Volume Waveform
The volume waveform is integrated from the flow sig-
nal which is measured by the hot-wire flow sensor
(Acutronic Medical Systems AG). The expired vol-
ume is the amount of air going back through the flow
sensor after one inflation. The expired volume is the
volume drop from the maximum value to zero or to a
non zero value when there is mask leakage. The aver-
age expired volume (ExV
av
) is the mean of all expired
volume values. Figure 6 shows one inflation cycle.
2.3 Statistical Approach
We want to investigate if certain patterns of these pa-
rameters show association with specific neonatal out-
comes (e.g.,improved Apgar score from 1 to 5 min-
utes) when comparing different groups of babies. P-
value method for statistical significance test among
groups of babies were calculated by using Wilcoxon
rank-sum testing in Matlab which is a non-parametric
method for non-normal distributed data. P-values
from the significance tests are used to represent the
discriminative capability of different ventilation pa-
rameters. The criteria for grouping patients is based
on delta Apgar score (∆AP) which is the change from
Apgar score at 1 minute (AP1) to Apgar score at 5
BIOSIGNALS2015-InternationalConferenceonBio-inspiredSystemsandSignalProcessing
14
Figure 3: Pressure signal - Two consecutive ventilation sequences.
Figure 4: Pressure signal - One continuous ventilation sequence.
Figure 5: Total ventilation time is the duration from the first ventilation event to the last one.
minutes (AP5) defined in equation 4.
∆AP = AP5 − AP1 (4)
Group 1 has ∆AP <= threshold and group 2 has ∆AP
> threshold. Therefore, group 2 is considered to be
the improved group (or the group with positive out-
come). For example, if the Apgar score at 1 minute
and Apgar score at 5 minute of a baby are 3 and 7 re-
spectively, then the ∆AP is 4. And if the threshold is
2, then the baby is categorized into group 2. A low
p-value implies the difference in medians of the two
groups and that the corresponding ventilation param-
eter could have important effect on the result of the
treatment (i.e. improvement in Apgar scoring from 1
minute to 5 minutes).
2.4 Proposed Framework for Data
Exploration
Evaluation Criteria for the Effectiveness of
Ventilation during Resuscitation
We use ∆AP (equation 4) as a criteria to evaluate the
effectiveness of the ventilation effort. For a low p-
value, ∆AP above a threshold might indicate an ap-
propriate resuscitation whereas ∆AP equal or below a
threshold could imply an ineffective one.
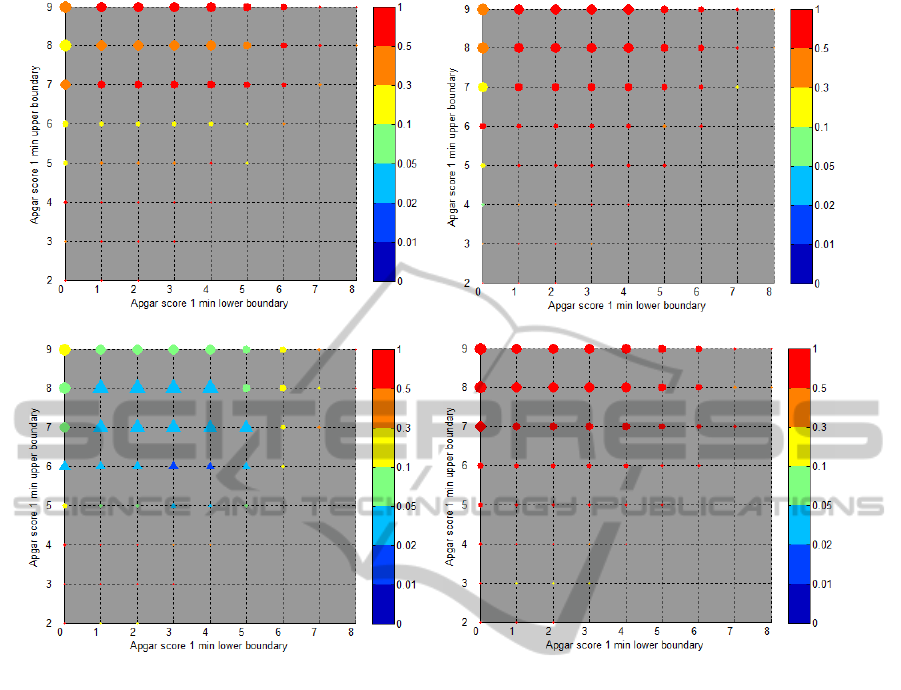
Grid of P-values
To see how the medians of ventilation parameters af-
fect various subsets of patients with different starting
conditions, the data were segmented based on Apgar
score at 1 minute. A grid of p-values is defined as a
plot where x (Apgar score at 1 minute lower bound-
ary) and y (Apgar score at 1 minute upper boundary)
axes define the range of the Apgar score at 1 minute
and colors represent different p-values. Each point
on the grid corresponds to a subset of patients having
the Apgar score at 1 minute in the range indicated by
the two axes of the grid (Apgar score at 1 min lower
boundary, Apgar score at 1 min upper boundary). For
example, the coordinate (x = 3, y = 8) includes a sub-
set of babies having Apgar score 1 minute in the range
from 1 (lower boundary) to 8 (upper boundary). This
subset of patients is categorized into two groups ac-
cording to their ∆AP values. We compute the p-value
of each subset to test the difference in medians of the
ExploratoryAnalysisofVentilationSignalsfromResuscitationDataofNewborns
15
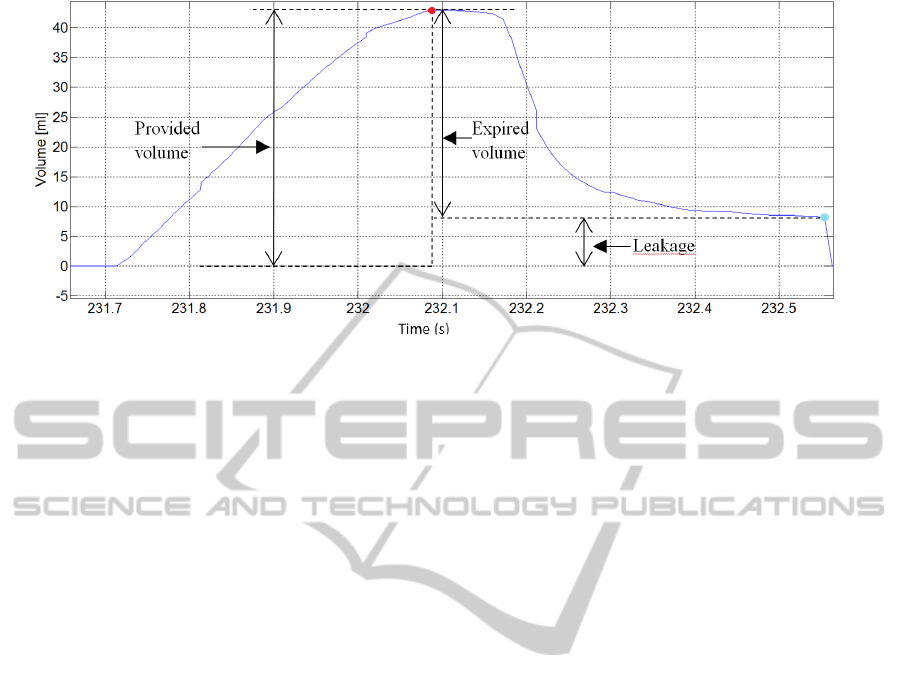
Figure 6: Volume waveform of one inflation cycle.
two groups defined by a threshold value of ∆AP. The
p-value is assigned a color value by using a color map.
The low p-values (< 0.05) are illustrated as triangles
otherwise as circles. Group 2 is the improved group
with higher ∆AP, thus we illustrate the relative differ-
ence between the median value of group 2 (the group
with the positive outcome) compared to group 1 (the
group with the negative outcome) by using upward
and downward triangles. The upward triangles repre-
sent the higher median value of group 2 compared to
group 1 and vice versa. For example, if the p-value is
low (< 0.05) and group 2 has a higher median value
than group 1, the corresponding point in the grid is
represented by an upward triangle, otherwise a down-
ward triangle. The size of each point on the grid is
proportional to the number of patients in the smallest
group, thus illustrating the size of data used for statis-
tical testing. For example, group 1 has 34 patients and
group 2 has 45 patients, then the size of the circle or
the triangle is proportional to the size of group 1 that
has the smaller number of patients.
3 EXPERIMENT AND RESULTS
To find an appropriate threshold value of ∆AP for our
experiment, a histogram representing number of pa-
tients with different Apgar score at 1 minute and Ap-
gar score at 5 minutes is shown in figure 7.
The blue diagonal line on the histogram represents
the ∆AP equal to 0 since the Apgar score at 5 minutes
is equal to Apgar score at 1 minute. The line also sep-
arates the histogram into two parts: the left one with
∆AP > 0 (Apgar score at 5 minutes > Apgar score
at 1 minute) and the right one with ∆AP < 0 (Apgar
score at 5 minutes < Apgar score at 1 minute). The
lines parallel with the main diagonal represent differ-
ent ∆AP thresholds and this is a visualization of how
threshold values separate our data into groups with
positive outcome and negative outcome. We experi-
mented with ∆AP = 2 and ∆AP =3 to ensure that the
number of babies in each group was sufficiently large.
Each ventilation parameter has two p-value grids cor-
responding to these different threshold values of ∆AP.
Figure 8a is the p-value grid of PIP
av
using ∆AP = 2
and figure 8b is the corresponding box plots of the
red-circled point in the grid (the color bar next to the
p-value grid represents ranges of p-values). The num-
ber on each box plot represents the number of babies
in each group. The box plots show the difference in
medians of two outcome groups, specifically, group 2
has the lower median value of PIP
av
.
Figures 9 and 10 show p-value grids for other ven-
tilation parameters with ∆AP = 2 and ∆AP = 3 re-
spectively.
4 DISCUSSION
P-values below significance level (0.05) were found
for some ventilation parameters: average peak in-
spiratory pressure (PIP
av
), average expired volume
(ExV
av
), and ventilation time percentage (V T
PRC
)
when comparing different thresholds of ∆AP scores.
In the p-value grids, points in the top left corner usu-
ally have no low p-values. There could be two rea-
sons: one is that for these points we include a wide
range of patients or the diversity of the samples are
high therefore there is no big difference in medians.
The other reason may be that babies born with a high
Apgar score will improve independently of perfor-
mance of ventilation. For points in the left bottom of
the grid that correspond to severely asphyxiated ba-
bies at birth, there are no low p-values either. Effec-
BIOSIGNALS2015-InternationalConferenceonBio-inspiredSystemsandSignalProcessing
16
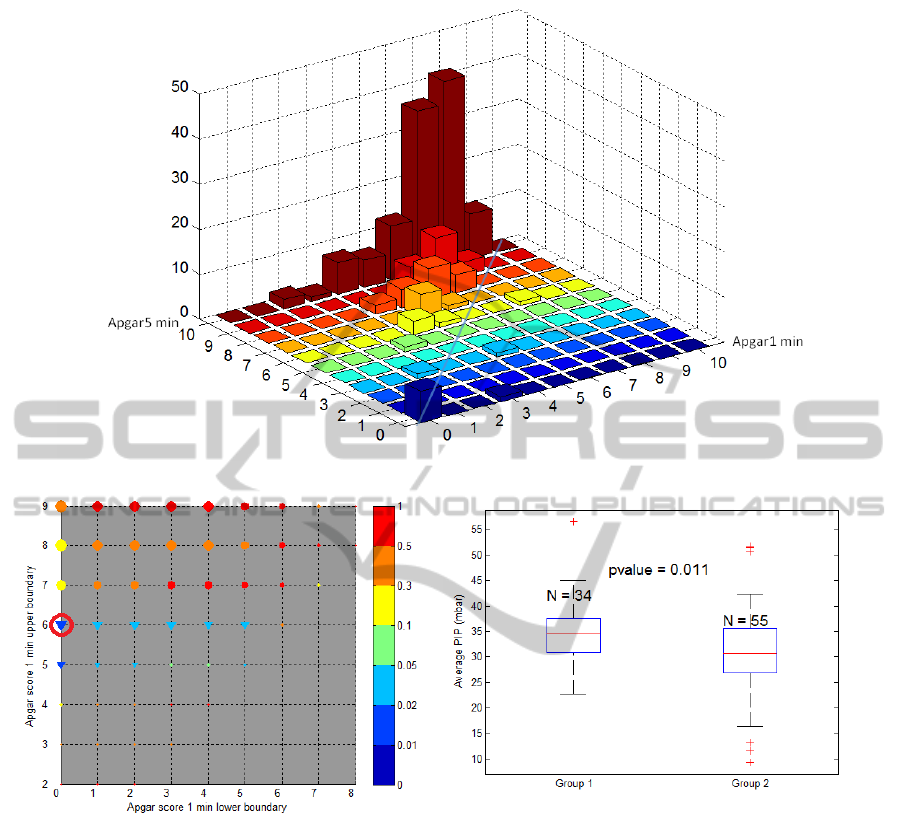
Figure 7: Histogram of distribution of data for Apgar score at 1 minute and 5 minutes.
(a) (b)
Figure 8: (a) P-value grid for average PIP (PIP
av
), ∆AP threshold = 2. The low p-values (< 0.05) are illustrated as triangles
otherwise as circles. The upward-pointing triangles indicate the higher medians and the downward-pointing triangles indicate
the lower medians of group 2 (the improved group with higher ∆AP) in comparison with group 1. The size of each point
in the grid is proportional to the minimum number of patients between two groups. (b) Box plot for the red-circled point
corresponding to a subset of patients having Apgar score 1 minute in the range indicated by the coordinate of that point in the
grid (Apgar score 1 minute ranging from 0 to 6). P-value obtained from statistical significance test on PIP
av
for this subset
is 0.011. The median value of group 2 (including infants in that subset having ∆AP > 2) is 30.68, which is lower than the
median value 34.51 of group 1 (infants with ∆AP <= 2), thus the downward-pointing triangle is used.
tive bag mask ventilation (opening of functional resid-
ual capacity) maybe more difficult in these babies and
ventilations alone might not be sufficient to improve
outcome. In this low-resourced setting, cardiac com-
pression, intubation, and intravenous medication are
not performed. In our exploratory data, we find low p-
values indicating different medians of ventilation pa-
rameters more often in the middle range (not very low
and not very high) of Apgar score at 1 minute.
This exploratory test suggests that infants with a
low Apgar at 1 minute who improved to a higher Ap-
gar score at 5 minutes have a lower median value of
ventilation time percentage (V T
PRC
). This could pos-
sibly be explained by that the importance of stimula-
tions was not included in the analysis. Therefore, this
interpretation needs to be further explored by integrat-
ing information about stimulation effort into V T
PRC
parameter in future work.
The explorative nature of this analysis imposes a
limitation that should be noted. As the number of
ExploratoryAnalysisofVentilationSignalsfromResuscitationDataofNewborns
17
(a) (b)
(c) (d)
Figure 9: ∆AP = 2. (a) P-value grids for initial PIP (PIP
init
). (b) P-value grids for ventilation frequency ( f
v
av
). (c) P-value
grids for average expired volume (ExV
av
). (d) P-value grids for ventilation time percentage (V T
PRC
).
groups tested are exhaustive, it is expected that some
of the low p-values might have appeared by chance.
The intent of the analysis is to identify ventilation pa-
rameters to investigate further in future studies.
5 CONCLUSIONS AND FUTURE
WORK
In this paper, we illustrate a way to process ventila-
tion signals from bag-mask ventilations recorded in
a Newborn Resuscitation Monitor, define ventilation
parameters and propose a framework for data explo-
ration. We reveal the possibility of using information
extracted from ventilation signals related to improved
Apgar scoring to potentially describe beneficial value-
ranges of different ventilation parameters.
Some ventilation parameters such as average peak
inspiratory pressure (PIP
av
), average expired vol-
ume (ExV
av
), and ventilation time percentage (V T
PRC
)
were identified by the analysis. These findings might
indicate that these parameters could be determinant
factors for beneficial positive pressure ventilation. As
this is a study using exploratory data analysis, the
findings needs to be further investigated by using new
data.
For future work, this framework of data analysis
could be extended to test the discriminative capability
of different ventilation parameters with other outcome
definitions as well. We might also count the stimula-
tion time as the ventilation time when we derive the
ventilation time percentage (V T
PRC
) parameter. There
is also a possibility to combine some ventilation pa-
rameters to investigate their effect altogether on the
resuscitation outcome.
REFERENCES
Ciurea, B. M., Palade, D., and Kostrakievici, S. (2011).
Lung ventilators parameters determination. U.P.B.
Sci. Bull.
ILCOR (2010). Neonatal resuscitation: 2010 interna-
BIOSIGNALS2015-InternationalConferenceonBio-inspiredSystemsandSignalProcessing
18

(a) (b)
(c) (d)
(e)
Figure 10: ∆AP = 3. (a) P-value grids for initial PIP (PIP
init
). (b) P-value grids for ventilation frequency ( f
v
av
). (c) P-value
grids for average expired volume (ExV
av
). (d) P-value grids for ventilation time percentage (V T
PRC
). (e) P-value grids for
average PIP (PIP
av
).
tional consensus on cardiopulmonary resuscitation
and emergency cardiovascular care science with treat-
ment recommendations. Resuscitation.
Perlman, J., Kattwinkel, J., and Wyllie, J. (2012). Neonatal
resuscitation: in pursuit of evidence gaps in knowl-
edge. Resuscitation.
Ramsden, C. A. and Reynolds, E. O. (1987). Ventilator
settings for newborn infants. Archives of Disease in
Childhood.
Schulze, K., Stefanski, M., Soulos, T., Masterson, J., Kim,
Y. I., and Rey, H. R. (1984). Computer analysis of
ventilatory parameters for neonates on assisted venti-
lation. Engineering in Medicine and Biology Maga-
zine, IEEE, 3(3):31–33.
ExploratoryAnalysisofVentilationSignalsfromResuscitationDataofNewborns
19

Tehrani, F. (2011). Efficient Decision Support Systems -
Practice and Challenges in Biomedical Related Do-
main, chapter Computerized Decision Support Sys-
tems for Mechanical Ventilation. ISBN: 978-953-307-
258-6.
Vu, H., Eftestøl, T., Engan, K., Eilevstjønn, J., Linde, J.,
and Ersdal, H. Analysis of heart rate changes in new-
borns to investigate the effectiveness of bag-mask ven-
tilation. In Proceedings of Computing in Cardiology
conference 2014 (To be published).
WHO (2011). Guidelines on basic newborn resuscitation.
WHO Library Cataloguing-in-Publication Data.
BIOSIGNALS2015-InternationalConferenceonBio-inspiredSystemsandSignalProcessing
20
