
Visualization of Passively Extracted HL7 Production Metrics
Ricardo Ferreira
1
, Manuel Eduardo Correia
1
, Francisco Rocha-Gonçalves
2
and Ricardo Cruz-Correia
3
1
INESC - Instituto de Engenharia de Sistemas e Computadores do Porto,
Rua Doutor Roberto Frias, 4200-465 Porto, Portugal
2
Instituto Português de Oncologia do Porto, Rua Dr. António Bernardino de Almeida, 4200-072 Porto, Portugal
3
CINTESIS, Faculty of Medicine of University of Porto, Al. Prof. Hernâni Monteiro, 4200-319 Porto, Portugal
Keywords:
Health Level Seven, Healthcare Integration, Production Measurement.
Abstract:
Introduction: The improvements made to healthcare IT systems made over the past years led to the creation
of a multitude of different applications essential to the institutions daily operations. Aim: We aim to create and
install a system capable of displaying production metrics for healthcare management with little requirements,
efforts and software providers involved. Methods: We propose a system capable of displaying production
metrics for healthcare facilities, by extracting HL7 messages and other eHealth relevant protocols directly
from the institution’s network infrastructure. Our system is then able to populate a knowledge database with
meaningful information derived from the gathered data. Results: Our system is currently being tested on a
large healthcare facility where it extracts and analyses a daily average of 44,000 HL7 messages. The system
is currently capable of inferring and displaying the daily distribution of healthcare related activities such as
laboratory orders or even relevant billing information. Conclusion: HL7 messages moving over the network
contain valuable information that can then be used to assess many relevant production metrics for the entire
facility and from otherwise non-interoperable production systems that, in most cases, can only be seen as black
boxes by other system integrators.
1 INTRODUCTION
The development of new information technologies
and its rapid adoption by healthcare institutional fa-
cilities has paved the way to the rise of eHealth as
a mature research discipline. EHealth technologies
are currently transforming healthcare facilities by rev-
olutionizing the way they produce and process use-
ful business information. This allows them to im-
prove their service efficiency, reduce internal costs
and more importantly help to provide better service to
its patients (Kreps and Neuhauser, 2010; Blaya et al.,
2010). This type of developments are strongly backed
up by governments searching to invest in ways to im-
prove their healthcare systems and at the same time
reduce their maintenance costs (Black et al., 2011;
Catwell and Sheikh, 2009).
Recent investments made in eHealth have also
promoted the development of many Hospital Informa-
tion Systems (HISs). These technologies have been
crucial in helping deploy tools such as the Electronic
Health Records (EHRs), Picture Archiving and Com-
munication Systems (PACSs) or even electronic pre-
scription systems. While there is undergoing research
to evaluate the real impact of these new technolo-
gies in healthcare systems (Schweitzer and Synowiec,
2012; Catwell and Sheikh, 2009), their everyday us-
age has already left hospital facilities with many dif-
ferent, sometimes incompatible systems, each playing
a different role in the everyday activities at the health-
care facility
With each different system, healthcare facilities
are also left with a big amount of heterogeneous data
scattered throughout its HISs. Moreover, important
data such as application logs, can also be considered
as an important source of metrics to assess the good
functioning of the healthcare facility.
It goes without saying that this data can be used to
deduce meaningful information and trends about the
daily activities of the healthcare institution and how
their Information Technlogies (IT) systems are work-
ing. That is, suppose one of the deployed systems
is used to schedule medical appointments. We could
easily use the system’s logs to try and identify the
number of appointments scheduled during a certain
period of time. Such hypothesis when generalized to a
423
Ferreira R., Eduardo Correia M., Rocha-Gonçalves F. and Cruz-Correia R..
Visualization of Passively Extracted HL7 Production Metrics.
DOI: 10.5220/0005217604230430
In Proceedings of the International Conference on Health Informatics (HEALTHINF-2015), pages 423-430
ISBN: 978-989-758-068-0
Copyright
c
2015 SCITEPRESS (Science and Technology Publications, Lda.)

considerable number of different systems, could eas-
ily produce significant data that could be then used
to build a knowledge database from which meaning-
ful performance metrics for healthcare could be easily
produced.
In order to build such a knowledge database we
would need to develop a system capable of extracting
the log files produced by the HISs. However, this ap-
proach presents some difficulties. For once the data
used to build the database would be highly dependent
on the quality of the log files produced, and the ex-
traction system would need to be able to interact with
all the different relevant systems present in the health-
care facility that are involved in the business process
being analysed. In this paper we propose a system ca-
pable of extracting meaningful data by sniffing pack-
ets exchanged between the different systems present
in the network infrastructure and build a meaningful
knowledge database of performance metrics with the
collected data.
Towards this goal, we take advantage of the inte-
gration techniques typically employed by healthcare
facilities to promote interoperability amongst their
heterogeneous systems. By directly analysing net-
work IP packets carrying Health Level Seven (HL7)
messages, our system is capable of extracting mean-
ingful data and build a knowledge database rich with
meaningful indicators about the healthcare facility.
Based on that same database, our system is then able
to produce a series of charts that can be used to sup-
port more informed decision making by the upper lev-
els of management.
The remainder of this paper is organized as fol-
lows. Section 2 provides a background review for sev-
eral systems and methods aiming to assess healthcare
production levels. Section 3 includes a system de-
scription of the methods we use to assess hospital pro-
ductivity levels from information directly collected
from relevant data streams on the network. Section 4
presents and discusses the results thus obtained by a
system deployment on a large Healthcare institution.
Lastly Section 5 concludes the paper and presents fu-
ture work and improvements we want to do with our
current system implementation.
2 BACKGROUND
2.1 Performance Assessment
Measuring hospital facilities performance in a com-
prehensive way and as a as whole is nowadays crit-
ical for proper health care management. The ability
to fully comprehend the expected and real production
level of a given healthcare facility throughout time
is instrumental to support informed decision mak-
ing and to identify opportunities for informed busi-
ness processes improvements to the quality of care
and the service provided. Current academic litera-
ture offers an extensive overview of several studies on
the topic of management metrics and their assessment
for healthcare facilities, that aim to effectively qualify
and quantify hospital performance under many differ-
ent dimensions. According to the United Kingdom
National Audit Office (National Audit Office, 2010),
there’s a thin line separating the terms hospital pro-
ductivity and efficiency. According to the document’s
authors, productivity should be considered as the re-
lationship between the inputs and outputs of health-
care facilities. On the topic of assessing productiv-
ity levels, Solà and Prior (Solà and Prior, 2001) use
a Data Envelopment Analysis (DEA) model in order
to obtain productivity levels for Catalan hospitals and
a Malmquist index in order to produce an overview
of productivity evolution over time. Linna in (Linna,
1999) claims there’s a direct relation between techno-
logical investment and increases in hospital produc-
tivity. Barros et al. (Barros et al., 2008) uses a Luen-
berger indicator in order to assess the productivity in
Portuguese hospitals. Chag et al. (Chang et al., 2011)
introduce an interesting relation between the increase
of hospital productivity levels and efficiency improve-
ments in their own services.
2.2 HL7 Standard
In order to try to solve the interoperability problems
being felt in healthcare facilities, developments were
made in order to advance and adopt medical IT stan-
dards for those type of services (Barbarito et al., 2012;
Yuksel and Dogac, 2011).
One of the main standards employed for interop-
erability in medical IT infrastructures is the HL7 stan-
dard (De Meo et al., 2011). The development of HL7
began in 1987 by an American National Standards
Institute (ANSI) accredited organization whose main
goal, among others, was to implement a standard for
the management of patient data that could be easily
used by heterogeneous healthcare systems as a way
to exchange data in more meaningful ways (Eichel-
berg et al., 2005).
Currently, version 2 of the HL7 standard is the
most employed version among healthcare facilities
worldwide (Eichelberg et al., 2005). When employ-
ing HL7 V2, the content of each message is encoded
in ASCII, the standard also allows for the creation of
a certain level of flexibility on what type of infor-
mation passes on the HL7 segment fields. As a re-
HEALTHINF2015-InternationalConferenceonHealthInformatics
424
sult, many fields are allowed either to contain loosely
formatted information or no information at all. Al-
though this type of flexibility can sometimes be de-
sirable, when used without care, it can sometimes
invalidate interoperability between different systems
and therefore jeopardize the main intent for why HL7
was initially created. In order to rectify this situation,
the new HL7 version 3 standard now uses a Extensi-
ble Markup Language (XML) language with a much
more precise syntax and semantics.
2.3 Healthcare Integration Engines
Assuming the existence of a standard for message
exchanged in healthcare IT infrastructures, the inte-
gration between heterogeneous systems can then be
promoted in two different ways. Either the sending
system communicates directly to end receiver using
a message standard or an integrating engine is in-
troduced at the healthcare facility in order to inter-
connect several different otherwise incompatible sys-
tems.
In the first case, the usage of a message stan-
dard such as the HL7 may not be sufficient to as-
sure that heterogeneous systems can exchange infor-
mation. Such challenge arises due to the fact that
even if software vendors in an healthcare facility both
use HL7 as the message standard in their applications,
they will hardly agree on the specific message and se-
mantics format to use(Corepoint Health, 2010). In
practice, it is extremely difficult to implement an end-
to-end integration model that encompasses all soft-
ware vendors within an healthcare facility.
To allow different legacy systems to intercon-
nect, healthcare facilities often employ interface en-
gines(Corepoint Health, 2010) to solve interoperabil-
ity issues between systems even if they use the same
message exchanging standard. Interface engines are
deployed as an intermediary between different sys-
tems.
3 PROPOSED SYSTEM
ARCHITECTURE AND
IMPLEMENTATION
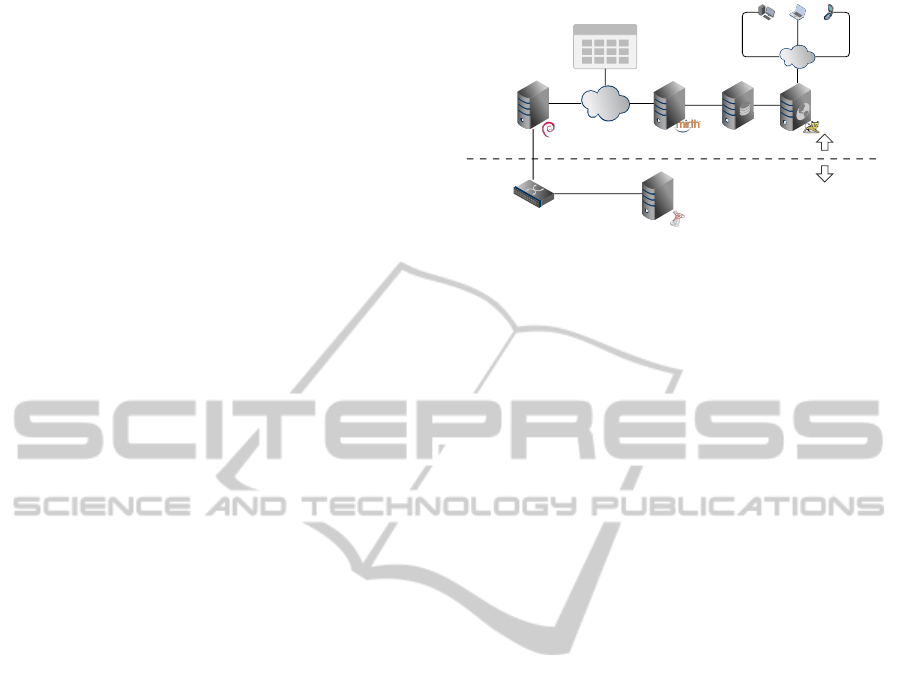
3.1 Overall Architecture Infrastructure
Our system is composed by five different nodes that
work independently of each other. Figure 1 depicts
the overall interactions between the five different sys-
tem components. They are:
Microsoft
Biztalk Server
Network Switch
Sniffer
Node
Hl7Sniffer
Network
NFS Log Folder
HL7 HL7 HL7 HL7
HL7 HL7 HL7 HL7
HL7 HL7 HL7 HL7
Client
Network
Dashboard
Node
Dashboard
Node
Dashboard
Node
RESTful
Node
Port Mirror
HL7Sniffer
Infrastructure
Healthcare
Infrastructure
Mirth Connect
Node
Database
Node
Figure 1: System Infrastructure.
• Sniffer Node. Responsible for passively extract-
ing IP network packets from the network, re-
assemble HL7 messages and then store them in
log/data files, making them available for further
processing by using the Network File System
(NFS) protocol.
• Integration Engine Node. Reads the log files
produced by the “Sniffer Node”, extracts a set
of predefined fields from the HL7 message and
stores them in the “Database Node”.
• Database Node: Stores all the meaningful data
extracted from each HL7 message gathered from
the network infrastructure.
• Representational State Transfer (RESTful)
Node. Receives Hypertext Transfer Protocol
(HTTP) requests and responds to the clients with
information fetched from the database. In a gen-
eral way, this node acts as a proxy for our knowl-
edge database and aims to hide from the client
the complexity of having to query the “Database
Node”
• Dashboard Node. Requests information from the
“RESTful Node” and display a set of highly in-
teractive charts with the information that is being
compiled at the knowledge database.
Our initial goal aimed at developing a system for
meaningful performance metrics extraction of Health-
care business processes that maintained a maximum
level of independence from the healthcare informa-
tion systems infrastructure and their respective sys-
tem vendors and developers. That being the case, the
institutional network where the data being produced
by all the healthcare facility systems flows, presents
a perfect opportunity to get hold of that information
in a complete independent and transparent way. We
can achieve this by placing efficient data packets col-
lector sensor nodes at some strategic points within the
healthcare facility network. This gives us a birds eye
view of all the data that is being exchanged by the
healthcare institution and is simply accomplished by
VisualizationofPassivelyExtractedHL7ProductionMetrics
425
the use of network packet sniffing techniques to ex-
tract a very accurate real time image of the informa-
tion that flows within the institutions networks.
3.2 Data Collection
To extract all the HL7 messages destined to the hos-
pital integration engines, we have used and modified
the tcpflow tool. This particular tool extracts and
re-assembles Transmission Control Protocol (TCP)
packets directly from the network, at the same time
that it creates a series of log files with the data con-
tained in each packet payload.
One of the most attractive features of tcpflow is its
ability to reconstruct and log the data transmitted in
TCP connections without having to maintain all the
data from each packet in memory. Instead, tcpflow
uses the machine Hard Disk Drive (HDD) to write
each packet payload directly on the correct position of
the log file. However helpful, the tcpflow was subject
to some alterations in order to fulfil certain objectives
such as:
• Create a new log file at each new TCP stream;
• Indentify the beginning of each HL7 message;
• Timestamp each captured HL7 message;
• Close the log file when a TCP FIN packet is de-
tected;
• Close the log file when it contains a given amount
of HL7 messages;
• Close the log files of inactive TCP streams;
• Move all the closed files to a given directory of
the system.
3.3 Data Analysis
An integration engine typically serves as a connec-
tor between different otherwise incompatible eHealth
systems. Namely, this tool allows different applica-
tions that use the HL7 standard to communicate with
each other by applying transformations to the HL7
messages that are necessary for data to be transferred
in a meaningful way between those applications.
In our monitoring infrastructure, for our "Integra-
tion Engine Node" we used an instance of the Mirth
Connect engine, an open source software typically
employed by healthcare institutions as a connector
between different heterogeneous systems. However
in our scenario, the Mirth Connect engine plays a
much simpler role, its main use is to read each of
the log files produced by our modified version of
tcpflow, extract the necessary metrics according to
the type of each HL7 message and insert that data
into the “Database Node”. We thus configured a
Mirth Connect server with a series of channels each of
which acts similarly to a pipeline, where each chan-
nel routes, transforms and/or extracts some data from
each HL7 message. Our main goal in adopting this
strategy was to have a single channel with the respon-
sibility of polling all log files previously generated by
our system, queue them and then send a copy of each
HL7 message present in that file to a series of different
channels where each one of them would do a specific
function to the message. We then take advantage of
concurrency by having each Mirth Connect channel
running on separate threads and therefore we can a
take real advantage of multiprocess systems.
3.4 Dynamic Performance Metrics
Management and Comparisons
Throughout Time
For our system to be able to display useful informa-
tion about the level of performance of a given health-
care institution we firstly needed to find a reliable base
of comparison for each metric. That is, suppose we
are evaluating the number of medical appointments
performed on a given day, in order to understand if
the current metrics are within the expected ranges,
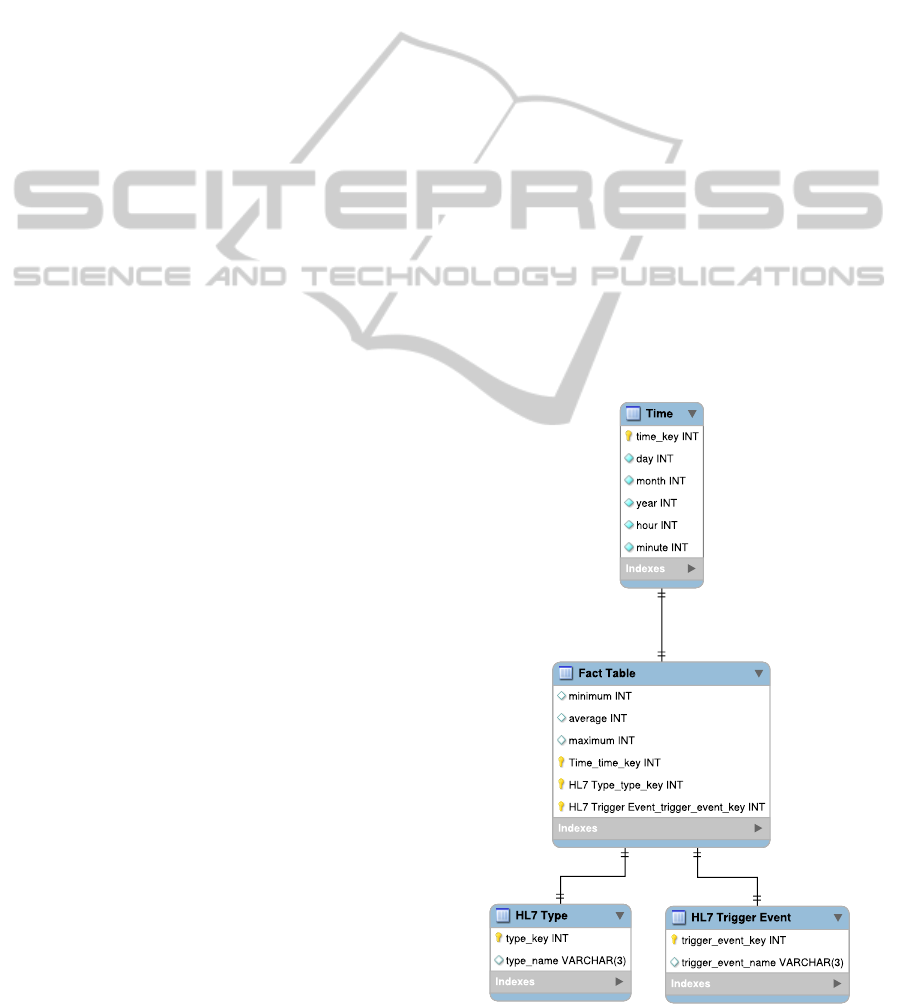
Figure 2: Fact Table Structure.
HEALTHINF2015-InternationalConferenceonHealthInformatics
426

Table 1: Datawarehouse Data.
HL7 MSG
Type
Day Period
Nr.
Messages
ADT-A16 1 09:00 - 10:00 112
ADT-A16 1 10:00 - 11:00 154
... ... ... ...
OML-O21 3 22:00 - 23:00 8
OML-O21 3 23:00 - 00:00 3
... ... ... ...
our systems first needs to have a reference value that
provides a base of comparison for the number of ex-
pected appointments on a given day.
In order to obtain the previous requirements, we
decided to apply some data warehouse techniques to
the database containing all the captured data. By do-
ing so, our system is able to deliver meaningful in-
formation much more quickly by keeping a set of
useful pre-calculated metrics separated from the main
database.
Figure 2 presents our fact table structure. For the
dimension fields, we used the time of capture, the
HL7 type and trigger event fields of each message and
finally for the measure fields we used the minimum,
average and maximum number of messages.
Table 1 presents an example of the kind of infor-
mation our datawarehouse holds. By structuring data
in this form, we are able to maintain an accurate rep-
resentation for the number of messages our system
should expect to receive at any given time of the day.
3.5 System Aditional Usages
The systems’ architecture also presents a great value
as a starting point for the creation of several other par-
allel and independent services. Namely, by using an
infrastructure similar to the one presented in Figure 3,
we are able to use our Mirth Connect Node as a source
for HL7 messages exchanged at the facility and thus
open the possibility of having several different sys-
tems using the gathered messages in order to provide
other types services.
NFS Log Folder
HL7 HL7 HL7 HL7
HL7 HL7 HL7 HL7
HL7 HL7 HL7 HL7
Poll Files
Mirth Connect
Hl7 Message Anonymizer
HL7 Statistic
Producer
HL7 Quality
Analyzer
HL7 Message
Logger
Hl7 Anonymized
Messages
Figure 3: Mirth Network.
For instance, a service that could assess the se-
mantic and syntactic quality of the HL7 messages ex-
changed at an healthcare institution or even a service
that dynamically searches for incoherent or erroneous
data present the HL7 messages. An even more elabo-
rate system that can be built around this system archi-
tecture, is a patient registry system directly populated
by the Mirth Connect node, that is capable of encom-
passing all the patients currently “active” at a given
hospital. Such system could even include information
related to the pathologies and courses of treatment the
patient is currently undertaking, provided that this in-
formation flows in the network being monitored by
the packet sensor nodes.
One actual problem that such an integration model
could help to resolve, resides with the fact that each
HL7 message may contain susceptible information
about patients of the healthcare infrastructure and as
such, the disclosure of such information may be con-
sidered a severe breach of privacy. By using a net-
work of Mirth Connect engines similar to the one pre-
sented in Figure 3 we are able to create an anonymiza-
tion channel capable of removing any type of sensitive
data and proceed to send the anonymized HL7 mes-
sage to a given set of different destinations, therefore
guaranteeing that the next nodes do not receive any
kind of patient sensitive data.
The proposed system can also be seen as an oppor-
tunity for the creation of an integration system com-
pletely independent of any software vendor. Assum-
ing our system is able to collect all HL7 messages
associated with a given software vendor, since we use
an instance of the Mirth Connect engine, our system
would be able to read those same messages and create
a channel capable of applying any type of transfor-
mation the hospital services would require, therefore
eliminating the necessity of having software vendors
altering their own channels in order to fulfil a specific
institution requirement.
4 RESULTS
On a daily basis, we have processed an average of
44,000 HL7 messages with an average rate of 932
messages per minute, reaching peaks of 1,200 mes-
sages per minute on critical hours of the day. Since
the start of the data collection process on the 26th of
April 2014 until the 28th of June 2014, approximately
1,300,000 HL7 messages were successfully extracted
from the network by our Sniffer Node.
Table 2 shows the number of messages received
on a typical working day, grouped by the HL7 type
and trigger event. The number of messages refer-
VisualizationofPassivelyExtractedHL7ProductionMetrics
427
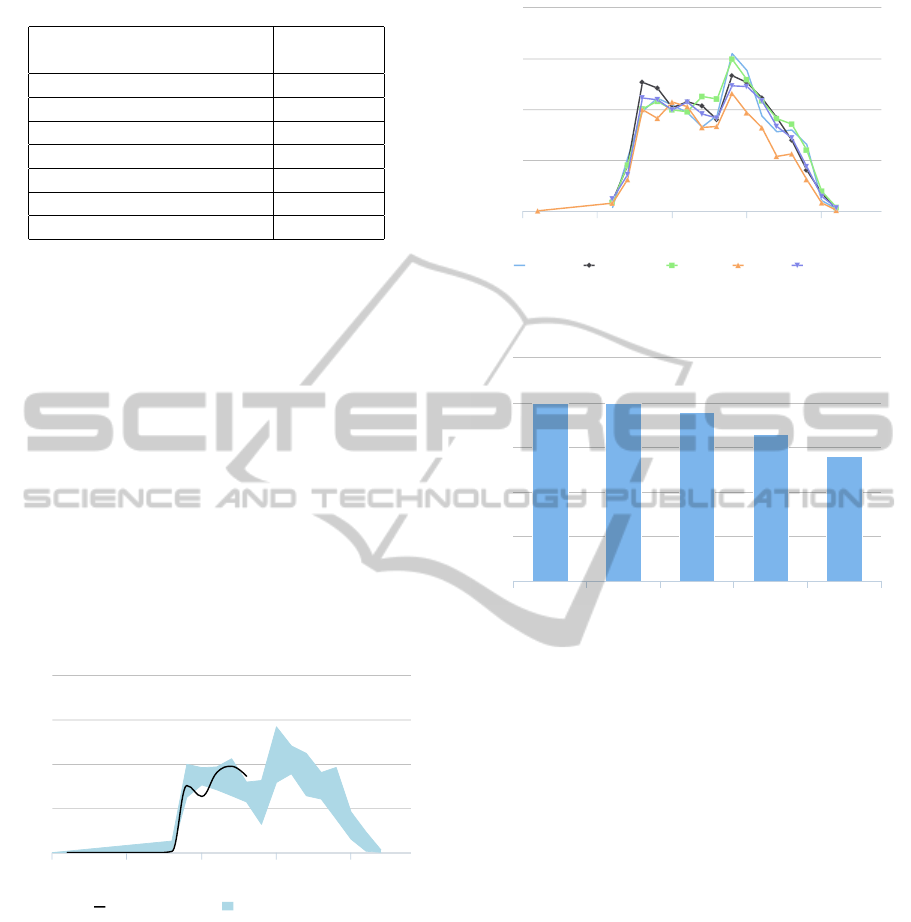
Table 2: Message Types Daily Results.
Description
Number of
Messages
Laboratory Order 18,318
Observation Message 6,869
Appointment Rescheduling 5,363
New Appointment Booking 4,563
Pending Discharge 2,484
Appointment Cancellation 454
Financial Transactions 316
ring to laboratory orders represents 30% of the total
HL7 message traffic in the healthcare infrastructure,
followed by observation messages (15%) and labora-
tory order acknowledgements with 14%. The type of
HL7 message least seen on the network refers to the
cancellation of appointments (1%) and lastly the mes-
sages containing billing information (0.7%).
4.1 Graphical Results
Figure 4 presents an example of the charts our sys-
tem is able to produce. The shadowed area represents
the range of expected messages on a given time frame
while the black curve is calculated by querying the
main database to retrieve the number of HL7 mes-
sages received in the current day.
Time of the Day
Number of Messages
Appointment Bookings
Number of Messages Expected Messages
0 5 10 15 20
0
200
400
600
800
Highcharts.com
Figure 4: Chart Sample.
Figure 5 shows the results obtained when we com-
pare the number of medical appointments scheduled
during the different days of the week.
Apart from providing an high level vision about
the performance of several hospital services, the data
our system gathers can also be used to provide a much
more specific view about the individual performance
of hospital staff. Since HL7 messages often carry in-
formation related to specific individuals working on
the institution, our system can gather that information
and thus calculate several metrics that can possibly be
used to rank individual performances.
Time of the Day
Number of Messages
Tuesday Wednesday Monday Friday Thursday
0 5 10 15 20
0
200
400
600
800
Highcharts.com
Figure 5: Day Of the Week Comparison.
Values
Number of Discharges
Caileigh Sutton Shane Ness Kalyn Elder Allison Abraham Serenity Burns
0
10
20
30
40
50
Highcharts.com
Figure 6: Individual Performance.
Figure 6 presents the number of patient discharges
issued by the hospital physicians. As we can ob-
serve, by presenting metrics in this form, we can
quickly assess and compare individual performances
and therefore use such information to build a perfor-
mance rank.
From a service monitoring point of view, the pro-
posed charts can be used to identify potential mal-
functioning services when for instance, the number
of messages either drops or grows too much outside
their expected range. By using such approach we
lay the groundwork for the creation of an alert sys-
tem based on the number and type of HL7 messages
flowing through the network. Such an alert system
could easily support different levels of severity based
on the level of discrepancy from the expected number
of messages.
As from an administrative point of view, the in-
formation gathered can potentially be used in order
to assess the production level at individual levels and
at different data dimensions. For example, by tak-
ing advantage of some types of HL7 messages con-
taining data that can uniquely identify an individual
in the healthcare facility we believe that our system
would be capable of producing information related to
the performance levels at an individual level.
HEALTHINF2015-InternationalConferenceonHealthInformatics
428

5 CONCLUSION
The improvement of the healthcare IT infrastructures
has led to the creation of multiple applications aim-
ing to provide physicians and healthcare institutions
with the necessary tools to improve their individual
performance and level of care. These systems are
highly heterogeneous and are responsible for the cre-
ation of big pockets of data that end up being scattered
throughout the healthcare infrastructure.
Such pockets of data contain very valuable infor-
mation that could be put to further use, for example
they could be employed to assess the levels of per-
formance of each healthcare infrastructure at different
levels, ranging from the institutional level to the pro-
fessional performance of each individual healthcare
professional. It all depends on the quality and detail
of data that is being produced and flowing within the
institution information systems. However helpful this
information may be, very few hospitals are really pre-
pared to take advantage of every source of potential
piece of information the IT infrastructure produces.
As such, every day valuable information ends up be-
ing lost before it can be properly analysed and inte-
grated into some useful business metric.
We believe that our system takes one step fur-
ther and allows healthcare institutions to recover such
pockets of data and put them to good use by producing
very useful overall statistics about daily basis activi-
ties of the institution as a whole that would be other-
wise very difficult to determine.
We have described and implemented an architec-
ture for a system capable of incrementally building a
knowledge database for an healthcare facility based
on standard protocol messages transmitted through
the network. We were able to efficiently extract HL7
messages directly from the network with the addi-
tional advantage of not having to depend on physical
memory in order to reconstruct out of order packets
since we use the information contained in TCP head-
ers in order to calculate the precise point where each
piece of data fits in the content and use this informa-
tion to write packet collected data directly to the hard
disk. This allows us to process very long data streams
in a very efficient way.
We have been able to use the collected data mainly
for two different goals. From a monitoring point of
view, the data gathered can be used to find normal
levels of activities performance for a given healthcare
facility and with that information, one can easily de-
tect outliers that result from malfunctioning sections
of the healthcare infrastructure. A deeper analysis of
this data can also be used to support decision makings
from an administrative point of view.
We have also described a set of other uses for our
system architecture. Namely, after the message ex-
traction from the network, one can also build a net-
work of systems that could receive anonymized HL7
messages and produce, for example a new service
based on the data received such as HL7 semantic and
syntactic quality assessment.
5.1 Current Limitations
In terms of hardware, the system is heavily limited
by the processing capabilities of the Sniffer node at
several levels. That is, starting on the Network Inter-
face Card (NIC), we believe our overall system would
greatly benefit from the usage of a hardware capa-
ble of automatically associate each packet with an
extraction timestamp directly calculated from hard-
ware (Agarwal et al., 2003). With this, the cost of
timestamp association with each message could be
greatly reduced since in our current implementation,
such timestamp can only be calculated in user space.
Apart from the NIC on the sniffer node, one could
also benefit from using a CPU capable of offering
more computational power in order to reduce the
amount of time each packet needs to remain in user
space to be analysed. Also from an hardware point
of view, the usage of Solid-State Drive (SSD) hard
disks could also improve the overall performance of
our sniffer node, since the TCP stream reconstruction
is made directly on the hard drive in order to reduce
amount of physical memory needed.
From the software point of view, the current de-
ployed version of our system is unable to deal with
fragmented IP packets. As for now, our system simply
discards any packet fragmented at the network layer.
Tests have already been made in order to provide the
Sniffer node with the capability to reconstruct frag-
mented packets, however, the reconstruction of such
packets proved to be too slow when using the hard
disk.
Finally, related to the actual quality of the infor-
mation our system allows to take directly from the
network of the healthcare institution, the accuracy of
the extracted metrics may be compromised if many
correction messages are exchanged through the hos-
pital network. Nevertheless, if this happens, our sys-
tem should be able to detect this behaviour and there-
fore flag it as an unoptimized way for the institution
to work.
5.2 Future Work
As future work, we want to concentrate our efforts
in supporting more healthcare standards and be able
VisualizationofPassivelyExtractedHL7ProductionMetrics
429

to draw significant information based on the collected
data. The support for different standards should en-
able us to empower our knowledge database with suf-
ficient data to produce more well grounded statis-
tics with more incisive views on several business pro-
cesses.
REFERENCES
Agarwal, D., González, J. M., Jin, G., and Tierney, B.
(2003). An infrastructure for passive network moni-
toring of application data streams. Lawrence Berkeley
National Laboratory.
Barbarito, F., Pinciroli, F., Mason, J., Marceglia, S., Maz-
zola, L., and Bonacina, S. (2012). Implementing
standards for the interoperability among healthcare
providers in the public regionalized healthcare infor-
mation system of the lombardy region. J. of Biomedi-
cal Informatics, 45(4):736–745.
Barros, C. P., de Menezes, A. G., Peypoch, N., Solonan-
drasana, B., and Vieira, J. C. (2008). An analysis of
hospital efficiency and productivity growth using the
luenberger indicator. Health care management sci-
ence, 11(4):373–381.
Black, A. D., Car, J., Pagliari, C., Anandan, C., Cresswell,
K., Bokun, T., McKinstry, B., Procter, R., Majeed,
A., and Sheikh, A. (2011). The impact of ehealth
on the quality and safety of health care: a systematic
overview. PLoS medicine, 8(1):e1000387.
Blaya, J. A., Fraser, H. S., and Holt, B. (2010). E-health
technologies show promise in developing countries.
Health Affairs, 29(2):244–251.
Catwell, L. and Sheikh, A. (2009). Evaluating ehealth inter-
ventions: the need for continuous systemic evaluation.
PLoS medicine, 6(8):e1000126.
Chang, S.-J., Hsiao, H.-C., Huang, L.-H., and Chang, H.
(2011). Taiwan quality indicator project and hospital
productivity growth. Omega, 39(1):14–22.
Corepoint Health (2010). http://www.corepointhealth.com/
whitepapers/why-do-i-need-hl7-interface-engine.
[Online; accessed 2014/04/10].
De Meo, P., Quattrone, G., and Ursino, D. (2011). Integra-
tion of the hl7 standard in a multiagent system to sup-
port personalized access to e-health services. Knowl-
edge and Data Engineering, IEEE Transactions on,
23(8):1244–1260.
Eichelberg, M., Aden, T., Riesmeier, J., Dogac, A., and
Laleci, G. B. (2005). A survey and analysis of elec-
tronic healthcare record standards. ACM Comput.
Surv., 37(4):277–315.
Kreps, G. L. and Neuhauser, L. (2010). New directions
in ehealth communication: Opportunities and chal-
lenges. Patient Education and Counseling, 78(3):329
– 336. Changing Patient Education.
Linna, M. (1999). Health care financing reform and the
productivity change in finnish hospitals. Journal of
Health care finance, 26(3):83–100.
National Audit Office (2010). Management of nhs hospi-
tal productivity. http://www.nao.org.uk/wp-content/
uploads/2010/12/1011491es.pdf. [Online; accessed
2014/05/10].
Schweitzer, J. and Synowiec, C. (2012). The economics of
ehealth and mhealth. Journal of health communica-
tion, 17(sup1):73–81.
Solà, M. and Prior, D. (2001). Measuring productivity and
quality changes using data envelopment analysis: an
application to catalan hospitals. Financial Account-
ability & Management, 17(3):219–245.
Yuksel, M. and Dogac, A. (2011). Interoperability of med-
ical device information and the clinical applications:
An hl7 rmim based on the iso/ieee 11073 dim. In-
formation Technology in Biomedicine, IEEE Transac-
tions on, 15(4):557–566.
HEALTHINF2015-InternationalConferenceonHealthInformatics
430
