
Edge-stacked Timelines for Visualizing Dynamic Weighted Digraphs
Michael Burch, Tanja Munz and Daniel Weiskopf
VISUS, University of Stuttgart, Stuttgart, Germany
Keywords:
Dynamic Graph Visualization.
Abstract:
We investigate the problem of visually encoding time-varying weighted digraphs to provide an overview about
dynamic graphs. Starting from a rough overview of dynamic relational data an analyst can subsequently
explore the data in more detail to gain further insights. To reach this goal we first map the graph vertices in the
graph sequence to a common horizontal axis. Edges between vertices are represented as stacked horizontal
and color-coded links starting and ending at their corresponding start and end vertex positions. The direction
of each edge is indicated by placing it either above or below the horizontal vertex line. We attach a vertically
aligned timeline to each link to show the weight evolution for those links. The order of the vertices and stacked
edges is important for the readability of the visualization. We support interactive reordering and sorting in the
vertex, edge, and timeline representations. The usefulness of our edge-stacked timelines is illustrated in a case
study showing dynamic call graph data from software development.
1 INTRODUCTION
The visual encoding of dynamic graphs is challeng-
ing (Beck et al., 2014a) compared to the visualiza-
tion of static graphs. Using node-link diagrams in a
two-dimensional layout as well as matrix representa-
tions either in a time-to-time (animation) or time-to-
space mapping either leads to cognitive efforts due to
the preservation of the viewer’s mental map or to vi-
sual scalability problems due to showing a number of
graphs in a small multiples or stacked fashion. This
gets even more challenging when the focus is on find-
ing time-varying patterns among the edge weights.
We introduce a novel dynamic graph visualization
that avoids explicit link crossings and supports the
preservation of a viewer’s mental map. To achieve
these goals we use a time-to-space mapping of the
graph sequence by visually encoding the vertices oc-
curing in the graph sequence to a horizontal centered
line to equidistant positions. The edges are placed
in a vertex-aligned manner as color coded parallel
and stacked straight links each starting and ending
at their corresponding vertex positions. The time-
varying weights of each edge are displayed by stacked
and link-aligned timelines to the left hand side with-
out overlap of the graph view.
This technique provides an overview for a time-
varying weighted digraph with an additional hierar-
chical vertex organization. As a second step the tech-
nique supports interactively zooming into any rectan-
gular region in the graph view. Filtering in the ver-
tex, edge, and time dimensions can be used to further
reduce the vast amounts of displayed data. Finally,
details-on-demand features are also integrated which
might be used to display a selected graph in another
representation (Shneiderman, 1996).
The technique supports two ordering techniques
for the vertices or the edges: Interactive reorder-
ing of vertices is applied to reduce link lengths as
also proposed in the work of (van den Elzen et al.,
2013) and edge stacking ordering to put edges close
to each other that are required to find graph structures.
In combination, these ordering strategies can reveal
common trends among edge groups between hierar-
chically organized vertex groups.
2 RELATED WORK
Dynamic graph visualization has become a growing
discipline due to many application domains (Beck
et al., 2014a). Several aesthetic graph drawing cri-
teria (Beck et al., 2009, 2013) play a crucial role in
order to make first static diagrams readable and aes-
thetically pleasing and second, allow to visually an-
alyze the dynamics of the graph. For the dynamics,
criteria such as dynamic stability leading to a preser-
vation of a viewer’s mental map (Archambault et al.,
93
Burch M., Munz T. and Weiskopf D..
Edge-stacked Timelines for Visualizing Dynamic Weighted Digraphs.
DOI: 10.5220/0005259200930100
In Proceedings of the 6th International Conference on Information Visualization Theory and Applications (IVAPP-2015), pages 93-100
ISBN: 978-989-758-088-8
Copyright
c
2015 SCITEPRESS (Science and Technology Publications, Lda.)

2011; Purchase et al., 2007) are of special interest to
reduce the cognitive efforts for a viewer when making
comparisons among the single graphs in a sequence.
There are two lines of research: Graph anima-
tion (Diehl and G
¨
org, 2002; Frishman and Tal, 2007),
on the one hand, has become an approach to visually
map the dynamic graph data. But when the graphs be-
come dense, the node-link metaphor which is mainly
used for displaying animated graph sequences, suffers
from visual clutter (Rosenholtz et al., 2007) making
even a single diagram hard to read. For animation,
sophisticated layout algorithms are needed which fo-
cus on producing aesthetically pleasing diagrams on
the one hand but also follow rules such as dynamic
stability. Even when many of these design principles
are followed in an animated diagram it still remains
hard to analyze the data for temporal patterns and to
apply interactive features as well as a hierarchical or-
ganization of the vertices if one exists (Burch et al.,
2010; Beck et al., 2014b).
In our design we are more in favour of a non-
animated diagram for showing the graph evolution
over time. Such non-animated time-to-space ap-
proaches are for example the parallel edge splatting
technique (Burch et al., 2011) that uses a small mul-
tiples representation by mapping the graphs in a se-
quence to side-by-side vertical stripes similar to par-
allel coordinates. Although, this is a useful idea,
by making a graph artificially bipartite and by map-
ping the vertices to one-dimensional vertical lines, the
probability of link crossings increases.
In our approach, instead, we apply a more clutter-
free visualization strategy by stacking the links and
the aligned timelines for the edges. In this tech-
nique, links are not crossing each other. Moreover, the
graphs are not made artificially bipartite which intro-
duces additional representatives (as also in adjacency
matrix visualizations) making path-related tasks in a
graph difficult to solve. Another concept apart from
using small multiples is by directly integrating the
graphs in a stacked manner into one static diagram
by using aligned planes (Brandes and Corman, 2003).
Also matrix representations have been introduced
for dynamic graph visualization where each cell of the
matrix includes some timeline showing the evolution
of a single edge, for instance, based on pixel repre-
sentations (Stein et al., 2010), line angles (Brandes
and Nick, 2011), or bar charts (Burch et al., 2013).
Also radial matrix-based approaches have been de-
signed (Burch and Diehl, 2008; Vehlow et al., 2013)
which suffer from visual scalability problems for ver-
tices and edges. Moreover, visual comparisons over
time are difficult to solve due to the mapping to circu-
lar shapes.
Our novel technique is in some way related to
the approach proposed by (van den Elzen et al.,
2013) which is based on the Massive Sequence
Views (MSV) introduced by (Jerding and Stasko,
1995, 1998) as Execution Mural and later adapted to
software visualization by (Cornelissen et al., 2007;
Holten et al., 2007). Van den Elzen et al. investigate
the ordering problem of vertices as well as the optimal
linear arrangement problem (OLA) (Garey and John-
son, 1979) with the goal to make the diagrams more
readable and understandable. This algorithmic strat-
egy focuses on trends, countertrends, and anomalies
in the graph dynamics but also on static graph pat-
terns such as community or star patterns.
3 DATA MODEL
We model a directed weighted graph as G = (V, E
A
)
where V := {v
1
, . . . , v
n
} denotes the finite set of n ∈ N
vertices and E
A
⊆ V ×V := {e
1
, . . . , e
m
} the finite set
of m ∈ N directed adjacency edges. Each edge e
j
∈
E
A
, 1 ≤ j ≤ m is attached by a weight w(e
j
) where
w : E −→ R denotes a weight function giving each
edge a specific real-valued number.
A dynamic graph Γ of length k ∈ N is denoted
as a sequence of single graphs Γ := {G
1
, . . . , G
k
}
where each graph G
i
, 1 ≤ i ≤ k is a static directed and
weighted graph in the sense described above with a
vertex set V
i
and an edge set E
A
i
.
The hierarchical organization among the graph
vertices is modeled as another graph, i.e. a hierar-
chy, H = (
S
k
i=1
V
i
, E
I
). The hierarchical organization
is hence composed of the set of all vertices occuring
in the graph sequence and another set of relations, the
inclusion edges E
I
expressing parent-child relation-
ships among the hierarchy vertices. It may be noted
that E
A
and E
I
are disjoint sets, i.e. E
A
∩ E
I
=
/
0.
3.1 Vertex and Edge Ordering
Our novel visualization technique places graph ver-
tices equidistantly on a one-dimensional line. For
this, all vertices from the set V :=
S
k
i=1
V
i
are taken
into account, i.e. all vertices that occur in all graphs
in the sequence. If a hierarchy H exists among the
vertices V this must be maintained when laying out
the graph vertices, i.e. the hierarchical organization
must also be mapped to a one-dimensional line.
The traversal of the graph vertices plays a deciding
role for the edges E
A
. The Optimal Linear Arrange-
ment Problem (Garey and Johnson, 1979) which is
NP-hard can be algorithmically solved by a heuristics
as also described in the work of (van den Elzen et al.,
IVAPP2015-InternationalConferenceonInformationVisualizationTheoryandApplications
94
2013) when reordering Massive Sequence Views but
we additionally have to deal with a hierarchical orga-
nization of the vertices which makes the problem even
harder.
In our work we do not focus on an effective
and efficient automatic reordering of the graph ver-
tices focusing on the reduction of link lengths or
the sum of overlaps since our novel contribution is
more on showing a dynamic weighted graph with ex-
plicit timelines attached to the graph links in an edge-
aligned manner. Moreover, the graph edges should be
aligned to their corresponding timeline to better ex-
plore the time-series weights for dynamic patterns as
described in the work of (Burch and Weiskopf, 2011).
Also the ordering of the edges E
A
, i.e. the stack-
ing order, plays an important role when discover-
ing temporal trends. The vertical order of the edges
directly influences the order of the timelines in the
same way. This again helps to find groups of simi-
lar time-varying patterns and can directly be explored
for matching a group of relations coming from simi-
lar subhierarchies and targeting to other or the same
subhierarchies. For the edge order we achieve more
freeness than in the approach of (van den Elzen et al.,
2013) because in their work the edge stacking di-
mension is fixed since it is used as time axis. The
edge ordering also plays a deciding role when detect-
ing graph patterns such as star patterns, clusters, or
graph symmetries. For this reason we support several
edge stacking strategies in our technique which are
described in more detail in Section 4.1 such as order-
ing by shortest edges, oldest edges, youngest edges,
edges with the smallest start vertex index, edges with
the shortest path through a given hierarchy and the
like.
3.2 Data Aggregation
We live in a data-driven era, i.e. datasets become
larger and larger due to the progress in hardware tech-
nologies. The growing of datasets has also an impact
on dynamic graph data. Todays dynamic graph visu-
alization techniques must keep up with the flood of
relations. Graphs can grow in either the vertex, edge,
or time dimension. Also additional attributes such as
edge weights or a hierarchical organization among the
graph vertices is present in many scenarios which is
also of interest for a graph analyst.
As (Tufte, 1992) puts it ”Above all else show the
data”, we follow a similar concept in our approach.
We display as much of the graph data in a com-
pressed and aggregated way. This means we display
as many vertices, edges, and time steps as are given
in a dataset. Since we have a limited display capac-
ity this data should be aggregated in an effective and
efficient way in all three dimensions.
Generally, spatially neigbored vertices must be
represented in a single pixel when the screen resolu-
tion is not large enough to display all of them sepa-
rately. The same holds for neighbored links as well
as timelines. To achieve a good overview of the dy-
namic graph data in all three dimensions, aggregation
in both horizontal and vertical direction is required.
To this end we support simple aggregation tech-
niques that take either the sum, the average, or the
maximum of the edge weights into account. The ag-
gregated weights are displayed as color-coded pixels.
Moreover, the color coding can be displayed linearly
or logarithmically.
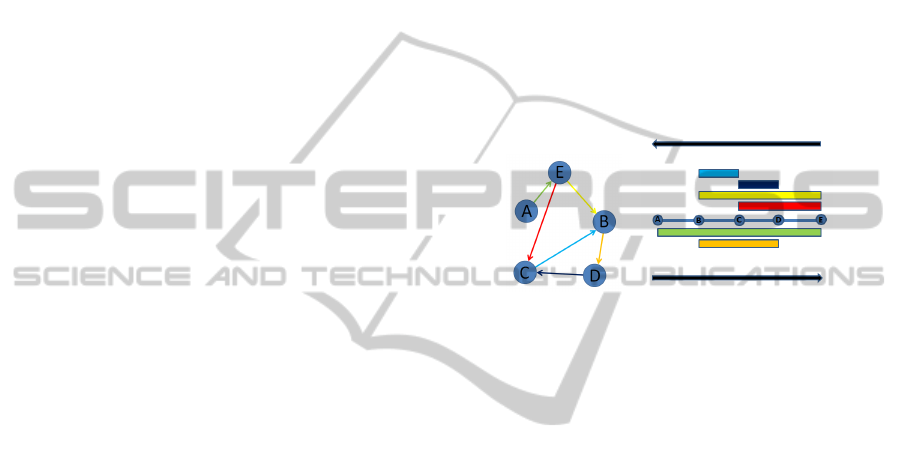
(a) (b)
Figure 1: A weighted and directed graph: (a) Standard
node-link representation with color-coded links and arrow
heads. (b) Edge-stacked visualization of the same static
graph as in (a) but with color-coded stacked lines.
4 VISUALIZATION TECHNIQUE
Our novel visualization technique has to deal with
three data dimensions as well as additional attached
and inherent data. The contribution of this work is
that the vertex, edge, and time dimension of a dy-
namic graph should be displayable in a scalable way.
Time-varying edge weights, structural graph proper-
ties, symmetries, the direction of the edges, or the hi-
erarchical organization of the graph vertices will also
be visually encoded in the diagram. Apart from using
a time-to-space mapping for the dynamic data also vi-
sual clutter should be reduced, i.e. the static diagram
should not suffer from link crossings as typically oc-
curing in node-link diagrams. Runtime complexities
should be reduced allowing an interactive visualiza-
tion technique. This is problematic for graph anima-
tion when generating stable graph layouts.
Another advantage, in particular compared to ma-
trix visualizations, is the fact that only one representa-
tive element is displayed for each graph vertex which
makes path-related tasks easier to solve. Moreover,
both absolute as well as relative time can be displayed
in the aligned and stacked time axes which allows
Edge-stackedTimelinesforVisualizingDynamicWeightedDigraphs
95

comparisons between time intervals, also on different
time axis granularities.
4.1 Static Graph Visualization
We first show how a static directed and weighted
graph is visualized as an edge-stacked visualization.
First the vertices of a graph are mapped equidistantly
to a horizontal line. The edges are mapped as parallel
stacked lines (or rectangles) where the horizontal po-
sitions of the start and target vertices indicate the line
ends. Depending on the direction of an edge, the cor-
responding line is placed either above or below the
horizontal separation line. Self-edges are displayed
on both sides to give a correct impression on the sym-
metries in a graph. Color coding is used to visually
map the edge weights of a static graph. Also cate-
gorical edge attributes instead of quantitative weights
might be visually encoded by color.
Figure 1 (a) illustrates a weighted directed graph
consisting of five vertices and six edges. The directed
links are color-coded to demonstrate different weights
in a graph. The mapping of this static graph to an
edge-stacked visualization is shown in Figure 1 (b).
The hierarchical organization among the graph
vertices (if one exists) is displayed as a layered ici-
cle plot (Kruskal and Landwehr, 1983) oriented to
the top and to the bottom. This hierarchical organiza-
tion can be used to collapse or expand subhierarchies.
Moreover, if it is present in the dataset it allows to de-
rive graph patterns between subhierarchies and also
on different levels of hierarchical granularity.
(a) (b)
Figure 2: A weighted and directed graph with an additional
hierarchical organization of the vertices: (a) Standard node-
link diagram with hierarchy indicated by dashed lines. (b)
Edge-stacked visualization with attached layered icicle plot
to display the hierarchy.
Figure 2 (a) illustrates a static weighted and di-
rected graph with an additional hierarchical organiza-
tion of the graph vertices. This is indicated by the
dashed lines showing a small hierarchy H consisting
of subhierarchies H1 (leaf vertices A, B, and C) and
H2 (leaf vertices D and E). Figure 2 (b) visualizes this
static graph with an additional hierarchy as an edge-
stacked representation.
It may be noted that the reordering of the vertices,
i.e. a traversal of the hierarchy does not influence the
order of the stacked edges. It can have an impact on
single line lengths and the sum of line lengths as well
as their overlap. The reduction of this overlap is ref-
ered to as the Optimal Linear Arrangement Problem
(OLA) which is NP-hard.
Based on a given vertex order we apply different
strategies for the graph edge stacking as ordering by
shortest edges, by oldest edges, by youngest edges,
by edges with the smallest start vertex indices, by the
shortest path through a given hierarchy, or by edges
of graph-theoretic problem solutions.
4.2 Time Mapping
A dynamic graph Γ := {G
1
, . . . , G
k
} consists of a se-
quence of k static graphs. One solution to display
the graph sequence would be a small multiples rep-
resentation which shows each graph of the sequence
in the visualization technique described above in Sec-
tion 4.1. Following this concept would lead to visual
scalability issues and problems when comparing the
evolution of weights of longer sequences.
In our approach we apply a different visualization
strategy. We integrate the graph sequence into a static
diagram by displaying all graph vertices and edges oc-
curing in the sequence as an edge-stacked visualiza-
tion. Moreover, each edge is attached by an aligned
timeline on the left hand side to indicate the evolution
of its weight over time. Doing this supports not only
to explore the graph for structural properties but also
for time-varying patterns on different levels of hierar-
chical as well as temporal granularity.
Moreover, single graphs or longer subsequences
can be selected which has an influence on the color
coding of the stacked edges. If only one graph is se-
lected, all edges in the edge-stacked visualization oc-
curing in this selected graph are color coded by the
same color as used for the weights in this graph. If
more than one graph is selected we color code all
edges occuring in at least one of the graphs. If the
same edge occurs in more than one selected graph
we support edge weight aggregation by either show-
ing the maximum, minimum, average, or sum of the
weights in the color coding. The edges in the edge-
stacked visualization which are not occuring in se-
lected graphs are displayed as grayed out lines. This
helps to provide context information and to support
mental map preservation when a viewer wants to click
through the graph sequence one-by-one in order to an-
alyze the graph sequence for changes (see for example
Figures 5 (a) to (f)).
IVAPP2015-InternationalConferenceonInformationVisualizationTheoryandApplications
96
(a)
(b)
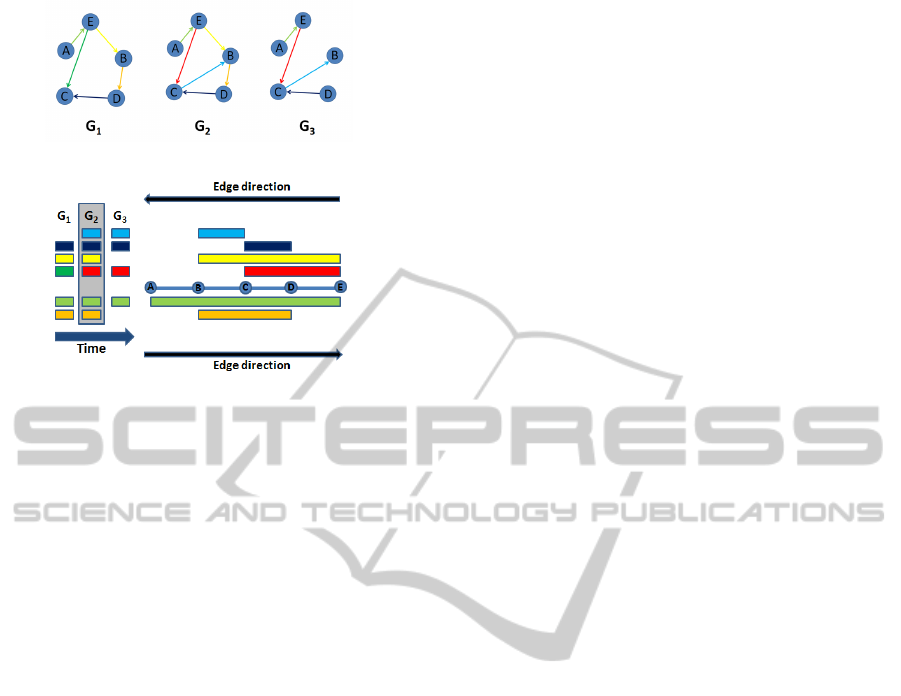
Figure 3: A sequence of three weighted digraphs is shown:
(a) As a side-by-side representation of traditional node-link
diagrams. (b) As an edge-stacked timeline visualization.
Figure 3 (a) illustrates a sequence of three directed
and weighted graphs as node-link diagrams with color
coded links. The edge-stacked timeline visualization
with graph G
2
selected for this dynamic graph is rep-
resented in Figure 3 (b). We can easily recognize that
there are two edges which show a constant behavior,
i.e. the edge starting at vertex D and ending at ver-
tex C has always the same color (dark blue). Also
the edge starting at vertex A and ending at vertex E
shows a constant behavior (green color). Also weight
changes over time can be found for example for the
edge from E to C which changes from green to red
color over time. If edges are added or deleted over
time this can be recognized by inspecting the gaps in
the timeline view.
Following all these design principles leads to a
representation of dynamic weighted digraphs with-
out showing any explicit link crossing in the result-
ing dynamic graph diagram. Sorting algorithms and
aggregation techniques can further be used to achieve
a more pattern-indicating visualization. For example,
clusters among the vertices might be of interest mean-
ing a reordering of the horizontal vertex positions.
Dynamic patterns might also be of interest meaning
the vertical stacking order of the links (attached by
timelines) must be reordered. It may be noted that
any reordering will not introduce any link crossings
which is typically the case for traditional layout al-
gorithms in two-dimensional layouts for static graphs
due to aesthetic graph drawing criteria.
We show the dynamic graph data in a static (time-
to-space) mapping which allows to integrate sev-
eral interaction techniques to explore the dynamic
graph data in the vertex, edge, and time dimensions.
The most prominent ones are zooming and distor-
tion, filtering, brushing and linking, region expansion
and collapse, vertex and edge orderings, solutions to
graph-theoretic problems, a difference functionality
for graph directions, and computation of differences
or commonalities between subsequent graphs.
5 DYNAMIC CALL RELATIONS
We inspect dynamic graph data from the open source
software project PMD which supports the analysis of
source code implemented in the JAVA programming
language. With PMD one is able to find inefficient
code structures like local variables not used during
program execution, package imports occuring several
times, or empty try/catch blocks. The graph to be an-
alyzed contains 1,851 vertices, 28,748 edges and 7
timesteps which are the revisions for this project.
The edge-stacked timeline visualization for the
complete dataset is represented in Figure 4 in which
graph G
1
is selected from the sequence. For the edge
stacking we use the shortest edge stacking strategy,
i.e. the shorter an edge the closer it is placed to the
horizontal separation line. We use a vegetation color
scale, mapping low values to blue color and high val-
ues to red. Values in-between are mapped to green to
yellow color, see Figure 4.
From this diagram we can make interesting ob-
servations: If we inspect all relations in the edge-
stacked view (color coded and grayed out edges) we
see graph structures which refer to call clusters. This
insight can be derived from the short stacked edges
(blocks) which express call relations inside a direc-
tory. Only a fraction of the edges are very long, cross-
ing the complete horizontal display area. In general,
the longer edges refer to calls between functions lo-
cated far away in the hierarchy. Such inter-package
calls might be problematic for software engineering.
In Figure 4 graph G
1
is selected and only the edges
are color coded in the edge-stacked view which are
present in G
1
. Here we can detect two clusters lo-
cated to the left and to the right and also some longer
edges to the top (and to the bottom due to symmetries)
which connect elements from both clusters. Hover-
ing over the hierarchy shows that the leftmost clus-
ter is caused by relations from the ast and cpd direc-
tories whereas the rightmost cluster contains calls of
swingui and rules directories.
Looking at Figures 5 (a) to (f) one can see that the
clusters with the short edges persist for the first five
revisions, whereas the cluster with the longer edges
persists over the complete time interval.
Edge-stackedTimelinesforVisualizingDynamicWeightedDigraphs
97
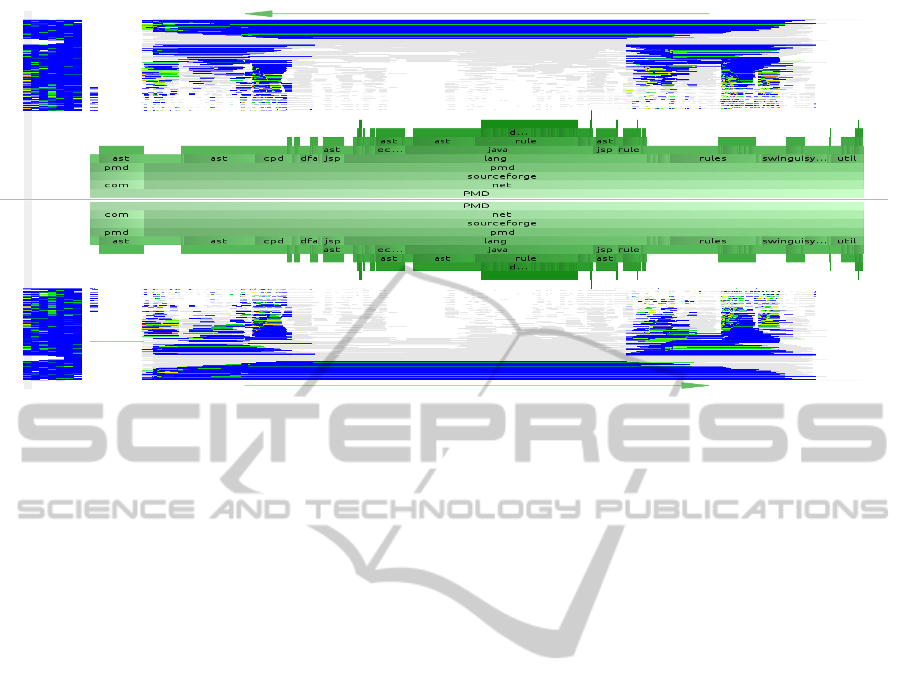
Figure 4: The dynamic call relations of the PMD Open Source software project. 1,851 vertices, 28,748 weighted edges, and
7 timesteps are displayed. In this example graph G
1
is selected and the links are color coded as in G
1
. All other existing
relations in the graph sequence are grayed out to provide context information.
Applying interaction techniques uncovers that the
methods of the subdirectories java, dfa, jsp, ec-
mascript, ast, and cpp as well as several methods of
the directory sourceforge/pmd/lang are not related to
any other method during the first five time steps.
6 LIMITATIONS
Although we proposed a scalable visualization tech-
nique for dynamic weighted digraphs we are aware
of the fact that there are also several limitations of
our approach. Also various improvements might be
added to the existing technique, some of them have
been described in the paper.
Visual scalability is achieved by data aggregation
which means that several data points are summarized
into one single data point. By this operation insights
are lost which might be important to derive other not
apparent visual patterns and consequently, patterns in
the data. For this reason, we allow several aggregation
techniques which can be switched on users’ demand.
Pattern detection can be difficult if the vertex,
edge, or timeline order strategy is not suitable for the
dataset under exploration. To mitigate this situation
we provide several ordering techniques which must
also be tested for their suitability.
The network topology is not derivable that eas-
ily as in node-link diagrams in the two-dimensional
space. In our work we plot the vertices to a one-
dimensional horizontal line to only use one represen-
tative element for each vertex but clusters and outliers
may be harder to identify.
Also the computational scalability plays a decid-
ing role in our work. As sophisticated layout algo-
rithms must be applied in traditional node-link dia-
grams also in our edge-stacked timelines visualiza-
tion, reordering techniques should be applied to make
the diagrams more readable. But the reordering is also
proved to be an NP-hard problem.
7 CONCLUSION
In this paper we introduced a visualization technique
for dynamic weighted and directed graphs based on
edge-stacked timelines. The approach is able to dis-
play graphs with many vertices, edges, and long time
sequences by using an aggregated pixel-based repre-
sentation. Interaction techniques for vertex and edge
ordering are proposed and tested for suitability. By
using our technique we were able to detect time-
varying patterns in real-world graph data for both the
evolution of edge weights and the structural proper-
ties of the graph. Apart from inspecting the static dia-
gram, which already shows several visual patterns and
serves as an overview, our visualization tool supports
interaction techniques also for finding graph-specific
properties.
Since this visualization is designed to be scalable
for large graphs, limitations for path-related tasks can
be regarded as a drawback which can be solved by
interaction techniques. A better exploration of sin-
gle graphs is focus of future work. Additional graph
views in form of traditional node-link diagrams or
adjacency matrices might be integrated combined by
IVAPP2015-InternationalConferenceonInformationVisualizationTheoryandApplications
98

(a) (b)
(c) (d)
(e) (f)
Figure 5: Call graphs G
2
to G
7
of the PMD project displayed as edge-stacked timeline visualizations in a side-by-side small
multiples representation. In each of the figures, one graph is selected and the occuring edges are color coded accordingly.
brushing and linking features to give an analyst a way
to inspect the data from different perspectives. A user
study should be conducted with the goal to find out
if our novel visualization technique can keep up with
existing dynamic graph visualizations.
Edge-stackedTimelinesforVisualizingDynamicWeightedDigraphs
99

REFERENCES
Archambault, D., Purchase, H., and Pinaud, B. (2011). An-
imation, small multiples, and the effect of mental map
preservation in dynamic graphs. IEEE Transactions
on Visualization and Computer Graphics, 17(4):539–
552.
Beck, F., Burch, M., and Diehl, S. (2009). Towards an aes-
thetic dimensions framework for dynamic graph visu-
alisations. In Proceedings of International Conference
on Information Visualisation (IV), pages 592–597.
Beck, F., Burch, M., and Diehl, S. (2013). Matching appli-
cation requirements with dynamic graph visualization
profiles. In Proceedings of International Conference
on Information Visualisation (IV), pages 12–18.
Beck, F., Burch, M., Diehl, S., and Weiskopf, D. (2014a).
The state of the art in visualizing dynamic graphs. In
EuroVis State-of-the-Art Reports, EuroVis STAR.
Beck, F., Burch, M., Munz, T., Silvestro, L. D., and
Weiskopf, D. (2014b). Generalized Pythagoras trees
for visualizing hierarchies. In Proceedings of the In-
ternational Conference on Information Visualization
Theory and Applications, pages 17–28.
Brandes, U. and Corman, S. R. (2003). Visual unrolling
of network evolution and the analysis of dynamic dis-
course. Information Visualization, 2(1):40–50.
Brandes, U. and Nick, B. (2011). Asymmetric relations in
longitudinal social networks. IEEE Transactions on
Visualization and Computer Graphics, 17(12):2283–
2290.
Burch, M. and Diehl, S. (2008). TimeRadarTrees: Visualiz-
ing dynamic compound digraphs. Computer Graphics
Forum, 27(3):823–830.
Burch, M., Raschke, M., and Weiskopf, D. (2010). Indented
Pixel Tree Plots. In Proceedings of the International
Symposium on Advances in Visual Computing, pages
338–349.
Burch, M., Schmidt, B., and Weiskopf, D. (2013). A matrix-
based visualization for exploring dynamic compound
digraphs. In Proceedings of International Conference
on Information Visualisation (IV), pages 66–73.
Burch, M., Vehlow, C., Beck, F., Diehl, S., and Weiskopf,
D. (2011). Parallel edge splatting for scalable dynamic
graph visualization. IEEE Transactions on Visualiza-
tion and Computer Graphics, 17(12):2344–2353.
Burch, M. and Weiskopf, D. (2011). Visualizing dynamic
quantitative data in hierarchies - TimeEdgeTrees: At-
taching dynamic weights to tree edges. In Proceedings
of the International Conference on Information Visu-
alization Theory and Applications, pages 177–186.
Cornelissen, B., Holten, D., Zaidman, A., Moonen, L., van
Wijk, J. J., and van Deursen, A. (2007). Understand-
ing execution traces using massive sequence and cir-
cular bundle views. In Proceedings of International
Conference on Program Comprehension, pages 49–
58.
Diehl, S. and G
¨
org, C. (2002). Graphs, they are changing.
In Proceedings of Graph Drawing, pages 23–30.
Frishman, Y. and Tal, A. (2007). Online dynamic graph
drawing. In Proceedings of EuroVis, pages 75–82.
Garey, M. R. and Johnson, D. S. (1979). Computers
and Intractability: A Guide to the Theory of NP-
Completeness. W. H. Freeman.
Holten, D., Cornelissen, B., and van Wijk, J. J. (2007).
Trace visualization using hierarchical edge bundles
and massive sequence views. In Proceedings of VIS-
SOFT, pages 47–54.
Jerding, D. F. and Stasko, J. T. (1995). The information mu-
ral: a technique for displaying and navigating large in-
formation spaces. In Proceedings of INFOVIS, pages
43–50.
Jerding, D. F. and Stasko, J. T. (1998). The information mu-
ral: A technique for displaying and navigating large
information spaces. IEEE Transactions on Visualiza-
tion and Computer Graphics, 4(3):257–271.
Kruskal, J. and Landwehr, J. (1983). Icicle plots: Better
displays for hierarchical clustering. American Statis-
tician, 37(2):162–168.
Purchase, H. C., Hoggan, E., and G
¨
org, C. (2007). How
important is the “mental map”? – An empirical in-
vestigation of a dynamic graph layout algorithm. In
Proceedings of Graph Drawing, pages 184–195.
Rosenholtz, R., Li, Y., and Nakano, L. (2007). Measuring
visual clutter. Journal of Vision, 7(2):1–22.
Shneiderman, B. (1996). The eyes have it: A task by
data type taxonomy for information visualizations. In
Proceedings of the IEEE Symposium on Visual Lan-
guages, pages 336–343.
Stein, K., Wegener, R., and Schlieder, C. (2010). Pixel-
oriented visualization of change in social networks.
In Proceedings of the International Conference on Ad-
vances in Social Networks Analysis and Mining, pages
233–240.
Tufte, E. R. (1992). The visual display of quantitative in-
formation. Graphics Press.
van den Elzen, S., Holten, D., Blaas, J., and van Wijk,
J. (2013). Reordering massive sequence views: En-
abling temporal and structural analysis of dynamic
networks. In Proceedings of IEEE Pacific Visualiza-
tion Symposium, pages 33–40.
Vehlow, C., Burch, M., Schmauder, H., and Weiskopf, D.
(2013). Radial layered matrix visualization of dy-
namic graphs. In Proceedings of International Con-
ference on Information Visualisation, pages 51–58.
IVAPP2015-InternationalConferenceonInformationVisualizationTheoryandApplications
100
