
A Web-based Computer Aided Detection System for Automated
Search of Lung Nodules in Thoracic Computed Tomography Scans
M. E. Fantacci
1,2
, S. Bagnasco
3
, N. Camarlinghi
2
, E. Fiorina
3,4
, E. Lopez Torres
3,5
, F. Pennazio
3,4
,
C. Peroni
3,4
, A. Retico
2
, M. Saletta
3
, C. Sottocornola
1,2
, A. Traverso
3,6
and P. Cerello
3
1
Physics Department, Pisa University, Largo Pontecorvo 3, Pisa, Italy
2
Pisa Section of INFN, Pisa, Italy
3
Torino Section of INFN, Torino, Italy
4
Physics Department, Torino University, Torino, Italy
5
CEADEN, Havana, Cuba
6
Politecnico di Torino, Torino, Italy
Keywords: Computer Aided Detection, Lung Nodules, Thoracic Computed Tomography.
Abstract: M5L, a Web-based fully automated Computer-Aided Detection (CAD) system for the automated detection
of lung nodules in thoracic Computed Tomography (CT), is based on a multi-thread analysis with two
independent CAD subsystems, the lung Channeler Ant Model (lungCAM) and the Voxel-Based Neural
Analysis (VBNA), and on the combination of their results. The lungCAM subsystem is based on a model of
the capabilities that ants show in nature in finding structures, defining shapes and acting according with
local information. The VBNA subsystem is based on a multi-scale filter for spherical structures in searching
internal nodules and on the analysis of the intersections of surface normals in searching pleural nodules. The
M5L performance, extensively validated on 1043 CT scans from 3 independent datasets, including the full
LIDC/IDRI database, is homogeneous across the databases: the sensitivity is about 0.8 at 6-8 False Positive
findings per scan, despite the different annotation criteria and acquisition and reconstruction conditions. A
prototype service based on M5L is hosted on a server operated by INFN in Torino. Preliminary validation
tests of the system have recently started in several Italian radiological institutes.
1 INTRODUCTION
Lung cancer is one of the main public health issues
in developed countries, accounting for about 19%
and 28% of cancer-related deaths in Europe (Parkin,
2010) and the United States of America (American
Cancer Society, 2009), respectively, with a 5-year
survival rate of only 10–16% (Jemal, 2010). Lung
cancer most commonly manifests itself as non-
calcified pulmonary nodules. Computed
Tomography (CT) has been shown to be the most
sensitive imaging modality for the detection of small
pulmonary nodules: therefore low dose high
resolution CT-based screening trials are regarded as
a promising technique for detecting early-stage lung
cancers (Henschke, 1999). Recent results obtained
by the National Lung Screening Trial (NLST),
involving 53454 high-risk patients, show a 20%
reduction of mortality when the screening program
was carried out with the helical CT, rather than with
a conventional chest X-ray (NLST, 2011). The
design and operation of large scale lung cancer
screening programs is now being considered, with
the goal of maximizing their effectiveness and
minimizing their cost. The identification of early-
stage pathological objects in low dose high
resolution CT scans is a very difficult task for
radiologists, taking into account also the big (300-
400) number of noisy slices to be analyzed. To
support radiologists, researchers started the
development of CAD methods to be applied to CT
examinations (Camarlinghi, 2012; van Ginneken,
2010; Golosio, 2009; Gori, 2007; Li, 2003; Messai,
2010; Retico, 2009; Li, 2008). Several studies (Das,
2006; Brochu, 2007; Matsumoto, 2008) reported an
improvement in the sensitivity of radiologists when
assisted by CAD systems, in addition to a relevant
time saving. Other studies (Brown, 2005; Sahiner,
2009) observe that the increase in detection rate is
associated to an increase in the number of false-
213
E. Fantacci M., Bagnasco S., Camarlinghi N., Fiorina E., Lopez Torres E., Pennanzio F., Peroni C., Retico A., Saletta M., Sottocornola C., Traverso A.
and Cerello P..
A Web-based Computer Aided Detection System for Automated Search of Lung Nodules in Thoracic Computed Tomography Scans.
DOI: 10.5220/0005280102130218
In Proceedings of the International Conference on Bioinformatics Models, Methods and Algorithms (BIOINFORMATICS-2015), pages 213-218
ISBN: 978-989-758-070-3
Copyright
c
2015 SCITEPRESS (Science and Technology Publications, Lda.)

positive findings. In addition, CAD systems act as
detection rates equalizers between observers of
different levels of experience (Brown, 2005). This
paper aims at validating the M5L CAD, which
combines the lungCAM and VBNA subsystems, on
the largest and most heterogenous dataset available,
so as to evaluate its readiness for application as a
support for screening programs and clinical practice.
2 MATERIALS AND METHODS
2.1 The Datasets
Among the required features of a system for clinical
and screening applications is the capability to
provide a performance independent of the dataset
source: for that reason, two public research datasets
were analyzed, collected both from screening
programs and from clinical practice.
The Lung Image Database Consortium (LIDC)
and Image Database Resource Initiative (IDRI)
(Armato, 2011) provide the largest publicly
available collection of annotated CTs: 1018 CT
scans in the LIDC/IDRI database are publicly
available since 2011. LIDC/IDRI is a multi-center
and multi-manufacturer database, which includes a
heterogeneous set of cases, with data taken at
different collimation, voltage, tube current and
reconstructed slice thickness. It therefore provides a
general sample which is likely to realistically
represent the input from a large scale multi-center
screening program as well as clinical practice. In
order to capture the inter-reader variability the
LIDC/IDRI consortium provides, for each CT scan,
four annotations made by different expert
radiologists, obtained with a two phase reading
modality. The LIDC/IDRI annotations contain
nodules with diameter between 3 and 30 mm. The
contours of nodules were marked and each nodule
was classified by every reader on a 1−5 scale and
with nine subjective characteristics: subtlety,
internal structure, calcification, sphericity, margin,
lobulation, spiculation, texture, malignancy. The
central position of nodules with diameter <3 mm and
non-nodules/anomalies with diameter > 3mm was
also recorded.
The ANODE09 (van Ginneken, 2010) dataset
consists of 55 anonymized CT scans provided by the
Utrecht University Medical Center and originates
from the NELSON study, the largest lung cancer
screening trial in Europe. 5 CT scans are made
available together with the radiologist annotations
and can be used for training a CAD system; 50 scans
can only be used for a blind validation. Most of the
database was randomly selected; however some CTs
with a large number of nodules were deliberately
included. Data were acquired with low-dose
exposure settings: 30 mA at 120 (140) kV for patient
weighting less (more) than 80 kg. Axial images were
reconstructed as a set of 2D 512x512 matrix images
with an average thickness of about 0.7 mm. The
ANODE09 annotation protocol foresees the labeling
of relevant nodules for structures with a diameter
larger than 4 mm.
2.2 The LungCAM CAD
The lungCAM structure is a standard approach: the
preprocessing stage (equalization and lung volume
segmentation) is followed by a search for Regions
Of Interest (ROIs), an analytical filter and a neural
classifier. Before starting the actual analysis, CT
scans in DICOM standard format are preprocessed
to reduce the noise contribution: each 2D slice is
analyzed with a Savitzky-Golay filter (Rajagolopan,
2003) that provides noise reduction without loss of
resolution. From then on, every step of the
lungCAM algorithm is intrinsically 3-dimensional.
2.2.1 Lung Segmentation
The lung segmentation (De Nunzio, 2011) proceeds
according to four main steps: analysis of the CT
Hounsfield Unit level distribution and evaluation of
the intensity threshold to be applied in the following
stages; 3D region growing of the lung volume with
the detected threshold; wavefront algorithm for the
definition of the lung surface on the inner side and
the removal of the trachea and the main bronchi;
morphological closing with a cylinder from the out-
side in order to include pleural nodules and close the
holes left by vessels. A check on the training/testing
and validation datasets confirmed that none of the
radiological findings were rejected at this stage.
2.2.2 ROI Hunting
The segmentation algorithm is performed with the
Channeler Ant Model (CAM) (Cerello, 2010), based
on Virtual Ant Colonies and conceived for the
segmentation of complex structures with different
shapes and intensity range in a noisy 3D
environment. The CAM exploits the natural
capabilities of Virtual Ant Colonies to modify the
environment and communicate with each other by
pheromone deposition. The ant life cycle is a
sequence of atomic time steps, during which the
BIOINFORMATICS2015-InternationalConferenceonBioinformaticsModels,MethodsandAlgorithms
214

behavior is determined by a set of rules that control
the pheromone release, the movements and the
variations of the ant energy, a parameter related to
breeding and death. The lung internal structures are
segmented by iteratively deploying ant colonies in
voxels with intensity above a pre-defined threshold
(anthills). Ants live according to the model rules
until the colony extinction: the pheromone
deposition generates pheromone maps. Each voxel
visited by an ant during the life of a colony is
removed from the allowed volume for future ant
colonies. New ant colonies are iteratively deployed
in unvisited voxels that meet the anthill requirement.
By an iterative thresholding of pheromone maps a
list of ROI candidates is obtained. ROIs with a
radius larger than 10 mm are post-processed in order
to disentangle nodules attached to internal lung
structures like vessels and bronchi. The CAM is
iteratively deployed in the right and left lungs,
separately, as a segmentation method for the vessel
tree and the nodule candidates. The first ant colony
segments the vessel tree, starting from an anthill in
the vicinity of its root. The segmented object is then
removed from the original image and the coordinates
of all its voxels are stored as a single Region Of
Interest (ROI). In the remaining image, iteratively,
any voxel with intensity above a predefined
threshold (-700 HU) is a new anthill and a colony
deployed from there generates a pheromone image.
When no more voxels meet the condition to become
an anthill, the information provided by the global
pheromone map is analyzed. The pheromone map
analysis is also iterative: each voxel with a
pheromone content above a minimum accepted
value is used as a seed for a region growing with an
adaptive threshold which is iteratively lowered until
a minimum growth rate of the region is reached.
Every grown region with a radius in the 0.8 − 25
mm range is considered as a nodule candidate.
About 20% of relevant pulmonary nodules are seg-
mented together with a vascular structure they are
connected to. If features were evaluated for the
whole ROI, these nodules would typically be
rejected by further filtering and classification. In
order to address the problem a dedicated algorithm
module was developed. All the structures obtained
from the pheromone map analysis with radius larger
than 10 mm are further analyzed in order to identify
and disentangle spherical-like sub-structures. The 10
mm value was empirically set based on the
minimum size for attached structures that causes a
relevant change in the ROI feature values. Each
voxel that belongs to the structure being analyzed is
averaged with the neighbors inside a sphere of
radius R. Then, the average map is thresholded
again, resulting in a thinner object. Structures with a
diameter smaller than R disappear (e.g., thin vessels
attached to the nodules). However also the nodules
shrink. In order to recover the nodule original size,
the neighbors of each remaining voxel in the average
inside a sphere of radius R/2 with value above 4/3 of
the threshold in the original map are restored as part
of the structure. The procedure is repeated three
times, with spheres of increasing radius (R = 1.5,
2.5, 3.5 mm) that generate sub-structures of
increasing size. The output voxels of the three
iterations are combined in logical OR to generate a
final nodule candidate output mask, which is then
treated as a ROI for further analysis.
2.2.3 Filtering and Classification
The choice of a suitable set of ROI features is a key
to the success of the filtering and classification
stages. Ideally, any computable quantity which is
expected to show a different pattern for true nodules
and false candidates would be a useful feature.
However, the use of a large number of features on a
small training dataset could bias the classifier and
cause a loss of generality. The choice to select a
small number of features for the neural classifier
training aims at optimizing the generality and
keeping the performance stable as the validation
dataset size increases. A set of features was selected
for the nodule candidate analysis, according to the
following criteria: 3D spatial features which are
invariant to rotation and translation and can
disentangle spherical-like structures from ROIs
originating from vessel parts or lung walls; features
based on the voxel HU intensity, so as to capture
density patterns; the fraction of ROI voxels attached
to the walls of the lung volume is crucial in
distinguishing internal and juxta-pleural nodules,
which are characterized by a different shape;
therefore, its use allows the classification of both the
subsamples with the same neural network. The list
of features is reported in Table 1. The average
number of ROIs after the nodule hunting, depending
on the number of slices, ranges between several
hundreds to few thousands per CT scan, a number
far too large to be used as input for a neural network
classifier. The vast majority of findings is easily
rejected with an analytical filter based on
correlations between the radius, the sphericity and
the fraction of voxels connected to the lung mask. In
addition to the sphericity-related selection, two other
filtering conditions were applied to the nodule
candidates: the fraction of voxels connected to lung
AWeb-basedComputerAidedDetectionSystemforAutomatedSearchofLungNodulesinThoracicComputed
TomographyScans
215

surface is required to be less than 0.6 and the Radius
must be larger than 1.2 mm. Irregular structures are
filtered with these criteria. The CT equalization and
filtering procedure dramatically reduces the average
number of FP findings per scan, from about 1000 to
about 50, a value which is appropriate as input for
training and running a neural classifier. The filtering
process also reduces the pre-classification sensitivity
to about 75 − 90%, depending on the input dataset.
Table 1: List of features extracted from the nodule output
mask. Features labeled with the asterisk were not used in
the classification stage.
Geometrical features Intensity-related features
Center of gravity Xi=x,y,z(*) Average
Radius (mm) Average outside mask
Sphericity Std. Deviation
Skewness of distance from Xi Std. Deviation outside mask
Kurtosis of distance from Xi Maximum
Volume (mm3) (*) Entropy
Fraction of voxels connected to
the pleura
Entropy outside mask
A feed forward neural network (FFNN) was
selected as nodule candidate classification method.
The training sample was made of 5 and 69 CTs from
the ANODE09 and LIDC/IDRI databases,
respectively. The training was carried on in cross-
validation mode. The FFNN configuration was
defined as follows: 13 input neurons, 1 hidden layer
with 25 neurons and 1 neuron in the output layer,
representing the probability of the finding to be
relevant.
2.3 VBNA CAD
The VBNA CAD system deals differently with
internal and juxtapleural nodules, by means of two
dedicated procedures: CADI for internal and CADJP
for juxtapleural nodules (Camarlinghi, 2012; Retico,
2008; Retico, 2009; Camarlinghi, 2011). Both are
three-step procedures. The first step consists in the
lung segmentation; the second step consists in the
ROI (Region Of Interest) hunter and performs the
candidate nodule selection; the third step consists in
the FP reduction. For the last step, an original
procedure, the Voxel-Based Neural Approach is
implemented to reduce the number of FPs in the lists
of internal and juxtapleural candidate nodules.
2.3.1 Segmentation
The aim of the segmentation algorithm implemented
in our analysis is to allow a conservative
identification of the internal region of the lung
parenchyma. In this region we apply the algorithm
for internal nodule detection. The 3-dimensional
segmentation algorithm is based on four main steps.
Once the scans have been isotropically resampled, to
separate the low-intensity lung parenchyma from the
high-intensity surrounding tissue (fat tissue and
bones), the voxel intensities are thresholded at a
fixed value; then, in order to discard all the regions
not belonging to the lungs, the biggest connected
component not crossing the boundary of the volume
is considered. Vessels and airways are not in
included in the segmented lung at this stage since
their volume is outside the segmented lung volume.
To include them without modifying the pleura
surface morphology, i.e. without modifying the
shape of pleura irregularities (including juxtapleural
nodules), a combination of morphological operators
is applied. In particular, a sequence of the dilation
and the erosion operators with spherical kernels rd
and re, with re > rd, is implemented. Finally, the
logical OR operation between the so obtained mask
and the original lung mask provides the final mask
P, where the vessels and the airway walls are filled
in, while maintaining the original shape of the lung
border. The identified lung mask is used for CADI,
whereas its boundary is used for CADJP.
2.3.2 ROI Hunting for Internal Nodules
In the CADI, the internal nodules are modeled as
spherical objects with a Gaussian profile, following
the approach proposed in (Li, 2003). To detect this
kind of objects (Retico, 2008), a dedicated dot-
enhancement (DE) filter is implemented. The filter
determines the local geometrical characteristics of
each voxel by using the eigenvalues of the Hessian
matrix. To enhance the sensitivity of this filter to
nodules of different sizes, a multi-scale approach has
to be followed. This approach combines the DE
function with Gaussian smoothing at several scales
with the prescriptions given in (Li, 2003). Local
maxima of the matrix filtered by the dot-
enhancement are the internal candidate nodule
locations.
2.3.3 ROI Hunting for Juxta-Pleural
Nodules
In the CADJP (Retico, 2009), in order to identify
juxtapleural candidate nodules, pleura surface
normals are constructed and each voxel is assigned a
score proportional to the number of normals
intersecting in it. Normals are evaluated using the
triangular mesh representing the pleura surface,
obtained applying the marching cube algorithm on
BIOINFORMATICS2015-InternationalConferenceonBioinformaticsModels,MethodsandAlgorithms
216

the lung mask. In particular, the normal to each
triangle is calculated by using the vector product
between the triangle edges; then, the normals to each
mesh vertex are evaluated averaging all the triangle
normals of the neighboring triangles. Since the
evaluation of the normal intersections in the real 3D
space is a complex and computationally intensive
operation, it is implemented in the voxel space. This
means that each voxel is associated a score
proportional to the number of normals passing
through it. To deal with noise, cylinders with
Gaussian profile are considered instead of segments
(Paik, 2004). This information is collected in the
score matrix S(x,y,z). The local maxima of the 3D
matrix S(x,y,z) are the juxtapleural candidate nodule
locations.
2.3.4 Classification
In order to classify the candidate nodule findings
obtained in the previous step, an original procedure,
the Voxel-Based Neural Approach (Gori, 2007),
performs the reduction of the number of FPs in the
lists of internal and juxtapleural candidate nodules.
First, a ROI including voxels belonging to the
candidate nodule is defined from each location
provided by the previous step. The basic idea of the
VBNA is to associate with each voxel of a ROI a
feature vector defined by the intensity values of its
3D neighbors (in this case 5 x 5 x 5 intensity values)
and the eigenvalues of the gradient matrix and of the
Hessian matrix. In the firsta version of VBNA, che
classification procedure was perfoermed by means
of a FFNN. Now support vector machines (SVM),
by which have been obtained better resukts, are
implemented for the classification procedure. Other
classification methods have not yet already been
tested. The training sample was made of 69 CTs
from the LIDC/IDRI database. At the end of this
step, each ROI is assigned a degree of suspicion
averaging the score of all the voxels belonging to it.
2.4 Subsystems Combination: the M5L
CAD
Each CAD subsystem can be improved in the future,
working on specific weaknesses. However, one
quick and effective way to improve the overall
performance is to combine the results, as
demonstrated in (van Ginneken, 2010) for the
ANODE09 challenge participants. The outputs of
the two CAD subsystems described are evaluated
and combined following the same procedure adopted
for the ANODE09 study (van Ginneken, 2010). The
resulting CAD system is referred to as M5L. The
findings of each CAD subsystem must be considered
in terms of their degree of suspicion p, which is the
final output of the procedure of candidate nodules
classification for the two separate subsystems.
In order to combine findings from different CAD
subsystems, a normalization of the finding
probabilities is needed (Niemeijer, 2011). This
operation is carried out by associating a new value
f(p) to each finding with degree of suspicion p. The
new degree of suspicion f(p) is evaluated according
to the performance obtained by the corresponding
CAD system on the validation set, i.e., evaluating
for each finding with probability p the function
corresponding to TP/(FP+TP+1), where TP(FP) is
the number of true (false) positives obtained by
considering all the CAD findings with pi>=p. Of
course, this procedure requires to know the
annotations and the performance of each CAD
system on a selected set of data.
The f(p) values can
therefore be considered as the score related to the
probability that a finding in the validation set with
likelihood p or higher represents a true nodule. The
function f(p) is computed for every finding from
every subsystem. All findings are then checked
against a “matching condition” defined by a
preselected clustering distance.
3 RESULTS
The results have been evaluated in terms of FROC
(Free-response Receiver Operating Characteristic)
curves. In fact, Receiver Operating Characteristic
(ROC) methodology is widely used in evaluating
medical imaging modalities but has several
drawbacks when the detection task, e.g., nodule
detection, involves localizing the abnormality, while
FROC methodology offers a more natural
framework to describe observer performance in such
studies and has other advantages (Chakraborty,
1989).
Figure 1 shows the results obtained for the
lungCAM and VBNA separate subsystems and for
the combined M5L on the 949 scans of the LIDC
test dataset (949 scans). To obtain the combined
M5L result the following matching criterion has
been used: a CAD finding is considered a true
positive if its Euclidean distance from the center of
the lesion annotated by the radiologists is less than
1.5 times the radius of the annotated lesion. The
M5L sensitivity at 8 FP/scan reaches 80% which,
given the size and heterogeneity of the dataset, is
AWeb-basedComputerAidedDetectionSystemforAutomatedSearchofLungNodulesinThoracicComputed
TomographyScans
217
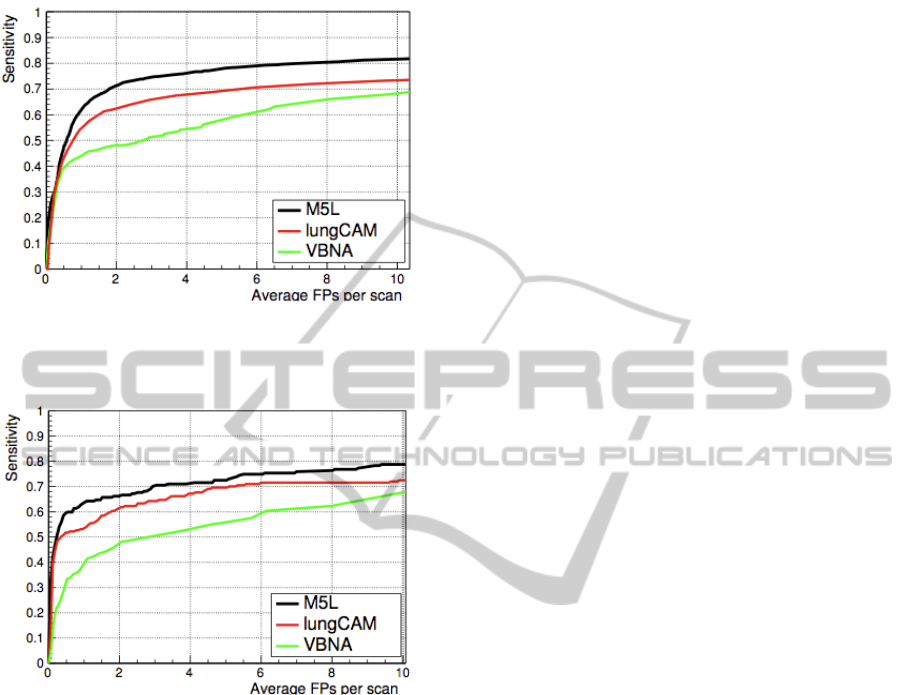
quite remarkable. In the case of ANODE09 the
FROC curves are shown in Figure 2.
Figure 1: FROC curves of the lungCAM and VBNA
subsystems ad of their M5L combination on the LIDC test
validation dataset (949 CT scans).
Figure 2: FROC curves of the lungCAM and VBNA
subsystems ad of their M5L combination on the
ANODE09 test validation dataset (50 CT scans).
4 CONCLUSIONS
The results, obtained on a database so large and
heterogeneous, are very satisfactory. One of the
main purposes of this work was to show that, even
without changing parameters and making
optimizations, the performance is satisfactory. In
fact we applied a previous training configuration to a
much larger and heterogeneous dataset (the full
LIDC/IDRI). In view of a future application of the
M5L CAD in screening programs or clinical
practice, the optimization can be achieved by
iteratively using training samples of increasing size.
Furthermore, demonstrating a generalization
capability is, at the present development stage, even
more important than optimizing the sensitivity on a
selected dataset. The M5L CAD has been already
implemented in a cloud computing environment
(Berzano, 2012) and is now available for the
radiologists of our collaboration as experimental
web service for clinical tests.
REFERENCES
Parkin, D. et al., 2010. Int J Cancer, 127(12), 2893.
American Cancer Society, 2009. Cancer Facts and
Figures.http://www.cancer.org/Research/CancerFacts
Figures.
Jemal, A. et al., 2010. CA Cancer J. Clin. 60, 277.
Henschke, C. et al., 1999. Lancet, 354(9173), 99.
The NLST (National Lubg Screening Trial) Research
Team, 2011. N. Engl. J. Med. 365, 395.
Camarlinghi, N. et al., 2012. Int. J. Comput. Assist.
Radiol. Surg. 7, 455.
Van Ginneken B. et al., 2010. Med. Image Anal. 14, 707.
Golosio, B. et al., 2009. Med. Phys. 36, 3607.
Gori, I. et al., 2007. Proceedings of the SPIE Medical
Imaging Conference 6514, 6514R.
Li, Q. et al., 2003. Med. Phys. 30, 2040.
Messay, T. et al., 2010. Med. Image Anal. 14, 390.
Retico, A. et al., 2009. SPIE Medical Imaging 2009:
Computer-Aided Diagnosis, 7260, 72601S.
Li, Q. et al., 2008. Acad. Radiol. 15, 165.
Das, M. et al., 2006. Radiology 241, 564.
Brochu, B. et al., 2007. Journal de Radiologie 88, 573.
Matsumoto, S. et al., 2008. Radiation Medicine 26, 562.
Brown, M.S. et al., 2005. Acad. Radiol. 12, 681.
Sahiner, B. et al., 2009. Acad. Radiol. 16, 1518.
Armato III, S.G. et al., 2011. Med. Phys. 38, 915.
Rajagolopan S. et al., 2003. Proc. SPIE Medical Imaging
5029, 773.
De Nunzio, G. et al., 2011. Journal of Digital Imaging 24,
11.
Cerello, P. et al., 2010. Pattern Recognition 43, 1476.
Retico, A. et al., 2008. Comput. Biol. Med., 38(4), 525.
Retico, A. et al., 2009. Comput Biol Med 39(12), 1137.
Camarlinghi, N. et al., 2011. Il Nuovo Cimento, 1, 65.
Paik, S.D. et al., 2004. IEEE Trans Med Imaging 23(6),
661.
Niemeijer, M. et al., 2011. IEEE Trans Med Imaging
30(2), 215.
Chakraborty, D., 1989. Med. Phys. 16, 561.
Berzano, D. et al., 2012. IEEE Nuclear Science
Symposium and Medical Imaging Conference Record
(NSS/MIC), 968.
BIOINFORMATICS2015-InternationalConferenceonBioinformaticsModels,MethodsandAlgorithms
218
