
Improving Performance of Bio-radars for Remote Heartbeat and
Breathing Detection by using Cyclostationary Features
Daniel Malafaia, José Vieira and Ana Tomé
IEETA, Universidade de Aveiro, Aveiro, Portugal
Keywords:
Signal Detection, Cyclostationarity, Bio-radar, Software Defined Radio, Cognitive Radar.
Abstract:
In this paper we present a continuous wave radar created using a software defined radio platform that uses
doppler effect to measure the heart-rate and breathing. The measurements are evaluated using a classic energy
detection method and a cyclic spectrum estimation technique, then the two methods are compared. The results
show that by taking advantaging of the cyclic autocorrelation of the bio-signals we can get better detection
than the usual energy detection.
1 INTRODUCTION
Bio-radar technology aims the combination of the
radar and biomedical measurements to achieve the de-
tection of vital signals (such as respiration and heart-
beat) without using electrodes or sensors. The use
of this wireless method to gather bio-signals allows a
variety of applications such as medical monitoring of
contagious patients, wireless stress measurement and
even, with high transmitted powers, surveillance and
rescue missions where bio-radars would allow to lo-
cate trapped people under debris.
The development of bio-radars have been follow-
ing two strategies: Continuous Wave (CW) Radar and
Ultra Wide-band (UWB) Radar(Zhang et al., 2012).
The CW was the first method for bio-radars, been first
proposed in 1978 and different hardware has been de-
veloped since then(Griffin, 1978).As the transmitter is
continuously broadcasting the total power on the tar-
get is maximized. In the other hand UWB radar uses
repeated pulses witch allows to obtain extra informa-
tion about the position of the target, that is impossible
to obtain in a CW radar.
There has been a large and fast development in the
area of SDR where versatile and portable hardware
platforms can be found. The SDR is a highly config-
urable platform where the majority of the processing
is achieved digitally. The input (receiver) and the out-
put (transmitter) parts of the SDR are reconfigurable
in order to allow the use a wide band of the spectrum.
The usage of a SDR as an radar allows for the
development of cognitive radars(Haykin, 2006), this
kind of radars can be aware of the environment and
make an intelligent use of the spectrum allowing the
usage of multiple radars without cross interference as
we can allocate a different frequency for each one.
2 DOPPLER RADAR FOR
BIO-SIGNALS
2.1 How the Doppler Radar Works
A doppler radar is a system that by directing a mi-
crowave signal to an object that is not stationary and
listening to the reflexion can infer it movement char-
acteristics by analyzing how the frequency of the sig-
nal sent was altered by the object’s motion. This fre-
quency variation is due to the Doppler Effect and is
described by
f
r
= f
t
(1 + v/c)
(1 − v/c)
(1)
where f
t
is the transmitted frequency, f
r
is the shifted
frequency due to the Doppler Effect, v is the object
speed and c is the speed of light.
This shift in frequency can also be seen as a phase
difference between the transmited and recieved sig-
nal. So if an object is at a d
o
distance the phase dif-
ference φ of the generated signal and the received is
given by,
φ =
2d
o
2π
λ
(2)
344
Malafaia D., Vieira J. and Tomé A..
Improving Performance of Bio-radars for Remote Heartbeat and Breathing Detection by using Cyclostationary Features.
DOI: 10.5220/0005287603440349
In Proceedings of the International Conference on Bio-inspired Systems and Signal Processing (BIOSIGNALS-2015), pages 344-349
ISBN: 978-989-758-069-7
Copyright
c
2015 SCITEPRESS (Science and Technology Publications, Lda.)

where λ is the wavelength of the transmitted signal.
If an object is then changing it’s position then the dis-
tance change will be perceived by the radar as a phase
variation.
2.2 Doppler Detection in a CW
Bio-radar
In a CW bio-radar the system is constantly transmit-
ting a sinusoid in the direction of the target, then this
signal will be reflected by the person. Therefore any
small movements of the chest will introduce phase
changes on the refleced signal accordingly. These
changes are then going to be small if the chest is in-
flated and larger if the chest is deflated. The signal
received is then mixed with the original sinusoid in
order to compare the two phases.
Figure 1: Bio-radar taking advantage of the doppler effect
to detect the movement of the chest.
Considering the transmited signal , T(t) =
cos[2π f t +φ(t)] with f the frequency of operation and
where φ copes the unavoidable phase noise. As show
in Figure 1 this signal is transmitted to the subject at
a distance d
0
from the device. The reflected signal
is modulated by the physiological movement x(t) (as
the heartbeat and respiration). If we neglect amplitude
variations, we will have the following equation for the
received signal in our bio-radar(Li et al., 2013),
R(t) ≈ cos[2π f t −
4πd
0
λ
−
4πx(t)
λ
+ φ(t −
2d
0
c
)] (3)
where c will be our wave electromagnetic speed and λ
it’s wavelength. So the received signal is then a time
delayed version of the transmitted signal with a phase
modulation created by periodic motions of the target.
At the receiver the signal is demodulated back to the
baseband,
B(t) = cos[θ +
4πx(t)
λ
+ ∆φ(t)] (4)
where θ = 4πd
o
/λ + θ
o
is given by the subject dis-
tance and the θ
0
phase shift at the reflection surface.
The ∆φ(t) = φ(t) − φ(t − 2d
o
/c) is then the residual
oscillator phase noise. By then analyzing the angle,
every parameter will be constant except to the vary-
ing physiological movement and the phase noise. Has
we want only to acquire the bio-signals we can then
filter the angle according with the signal that we want
to obtain.
Usually the common human values for this kind
of signals are for the respiration 0.1Hz to 0.8Hz and
for the Heart Rate 0.8Hz to 2Hz (Hø st Madsen et al.,
2008). The result of applying two filters in order to
adquire the two cardiorespiratory signals, to the angle
of B(t) in a typical test is seen in Figure 2.
Figure 2: Signals obtained by a Bio-Radar.
The breathing pattern has a higher amplitude value
than the heartbeat, this is due to the large movement of
the torso during the breathing that is relatively greater
than the slightly movements produced by the beat of
the hearth. Also is visible the almost constant period-
icity of the two, with a lower period to the heartbeat
and higher one for the respiration.
3 CYCLOSTATIONARITY BASED
DETECTION
3.1 Detection of Bio Signals using
Cyclostationarity
As the cardiorespiratory signals show periodicity in
their behavior we can then take advantage of this char-
acteristic in order to achieve a better detection. One
way to analyze this periodic signals, and as they show
an approximately periodic auto-correlation is to use a
cyclostationarity analysis methods.
In order to identify the presence of a cyclostation-
ary digital signal in a given sampled spectrum we
usually use two mathematical operations, cyclic au-
tocorrelation and cyclic spectrum. These two meth-
ods will show unique features when in presence of a
cyclostationary-based signal.
ImprovingPerformanceofBio-radarsforRemoteHeartbeatandBreathingDetectionbyusingCyclostationaryFeatures
345

3.2 Basic Notions of Cyclic
Autocorrelation
To understand cyclic autocorrelation we first need to
define what’s correlation. Correlation is a mathemat-
ical operation that allows us to measure the degree
to which two signals are similar and is the expected
value of the inner product of the two signals. For the
autocorrelation the procedure is similar, but instead of
having two different signals we use the inner product
of the signal with itself at a different time. We know
by the definition of a cyclostationary signal that the
autocorrelation of a signal,R
x
, is periodic, lets define
that period by being T
0
and the lag being τ, then:
R
x
(t + T
0
,τ) = R
x
(t,τ) (5)
If a periodic correlation exits then it can be proved
(Gardner et al., 2006) that x(t) and it’s frequency-
shifted version x(t)e
j2πn/T
0
t
are correlated for any n ∈
Z.Then we can define the cyclic autocorrelation be-
ing:
R
α
x
(τ) , E{x(t + τ)x
∗
(t)e
− j2παt
} (6)
with α = n/T
0
and ∗ being the conjugate. Expanding
the equation we have:
R
α
x
(τ) = lim
T →∞
1
T
Z
T
0
x(t + τ)x
∗
(t)e
− j2παt
dt (7)
Now as we have a cyclostationary signal with a pe-
riodic autocorrelation in T
0
we don’t need to integrate
the inner product of the signal with itself delayed to
infinity as we did in (7), we can limit it to T
0
:
R
α
x
(τ) =
1
T
0
Z
T
0
0
x(t + τ)x
∗
(t)e
− j2παt
dt (8)
It’s possible now to detect if a stochastic process
x(t) exhibit cyclostationarity at the cycle frequency α
if R
α
x
(t) 6= 0 (Gardner et al., 2006).
3.3 Discrete Time Cyclic
Autocorrelation
For a computational implementation we need a dis-
crete time cyclic autocorrelation function as we are
going to use discrete values. So from (7) we can then
derive the discrete time cyclic autocorrelation that is:
R
α
x
(τ) = lim
N→∞
1
N
N−1
∑
n=0
x(n + τ)x
∗
(n)e
− j2παn
(9)
where N is the number of samples that we are us-
ing. As in pratical usage we are going to use a limited
number of samples we then remove the limit from the
equation and we have the aproximation:
e
R
α
x
(τ) =
1
N
N−1
∑
n=0
x(n + τ)x
∗
(n)e
− j2παn
(10)
Note that R
α
x
(t) can be computed efficiently using
the FFT of the product x(n + τ)x
∗
(n) (Madisetti and
Williams, 1999).
3.4 Cyclic Spectrum
Another tool for analyzing cyclostationarity is the
cyclic spectrum. To derive this function we do some-
thing very similar to the Wiene-Khinchin theorem
(Gardner et al., 2006) but applied to cyclic autocor-
relation from (7). The cyclic spectrum is then:
e
S
α
x
( f ) =
1
N
N−1
∑
n=0
e
R
α
x
(τ)e
− j2π f τ
(11)
with f = ±α/2. That, once again, is nothing more
than the Fourier Transform of the cyclic autocorre-
lation and can be calculated with a two dimensional
FFT of the previously calculated cyclic autocorrela-
tion.
4 PRACTICAL EXPERIMENT
4.1 System Setup
The main part of this bio-radar system is the B200, a
software defined radio system developed by Ettus that
allows full duplex use, so we can send and receive RF
signals at the same time, making it a good choice for
a CW radar.
Figure 3: USRP B200 board.
This board uses the Analog Devices AD9364 chip
that concentrates almost all the RF front-end, with
mixers for the Rx and Tx with incorporated VCO and
PPL that share the same reference clock,
BIOSIGNALS2015-InternationalConferenceonBio-inspiredSystemsandSignalProcessing
346

Figure 4: RF frontend of B200.
this allow for homodyne detection allowing to
avoid any fluctuations in the mixer frequency.
In order to maximize the gain and reduce noise,
we connected to the B200 two directional antennas.
Figure 5: The bio-radar system.
The whole system will then operate as a CW radar
at the frequency of 2.7GHz with a emitting power of
approximately 5mW with the minimum sampling fre-
quency allowed by the system of 62.5kSPS.
The B200 has an automatic DC rejection system,
so if we want to share the same frequency on the trans-
mitter and receiver we need to slight offset in the fre-
quency our emitted wave, for this purpose a digital
∆ = 1kHz sinusoid is generated and then passed to
analog trough the DAC and mixed with the 2.7GHz
carrier, then allowing for the system to use the same
central frequency both mixers.
At the receiver the ADC will be running at
62.5KSPS sampling 62.5KHz of the 2.7GHz centered
spectrum.At digital domain we got a digital down
converter that will pass our signal to the baseband,
removing the 1KHz offset added in order to avoid the
DC rejection system. At the base band we then work
with start working with the phase of the signal, by fil-
Figure 6: System Diagram.
tering it trough a anti-aliasing low pass filter and dec-
imating by 2500 in order to get a 25Samples/s signal.
We then filter this signal trough two band-pass filters,
one in order to obtain the breathing from 0.1Hz to
0.8Hz and another for the Heart Rate from 0.8Hz to
2Hz. The filters used are 1000-order hanning finite
impulse response.
The person under test will then be seated at ap-
proximately 1meter from the system, facing frontally
to the directional antennas.
4.2 Procedure
After the initial setup of the system and with the per-
son seated we start recording. The subject is asked
to breath 3 times and then stay in apnea as longer as
possible to then breath normally. After that, the sub-
ject will then leave the range of the system and do
some fast paced exercise for about 20 seconds. When
the exercise is finished the evaluation resumes and the
subject is asked again to breath 3 times, stay in apnea
as longer as possible and then breath normally.
Figure 7: Standard testing used in this article.
4.3 Results
By using samples at the output from the heartbeat
band-pass filter we can then test the detection meth-
ods in order to compare the performace of both.Two
methods were tested:
• Cyclostationary detection: the cyclic spectrum of
the signal is calculated and the frequency with
ImprovingPerformanceofBio-radarsforRemoteHeartbeatandBreathingDetectionbyusingCyclostationaryFeatures
347
higher value give us the frequency of the signal.
• Classic energy detection: we use a energy detec-
tion in frequency, where we search for a peak in
the DFT of the data.
To obtain the features that we will use for the cy-
clostationary detection we used the cyclic spectrum
in a part of the signal where the subject is in apnea
at 68bpm to obtain the heartbeat features. For the
breathing pattern the we use the part of the signal after
the first apnea.
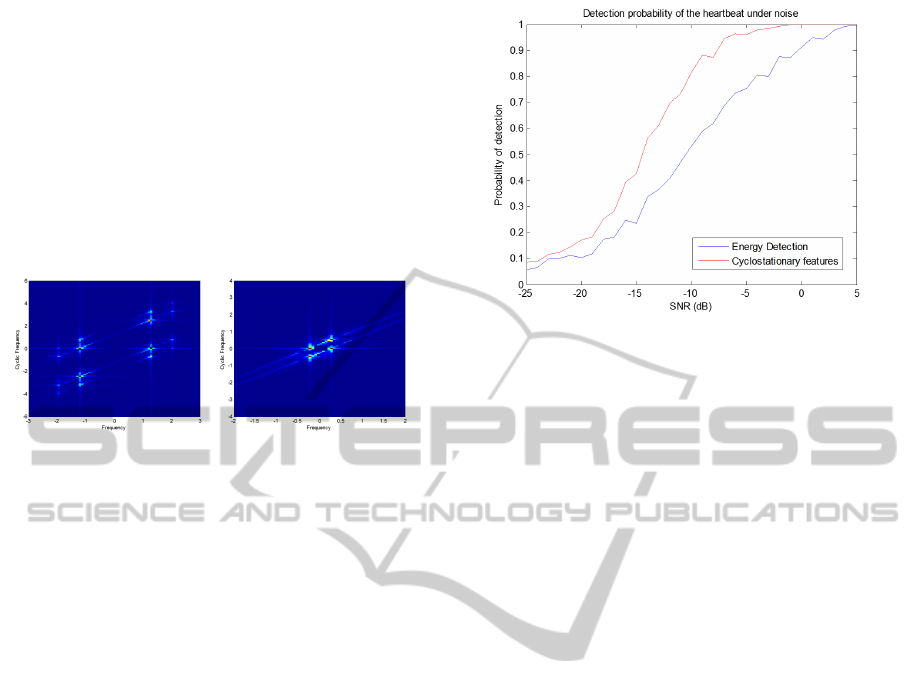
Figure 8: Cyclic spectrum for the heartbeat(in the left) and
for the breathing (on the right).
We will compare the performance for the hardest
signal to detect, the heartbeat, but the same procedure
can be demonstrated, with similar results, for the res-
piratory signal.
To detect the heartbeat frequency from the cyclic
spectrum we locate the maximum value at the cyclic
spectrum plane instead of using a traditional energy
detection method where we detect the peak of the
DFT of the signal.
To prove that the cyclostationary method shows
better results than a traditional energy detection in fre-
quency, white gaussian noise is digital added at the
signal in order to simulate various SNRs situations.
In order to simulate the behavior of the system un-
der various SNR levels, we first calculate the SNR of
the acquired heartbeat signal, that in our case is near
10dB. Once we have this value we can calculate the
power that the digitally added white gaussian noise
needs to have in order to simulate a determined SNR,
P
anoise
= 10log
10
(−10
SNR
o
/10
+ 10
SNR
e
/10
) − P
signal
(12)
where SNR
o
is the SNR of the original signal,
SNR
e
the SNR that we want to achieve, P
signal
is the
power of the bio-signal and finally the P
anoise
is the
power of the noise that we need to add.
By using Monte Carlo method we determined the
probability of detect the same heartbeat frequency as
the original signal shows but for various SNR levels.
This procedure used 550 samples at 25SPS of a re-
laxed person at 68bpm for 5 to -25dB of SNR each
one tested 500 times for added gaussian white noise.
Figure 9: Performance comparative of both methods.
The comparison is the following,
It’s visible that the cyclostationary based detection
show better results than energy detection. For proba-
bilities of detection higher than 80% we are looking
for improvements in the order of 6dB.
5 CONCLUSIONS
It’s feasible to use a software defined radio to build a
bio-radar and acquire both respiration and heartbeat.
This open doors to the use of commercial Software
Defined Radios has a platform to implement Cogni-
tive Bio-Radars. The results show that a cyclosta-
tionary analysis based on the cyclic spectrum improve
performance on this type of radars comparatively to
simple energy detection schemes. The performance
could be further improved by using a digital phase-
locked loop system.
REFERENCES
Gardner, W. a., Napolitano, A., and Paura, L. (2006). Cy-
clostationarity: Half a century of research. Signal Pro-
cessing, 86(4):639–697.
Griffin, D. W. (1978). MW interferometers for biological
studies. Microwave Journal, 21:69–71.
Haykin, S. (2006). Cognitive radar: a way of the future.
IEEE Signal Processing Magazine, 23(1):30–40.
Hø st Madsen, A., Petrochilos, N., Boric-Lubecke, O.,
Lubecke, V. M., Park, B.-K., and Zhou, Q. (2008).
Signal Processing Methods for Doppler Radar Heart
Rate Monitoring. In Signal Processing for Knowledge
Extraction and Information Fusion. Springer-Verlag.
Li, C., Lubecke, V. M., Member, S., Boric-lubecke, O.,
and Lin, J. (2013). A Review on Recent Advances
in Doppler Radar Sensors for Noncontact Healthcare
Monitoring. 61(5):2046–2060.
BIOSIGNALS2015-InternationalConferenceonBio-inspiredSystemsandSignalProcessing
348

Madisetti, E. V. K. and Williams, D. B. (1999). Giannakis ,
G.B. "Cyclostationary Signal Analysis". chapter 17.
Zhang, Y., Jiao, T., Jing, X., Li, Z., Li, S., Yu, X., Lv, H.,
Zhang, Z., and Wang, J. (2012). A detecting and iden-
tifying method for two stationary human targets using
single-channel ultra-wideband radar. EURASIP Jour-
nal on Advances in Signal Processing, 2012(1):202.
ImprovingPerformanceofBio-radarsforRemoteHeartbeatandBreathingDetectionbyusingCyclostationaryFeatures
349
