
Image-based Ear Biometric Smartphone App for
Patient Identification in Field Settings
Sarah Adel Bargal
1
, Alexander Welles
2
, Cliff R. Chan
3
, Samuel Howes
2
, Stan Sclaroff
1
,
Elizabeth Ragan
4
, Courtney Johnson
4
and Christopher Gill
4
1
Computer Science Dept., Boston University, Boston, MA, U.S.A.
2
Computer Engineering Dept., Boston University, Boston, MA, U.S.A.
3
Electrical Engineering Dept., Boston University, Boston, MA, U.S.A.
4
School of Public Health, Boston University, Boston, MA, U.S.A.
Keywords:
Smartphone, Application, Public Health, Biometrics.
Abstract:
We present a work in progress of a computer vision application that would directly impact the delivery of
healthcare in underdeveloped countries. We describe the development of an image-based smartphone appli-
cation prototype for ear biometrics. The application targets the public health problem of managing medical
records at on-site medical clinics in less developed countries where many individuals do not hold IDs. The
domain presents challenges for an ear biometric system, including varying scale, rotation, and illumination. It
was not clear which feature descriptors would work best for the application, so a comparative study of three
ear biometric extraction techniques was performed, one of which was used to develop an iOS application
prototype to establish the identity of an individual using a smartphone camera image. A pilot study was then
conducted on the developed application to test feasibility in naturalistic settings.
1 INTRODUCTION
Tracking medical data in regions where conventional
forms of patient identification are lacking or poorly
maintained can pose unique challenges for medical
professionals. For example, in less developed coun-
tries, ID numbers may not be present and address and
name spellings may be inconsistent. When patient
identity cannot be reliably determined, undesired con-
sequences such as treatment duplication and disrup-
tion of longitudinal patient care may occur.
Biometrics can be used for tracking identity in the
global health application scenario. Fingerprinting, fa-
cial recognition, iris scanning, and palm-printing are
not optimally suited for this application domain. If
fingerprints are used to identify patients, then this may
discourage individuals from seeking medical care due
to the widespread use of fingerprinting in law enforce-
ment. Facial recognition raises privacy concerns: in
(Azfar et al., 2011), 58% of 89 HIV patients said that
face photography is acceptable for teledermatology
care, whereas acceptability is above 90% for photog-
raphy of other body parts. Iris scanning requires user
cooperation in viewing iris reflection (Delac and Gr-
gic, 2004); this can be difficult for children. Palm
printing and fingerprinting raise hygiene issues due to
many people touching the same surface.
In this work we use ear biometrics. Ears can be
photographed without an invasive or uncomfortable
procedure. The image capture process is contactless,
and therefore no hygiene problems arise. Photograph-
ing the ear is not associated with the stigmatizing ef-
fects of photographing the face or taking fingerprints.
Ear shape does not change significantly with age (af-
ter the first two to three years of life) (Iannarelli,
1989).
In this paper we conduct a work in progress for a
smartphone application (app) that can easily be used
by a field health worker seeing many patients on a
daily basis. Smartphones are cheap and deployable
in different field settings. Figure 1 shows the envi-
sioned use case scenario of the target application. On
an initial patient visit, one or more images of an indi-
vidual patient’s ear are captured. Ear descriptors are
extracted and stored in a database along with basic
patient information. On another visit, responsible per-
sonnel capture an image of the patient’s ear. Database
records that possibly match are retrieved in the form
171
Adel Bargal S., Welles A., R. Chan C., Howes S., Sclaroff S., Ragan E., Johnson C. and Gill C..
Image-based Ear Biometric Smartphone App for Patient Identification in Field Settings.
DOI: 10.5220/0005342201710179
In Proceedings of the 10th International Conference on Computer Vision Theory and Applications (VISAPP-2015), pages 171-179
ISBN: 978-989-758-091-8
Copyright
c
2015 SCITEPRESS (Science and Technology Publications, Lda.)
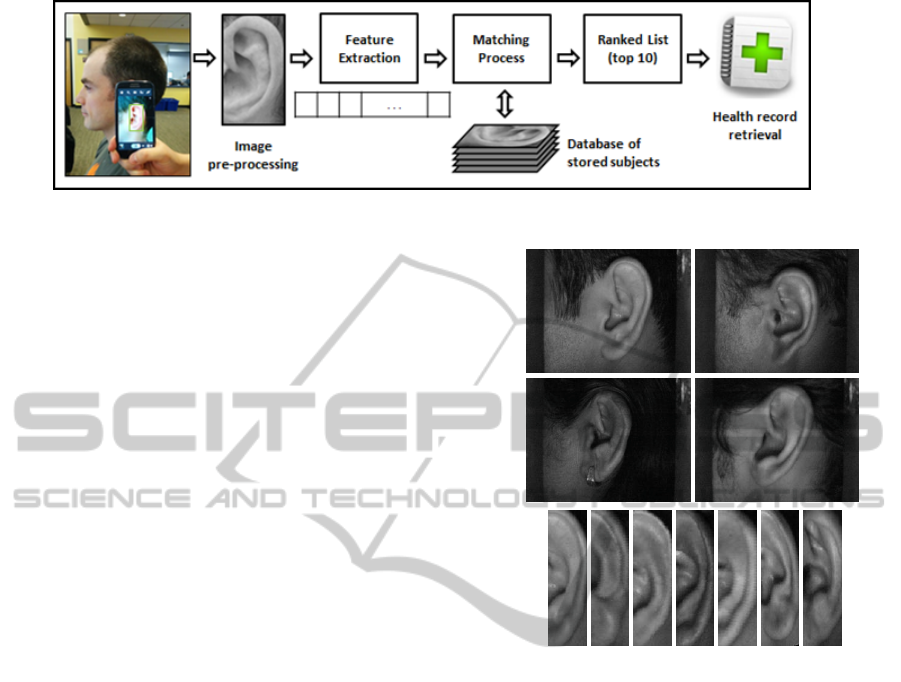
Figure 1: System diagram of the proposed smartphone app for patient identification in field settings.
of a ranked list.
Recognition rates are highly dependent on: lo-
cating the ear in the captured image, and matching
ears captured at different angles, scales, and illumi-
nation conditions. The more resilient a system is to
these factors the better it may perform. In developing
our system, we tested and compared three commonly
used feature extraction techniques that each address at
least two of these challenges by design: Local Binary
Patterns (LBPs), Generic Fourier Descriptor (GFD),
and Scale Invariant Feature Transform (SIFT). These
were validated on a controlled dataset of 493 images
of 125 individuals. We then used SIFT to develop an
iOS app prototype as a proof of concept. A pilot study
was then conducted on the app using a dataset of 838
images of 240 individuals.
2 RELATED WORK
The advancement of onboard sensors is allowing for
biometric identification, in smartphones. In (Kwapisz
et al., 2010) accelerometry is used to identify and au-
thenticate an individual based on their movement sig-
natures in daily behavior. This is useful in personal
devices only. Descartes Biometrics developed the
’Ergo’ system that uses the smartphone touch screen
sensor to identify a user by an ear print in combination
with movement signatures of how the phone is picked
up (Goode, 2014). Pressing patients’ ears against a
touch screen could raise hygiene problems in the field.
In (Fahmi et al., 2012), a feature extraction tech-
nique based on ear biometrics is proposed, and au-
thors predict that it would be directly applicable on
a smartphone. In (Kumar, 2014), the following idea
is mentioned: allowing parents or health care work-
ers to take ear and feet images of a child and send
them to a central server that sends back a text message
with the vaccination needs. This idea assumes the
availability of a smartphone with the parent, and the
availability of a running network to a central server.
Such assumptions may not hold in the underdevel-
oped field settings we target. This also assumes that
(a)
(b)
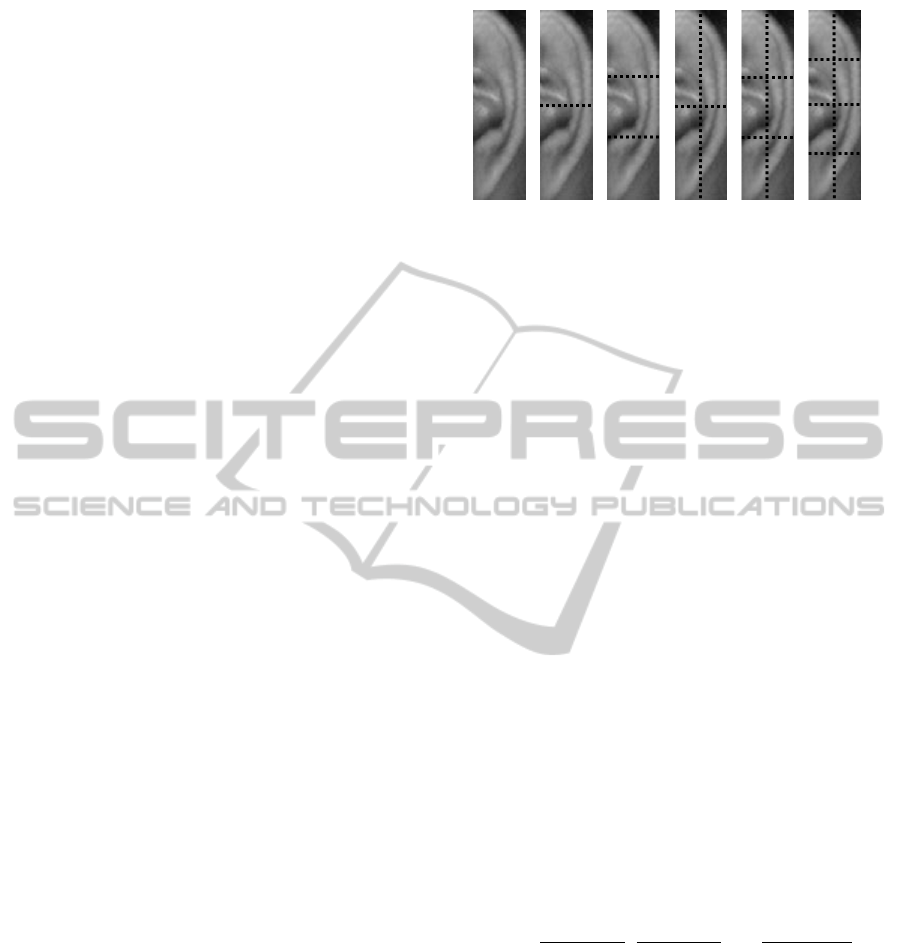
Figure 2: Sample ear images from the IIT Delhi Ear Image
Database (Biometrics Research Laboratory, 2013), (a) raw
(b) pre-processed.
the top match will be the correct one 100% of the
time. Both (Fahmi et al., 2012; Kumar, 2014) do
not report working implementations or quantitative
results. Before smartphone applications for biomet-
rics, there has been a wealth of research performed
in automating the various subtasks of an ear detection
system (Abaza et al., 2013). Various approaches use
a three-dimensional or two-dimensional ear represen-
tation. 2D approaches are more appropriate for our
domain because of the field requirements of fast and
cheap solutions. Extracting a feature vector from a
2D ear representation has been done in many ways in-
cluding Eigen Ears (PCA) (Chang et al., 2003), Force
Field (Abdel-Mottaleb and Zhou, 2005), GFD (Abate
et al., 2006), SIFT/SURF (Cummings et al., 2010;
Kisku et al., 2009), and LBPs (Wang et al., 2008;
Boodoo-Jahangeer and Baichoo, 2013).
VISAPP2015-InternationalConferenceonComputerVisionTheoryandApplications
172
3 COMPARATIVE STUDY:
FEATURE EXTRACTION
In our application, potentially matching records are
presented to the health worker, ranked in order of ear
biometric similarity, given an image of an individual
patient’s ear. If a record of that individual is already
enrolled in the database then that individual’s record
should appear ranked in the first position (first nearest
neighbor), or at least within the top 5 to 10 records
(within 5 or 10 nearest neighbors).
With this use case in mind, we conducted a com-
parative evaluation of three widely used ear bio-
metric feature representations: Local Binary Pat-
terns (LPBs), Generic Fourier Descriptor (GFD), and
Scale Invariant Feature Transform(SIFT). These ex-
periments were conducted using the IIT Delhi Ear
Image Database (Kumar and Wu, 2012), which con-
tains 493 images of 125 subjects whose ages range
between 14 and 58 years. The number of images per
individual in the dataset varies between 3 and 6. The
camera was partially covered from the side so that di-
rect light from indoor illumination does not enter the
camera. Original captured images have a resolution of
272 × 204 pixels, but the dataset also offers automati-
cally normalized and cropped ear images of 50 ×180
pixels. Sample images, raw and pre-processed, can be
seen in Figure 2(a) and 2(b) respectively. In the rest
of this section, we report our experimental setup for
the comparison of the three approaches.
3.1 Local Binary Patterns
LBPs (Ojala et al., 1996) demonstrated good perfor-
mance in ear biometrics (Wang et al., 2008; Boodoo-
Jahangeer and Baichoo, 2013). Following (Takala
et al., 2005; Wang et al., 2008) we use P sampling
points on a circular grid of radius R, and uniform bi-
nary patterns u2 originally introduced by (M
¨
aenp
¨
a
¨
a
et al., 2000) (LBP
u2
(P,R)
). Our implementation is based
on the rotation invariant MATLAB implementation
of Marko Heikkil and Timo Ahonen. In our work,
we perform experiments on 54 LBP variants resulting
from the Cartesian product of the following parameter
settings:
• Images: We experimented with a) the full reso-
lution image, b) the concatenation of the verti-
cal, horizontal and diagonal images resulting from
single-level 2D wavelet decomposition with re-
spect to Daubechies of size 20 (empirically deter-
mined), and c) the blurred and subsampled image
(1/2 each dimension).
• Regions: We experimented with partitioning an
Figure 3: Different image divisions used for the LBP num-
ber of regions parameter.
ear image into 1, 2, 3, 4, 6, and 8 regions as de-
picted in Figure 3.
• Neighborhoods and Radii: We experimented with
neighborhood and radii sizes (8,1), (8,2), and
(16,2).
The final dimensionality depends on the number
of input images used, the number of regions, and the
size of the neighborhood. The shortest feature vec-
tor was of length 10, and the longest was of length
432. Out of the 54 possible combinations of param-
eter settings, LBP
u2
(16,2)
with 6 regions and downsam-
pling gave the best recognition rates. Then we ex-
plored concatenating (+) feature vectors of different
neighborhoods to have a multi-scale descriptor, and
LBP
u2
(8,1)
+ LBP
u2
(16,2)
with 6 regions and downsampling
gave the highest recognition rates.
3.2 Generic Fourier Descriptor
The Generic Fourier descriptor (GFD) proposed by
(Zhang and Lu, 2002) was reported successful in ear
biometrics (Abate et al., 2006). GFD uses a modified
polar Fourier transform (PFT) which makes it rotation
invariant. The magnitudes of the resulting Fourier co-
efficients are stored in a vector and normalized as fol-
lows:
GFD =
|PFT (0,0)|
Area
,
|PFT (0,1)|
|PFT (0,0)|
,· ·· ,
|PFT (R,T )|
|PFT (0,0)|
.
(1)
The first magnitude value is divided by the circle’s
area. The remaining ones are normalized by the first
magnitude (DC). By only keeping the magnitude of
the Fourier coefficients, the GFD effectively becomes
rotation invariant. Scale invariance can be obtained by
initially placing the circle such that the top and bottom
of the ear hit the perimeter, and then consistently sam-
pling. This method is also illumination invariant due
to the DC coefficient normalization over the average
image brightness.
In our work, we used the same descriptor. We im-
plemented PFT on a square input image, resized to
Image-basedEarBiometricSmartphoneAppforPatientIdentificationinFieldSettings
173
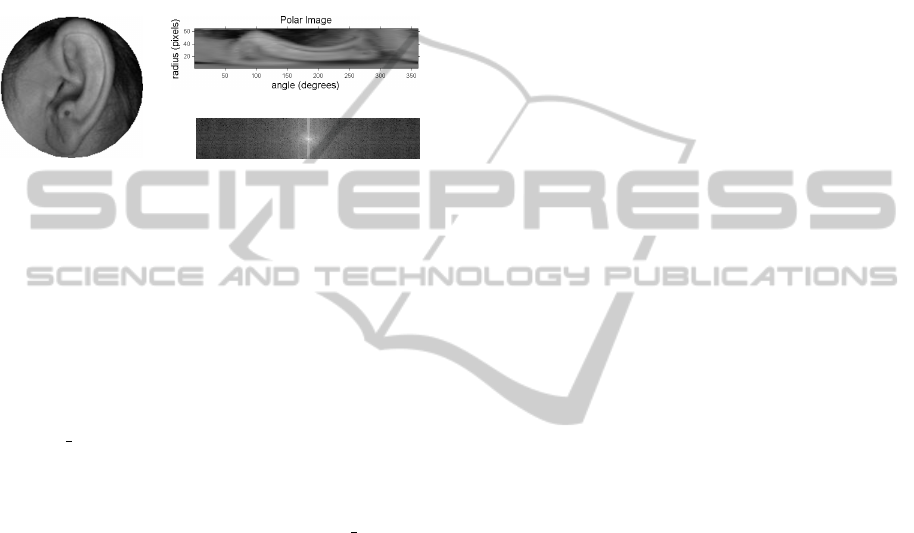
128 × 128 pixels (Figure 4). Empirically, we found
that 64 radial and 180 angular samples yielded the
best results.
When testing the GFD during classification, we
noted that the inclusion of the first GFD value had
a detrimental impact on the overall accuracy for our
data set. The first GFD term represents the average
image brightness and is not feature descriptive. The
removal of this term resulted in an overall increase in
accuracy during testing.
Figure 4: Example image with its corresponding polar im-
age representation (top right), and corresponding Fourier
spectrum (bottom right).
3.3 Scale Invariant Feature Transform
SIFT features (Lowe, 1999) have been successfully
used in ear biometrics by (Cummings et al., 2010;
Kisku et al., 2009). SIFT features are scale and rota-
tion invariant, and only show some illumination tol-
erance. In our work, we used the open source li-
brary vl feat (Vedaldi and Fulkerson, 2008) for ex-
tracting and matching SIFT features in MATLAB,
and the OpenCV SiftFeatureDetector function (Brad-
ski, 2000) is used in C++ for the iOS application. The
default parameter settings were used for vl feat, but
we empirically determined parameter values for the
OpenCV SiftFeatureDetector for use on images cap-
tured by the camera of the smartphone device. The
first parameter controls the number of best features
to retain; we retain all features. The second parame-
ter controls the number of Octave Layers. The num-
ber of octaves is computed automatically from the
image resolution. The third parameter is a thresh-
old that controls filtering out weak features in low-
contrast regions. The fourth parameter is a threshold
that controls filtering out edge-like features. The fifth
parameter is the scaling parameter for the Gaussian
Kernels used in SIFT’s Gaussian pyramid for iden-
tifying potential keypoints. In our empirical study
we determined that the following settings worked
best: nfeatures=0 (default), nOctaveLayers=3 (de-
fault), contrastThreshold=0.025, edgeThreshold=20,
sigma=1.0.
4 RESULTS: COMPARATIVE
STUDY
Our biometric application is to retrieve a ranked list
for an individual. We pose this as a k-Nearest Neigh-
bor (k-NN) problem where the user will be presented
with the top k matches. So we evaluated performance
of LBPs, GFD, and SIFT on a k-NN retrieval task,
first with k = 1 requiring the top match to be the cor-
rect one, then with a reasonable k size that a user can
handle.
As the system is used, more image descriptors will
be available. We are interested to see how the system
performs as we train on more images. The IIT dataset
contains at least 3 images per subject. We evaluated
performance when the number of images per individ-
ual in the database was varied: 1 image per individual,
2 images, and n-1 images, where n is the total number
of images available for that particular individual. 3-
fold cross validation was conducted every time. In the
rest of this section we report evaluation of the three
approaches and provide a summary comparison.
4.1 Local Binary Patterns
To perform 1-NN retrieval with LBPs we tested dif-
ferent distance metrics: Euclidean, City Block, and
Correlation, to compare their performance. The re-
sults are summarized in Table 1. The table reports
the accuracy of retrieving the correct individual in the
rank 1 position using the best performing LBP feature
vector: LBP
u2
(16,2)
with 6 regions and downsampling.
As expected, we noted improvement in 1-NN re-
trieval as the number of training examples per indi-
vidual increases. Overall, the best performing metric
is City Block in the different testing rounds, but it is
equivalent to Euclidean when we train on n-1 images,
which is the steady state of our system.
For comparison, a Support Vector Machine
(SVM) was used for classification. Experimentation
was performed with different kernel functions: lin-
ear, quadratic, polynomial, and rbf (varying parame-
ter values). A multi-class linear SVM performed best,
but did not out-perform 1-NN as reported in Table 1.
After examining the results from this experiment,
we experimented using multi-scale LBP and Eu-
clidean distance 1-NN. This is conducted using the
concatenation (+) of LBP feature vectors of different
radii and neighborhoods. An improvement over the
best feature vector in Table 1 is obtained by LBP
u2
(8,1)
+ LBP
u2
(16,2)
with 6 regions and downsampling giving
a recognition rate of 95.5%.
VISAPP2015-InternationalConferenceonComputerVisionTheoryandApplications
174
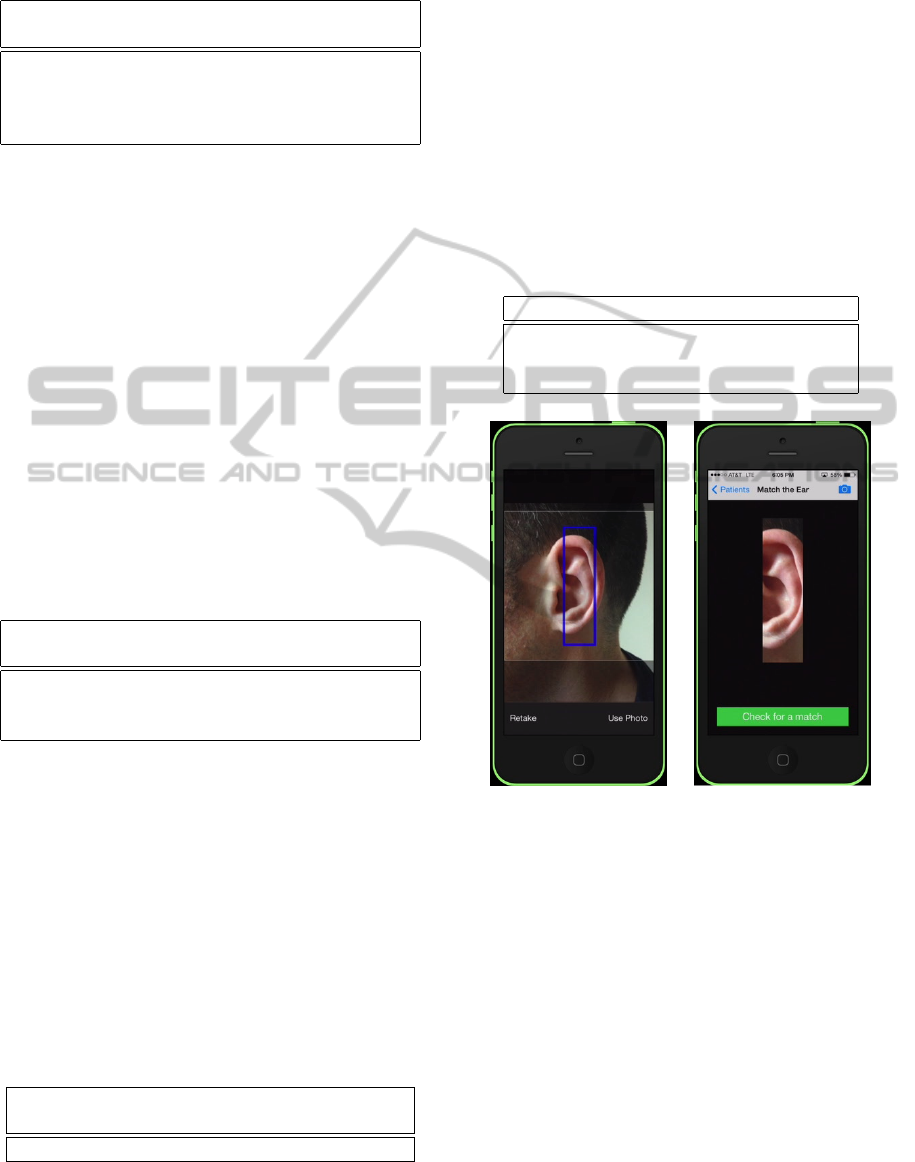
Table 1: Results using LBPs for feature extraction.
# Images in Training Dataset
1 2 n − 1
1-NN Euclidean 83.2% 91.7% 94.9%
1-NN City Block 87.3% 93.9% 94.9%
1-NN Correlation 81.5% 90.9% 93.3%
SVM − − 80.3%
4.2 Generic Fourier Descriptor
To perform 1-NN retrieval with GFD, we tested dif-
ferent distance metrics: Euclidean, City Block, and
Correlation, to compare their performance. The re-
sults are summarized in Table 2. The table reports
the accuracy of retrieving the correct individual in the
rank 1 position using the best performing polar sam-
pling rate.
As with LBPs, the inclusion of more images (per
individual) in the training database resulted in an in-
crease in the accuracy for all distance measures. Eu-
clidean and Correlation give marginally higher recog-
nition percentages than City Block on n-1 images,
which is the steady state of our system. Euclidean per-
forms marginally better than Correlation when train-
ing on a single image.
Table 2: Results using GFD for feature extraction.
# Images in Training Dataset
1 2 n − 1
1-NN Euclidean 84.8% 94.4% 96.0%
1-NN City Block 84.9% 93.9% 95.2%
1-NN Correlation 84.5% 94.4% 96.0%
4.3 Scale Invariant Feature Transform
SIFT was used in 1-NN. Distances between matching
SIFT keypoints were returned by vlfeat and OpenCV
as Euclidean distances, and therefore was the valid
metric. The results are summarized in Table 3. The
table reports the accuracy of retrieving the correct in-
dividual in the rank 1 position.
As for LBPs and GFD, SIFT showed increasing
accuracy when more training images were available
per individual.
Table 3: Results using SIFT for feature extraction.
# Images in Training Dataset
1 2 n − 1
1-NN Euclidean 90.4% 96.0% 96.5%
4.4 Discussion
Using 493 images of 125 subjects of the IIT Delhi
Ear Image Database, the recognition rates of the most
descriptive feature vector of each of the three feature
extraction techniques are shown in Table 4. SIFT gave
the second highest accuracy in 5-NN, and the highest
accuracy in 1-NN. We decided to use SIFT in our im-
plementation of the iOS app since the ultimate goal of
any biometric system is correct retrieval in the rank 1
position.
Table 4: Recognition rates (RR) of matches in the top-rank
and top 5 ranks, for the three feature representations.
Methodology RR (Top1) RR (Top 5)
SIFT 96.5% 98.4%
FT 96.0% 99.2%
LBPs 95.5% 98.1%
Figure 5: The interface for capturing an image of a patients
ear. The top right camera icon (right) is available for re-
capturing an image if needed.
5 iOS APP
A prototype iOS app was developed to test the ap-
proach. Based on our experiments, we selected the
SIFT algorithm for our implementation. The applica-
tion has the following functionalities:
• Adding a new patient
• Viewing the information of an existing patient
• Editing the information of an existing patient
• Matching a visiting patient to database record
Image-basedEarBiometricSmartphoneAppforPatientIdentificationinFieldSettings
175
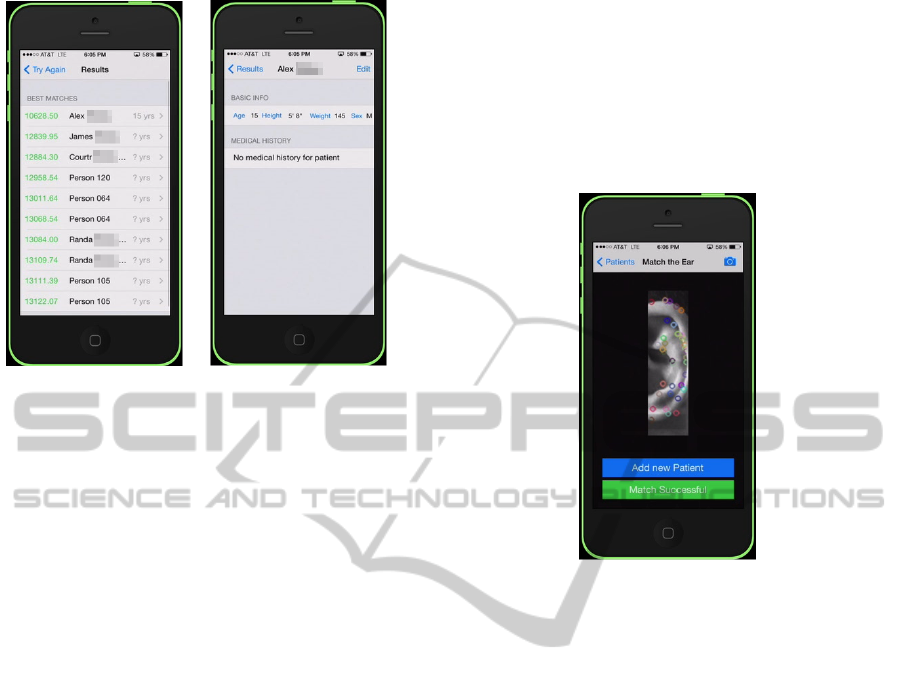
Figure 6: (left) shows the top ten ranks of a matching
process, and (right) shows the medical history of the top
matched record.
To acquire an image of the patient’s ear, the ap-
plication asks the health worker to align a bounding
box with the subject’s ear in order to perform ear de-
tection. Figure 5 demonstrates the ear capture pro-
cess. At this stage, the user has the choice of using
the photo or re-taking it.
Once the photo has been captured, it is processed
using the OpenCV library: cropped, downsampled,
and converted to grayscale. SIFT features are then
extracted from the captured image (Figure 7). At this
stage, the medical practitioner has the option of re-
taking the image if it is blurry, or if the number of
features detected is clearly much smaller than usual,
for example two SIFT features.
The device’s memory holds all feature vectors of
patients that are currently in the database. There
might be one or more feature vectors per individual
depending on how many times the medical practi-
tioner added new image descriptors to their record.
Images are not stored on the device, only their de-
scriptors are. This is done for privacy reasons, and
for conserving the storage capacity on the mobile de-
vice. We are aware that a mobile device can be lost
much more easily than say an on-site computer, and
this raises security issues. We can envision a rudi-
mentary approach where the app returns an ID, rather
than full medical history, which can be used to re-
trieve the full medical record from a more secured
system on-site. Built-in iOS hardware encryption can
also be enabled. This approach can be further for-
tified; however, further encryption/obfuscation is be-
yond the current scope of the project.
Once a query is submitted, the SIFT feature vec-
tor of the input image is matched against the database
using Euclidean. The top ten resulting matches are
returned in the form of a ranked list (Figure 6). The
medical practitioner can then select the patient record
to display that patient’s medical history (Figure 6).
The process requires 5 clicks, and the matching oc-
curs in less than five seconds for a database contain-
ing 838 image descriptors. Any on-site personnel can
use this app after an hour of training.
Figure 7: Screen capture of sample ear with SIFT points on
application interface.
6 RESULTS: PILOT STUDY
A pilot study was performed in order to test the de-
veloped app in the same way the users would use it.
Testing on a dataset collected in uniform laboratory
settings is not sufficient because a controlled environ-
ment cannot be guaranteed in real future deployment.
It is expected to note a drop in recognition percent-
ages when using the mobile camera to capture images
of individuals at different locations who are free to
change pose between image captures, as opposed to a
fixed capture laboratory setting used in the compara-
tive study.
SIFT is scale and rotation invariant by design. The
functionality of the bounding box reduces scale and
in-plane rotation variations, and is used to reduce er-
ror propagation from automated ear detection. The re-
maining challenges that are not addressed in the pro-
totype implementation are varying illumination and
out-of-plane rotation.
A database was collected that contained 240 indi-
viduals: images gathered using our smartphone app
for 115 individuals with 3 images each (345 images)
plus the IIT dataset of 125 individuals with 3-6 im-
ages each (493 images). Thus, in total, there were
VISAPP2015-InternationalConferenceonComputerVisionTheoryandApplications
176
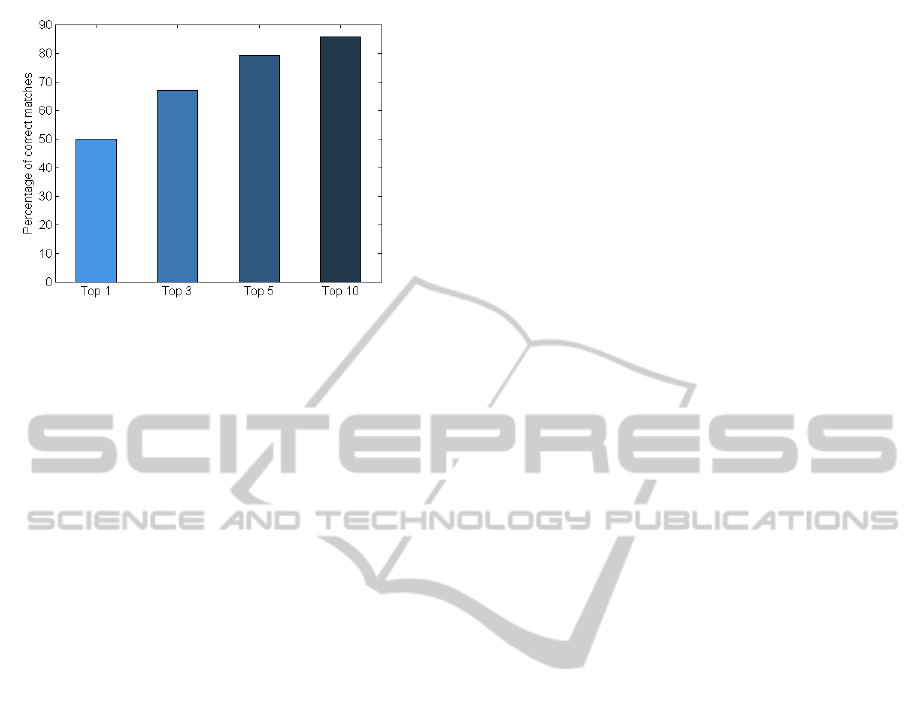
Figure 8: This graph shows the percentage of individuals
(out of 84 test subjects) correctly matched to the top-rank
record, to one of the top 3, top 5, and top 10 records.
838 images (240 individuals) in the training database
on the smartphone. A separate test set was used,
which comprised 3 images per subject for 84 individ-
uals who already had records in the database (yielding
252 test images total). The test images were excluded
from training. The test images were captured on dif-
ferent days after the database was constructed.
Figure 8 summarizes the results. Although vary-
ing illumination and out-of-plane rotation were not
addressed in the implementation of this app, 50% of
the subjects matched their rank 1 position, whereas
chance is 0.36%. 79% of the subjects matched one of
the top 5 displayed ranks, whereas chance is 1.77%.
85.7% of the subjects matched one of the top 10 dis-
played ranks, whereas chance is 3.51%. It was inter-
esting testing the app on twins; they matched them-
selves in the top rank, but matched each other next.
The pilot study suggests promising initial results
for our proposed app. We expect percentages to im-
prove when varying illumination and out-of-plane ro-
tation are addressed. This would address the reason
for the drop in recognition percentages between the
two datasets. The future work section will address
such next steps.
7 FUTURE WORK
Given the results of the pilot study, we plan three
stages of future work in the order presented.
In order to select the suitable representation for
the ear images, we performed a comparative study of
three different feature extraction techniques on a con-
trolled dataset, however the real world performance
might be better for LBPs or GFD. We would like to
implement LBP and GFD on the iOS app to have a
better understanding of the real world performance of
mobile ear biometrics.
In practice we found that LBPs and GFD are more
computationally efficient and robust to varying illu-
mination than SIFT features. On the other hand, we
observed that SIFT attained higher retrieval accuracy
in 1-NN (desired long-term behavior) when the illu-
mination was controlled by a lab setting. This leads
us to believe that using cascade LBPs, GFD, and SIFT
based classifiers, would improve robustness of our
system. Also, using the flash on the smartphone could
be used to further improve the accuracy of our system
mimicing standard lighting conditions.
Further information like sex or rough age can be
used to distinguish the patient identity. For exam-
ple, we would like to integrate a pre-filtration feature
in the app based on sex. Only records matching the
sex entered by the medical practitioner would be dis-
played in the ranked list. The medical practitioner
can then perform manual post-filtration by approxi-
mate age, or approximate name spelling to match an
individual within the displayed top 10 ranks.
Although 1-NN ∼ 100% accuracy is the target for
any biometric based application, even a ∼ 100% 10-
NN accuracy would greatly contribute to providing
higher quality healthcare in such on-site clinics at this
stage. This is our short-term goal. Having a medi-
cal practitioner find an individual’s record among 10
ranked options, is much better than having nearly no
chance of getting to a patient’s medical record. We
would like to further investigate usability metrics like
throughput rates and additional precision metrics like
false positive identification-error rate for unenrolled
individuals (Biometrics Metrics Report v3.0, 2012).
All testing has been done on adults, however in on-
site medical clinics, vaccination of infants is one of
the major requirements. Therefore, future work also
includes performing a longitudinal study on infants
under the age of three whose ears will be developing
over time. This would follow the three stages of im-
proving the app performance on adult recognition.
8 CONCLUSION
We proposed a formulation, developed a prototype,
and conducted preliminary testing of an iOS appli-
cation to identify individuals based on ear biometrics.
The application allows a medical practitioner to take a
photo of a patients ear, and return the top ten matches
within a database of medical data contained locally
on the phone. The application is a non-invasive, easy
to use, tolerant to capture rotation and scale, and re-
quires the use of relatively cheap and increasingly
ubiquitous device, the smartphone. In our pilot study,
the prototype app was able to retrieve the correctly
Image-basedEarBiometricSmartphoneAppforPatientIdentificationinFieldSettings
177

matching record ranked within the top 5, 79% of the
time. Although this percentage is currently low for a
real application deployment, this is work in progress
that lays the foundation for future work described in
the previous section, and for a feasibile application
deployment we believe.
We hope that this work will serve as a catalyst to
solve patient identification problems at on-site med-
ical clinics in less developed countries, and have a
positive impact on global health. Although the main
target of the app is identifying subjects for the pur-
pose of cataloging their medical data in field settings,
it would also be useful for on-site identification of ca-
sualties complicated by facial injury and lack of iden-
tifying documents.
ACKNOWLEDGEMENTS
We would like to thank the Biometrics Research Lab-
oratory at IIT Delhi for providing us with the IIT
Delhi Ear Image Database. We would also like to
thank Fatih Cakir for bringing together the public
health and computer science teams.
REFERENCES
Abate, A., Nappi, M., Riccio, D., and Andricciardi, S.
(2006). Ear recognition by means of a rotation in-
variant descriptor. Pattern Recognition, ICPR. 18th
International Conference on, 4:437–440.
Abaza, A., Ross, A., Hebert, C., Harrison, M. F., and Nixon,
M. S. (2013). A survey on ear biometrics. ACM Com-
puting Surveys (CSUR) Journal, 45(2):22.
Abdel-Mottaleb, M. and Zhou, J. (2005). Human ear recog-
nition from face profile images. Advances in biomet-
rics, pages 786–792.
Azfar, R. S., Weinberg, J. L., Cavric, G., Lee-Keltner, I. A.,
Bilker, W. B., Gelfand, J. M., and Kovarik, C. L.
(2011). HIV-positive patients in botswana state that
mobile teledermatology is an acceptable method for
receiving dermatology care. Journal of telemedicine
and telecare, 17(6):338–340.
Biometrics Metrics Report v3.0 (2012). Pre-
pared for: U.S. Military Academy (USMA)
- West Point. http://www.usma.edu/ietd/docs/
BiometricsMetricsReport.pdf.
Biometrics Research Laboratory (2013). IIT Delhi
Ear Database. http://www4.comp.polyu.edu.hk/
∼csajaykr/IITD/Database Ear.htm.
Boodoo-Jahangeer, N. B. and Baichoo, S. (2013). LBP-
based ear recognition. Bioinformatics and Bioengi-
neering (BIBE), IEEE 13th International Conference
on, pages 1–4.
Bradski, G. (2000). Dr. Dobb’s Journal of Software Tools.
Chang, K., Bowyer, K., Sarkar, S., and Victor, B. (2003).
Comparison and combination of ear and face im-
ages in appearance-based biometrics. Pattern Anal-
ysis and Machine Intelligence, IEEE Transactions on,
25(9):1160–1165.
Cummings, A., Nixon, M., and Carter, J. (2010). A novel
ray analogy for enrollment of ear biometrics. Biomet-
rics: Theory Applications and Systems (BTAS), Fourth
IEEE International Conference on, pages 1–6.
Delac, K. and Grgic, M. (2004). A survey of biometric
recognition methods. Electronics in Marine, 2004.
Proceedings Elmar 2004. 46th International Sympo-
sium, pages 184–193.
Fahmi, A., Kodirov, E., Choi, D., Lee, G., M. F. Azli A.,
and Sayeed, S. (2012). Implicit authentication based
on ear shape biometrics using smartphone camera dur-
ing a call. Systems, Man, and Cybernetics (SMC),
IEEE International Conference on, pages 2272–2276.
Goode, A. (2014). Bring your own finger–how mobile is
bringing biometrics to consumers. Biometric Technol-
ogy Today, 2014(5):5–9.
Iannarelli, A. (1989). Ear identification, forensic identifica-
tion series, fremont. Paramont Publishing Company,
Calif, ISBN, 10:0962317802.
Kisku, D. R., Mehrota, H., Gupta, P., and Sing, J. K. (2009).
SIFT-based ear recognition by fusion of detected key-
points from color similarity slice regions. Advances
in Computational Tools for Engineering Applications,
2009. ACTEA’09. International Conference on, pages
380–385.
Kumar, A. and Wu, C. (2012). Automated human iden-
tification using ear imaging. Pattern Recognition,
45(3):956–968.
Kumar, M. (2014). Hanseatic institute of
technology. cell phone-based intelligent
biometrics. http://www.appropedia.org/
Cell
phone-based intelligent biometrics .
Kwapisz, J. R., Weiss, G. M., and Moore, S. A. (2010).
Cell phone-based biometric identification. Biomet-
rics: Theory Applications and Systems (BTAS), Fourth
IEEE International Conference on, pages 1–7.
Lowe, D. (1999). Object recognition from local scale-
invariant features. Computer vision. The proceed-
ings of the seventh IEEE international conference on,
2:1150–1157.
M
¨
aenp
¨
a
¨
a, T., Ojala, T., Pietik
¨
ainen, M., and Soriano, M.
(2000). Robust texture classification by subsets of lo-
cal binary patterns. Pattern Recognition, 2000. Pro-
ceedings. 15th International Conference on, 3:935–
938.
Ojala, T., Pietikainen, M., and Harwood, D. (1996). A com-
parative study of texture measures with classification
based on feature distributions. Pattern Recognition,
29(1):51–59.
Takala, V., Ahonen, T., and Pietik
¨
ainen, M. (2005). Block-
based methods for image retrieval using local binary
patterns. Image Analysis, pages 882–891.
Vedaldi, A. and Fulkerson, B. (2008). VLFeat: An open
and portable library of computer vision algorithms.
http://www.vlfeat.org/.
VISAPP2015-InternationalConferenceonComputerVisionTheoryandApplications
178

Wang, Y., Mu, Z., and Zeng, H. (2008). Block-based
and multi-resolution methods for ear recognition us-
ing wavelet transform and uniform local binary pat-
terns. Pattern Recognition, ICPR. 19th International
Conference on, pages 1–4.
Zhang, D. and Lu, G. (2002). Shape-based image retrieval
using generic fourier descriptor. Signal Processing:
Image Communication, 17(10):825–848.
Image-basedEarBiometricSmartphoneAppforPatientIdentificationinFieldSettings
179
