
Evaluating an Inspection Technique for Use Case Specifications
Quantitative and Qualitative Analysis
Natasha M. Costa Valentim
1
, Tayana Conte
1
and José Carlos Maldonado
2
1
USES Research Group, Instituto de Computação, Universidade Federal do Amazonas (UFAM), Manaus, Brazil
2
Departamento de Ciência da Computação, Universidade de São Paulo (USP), São Carlos, Brazil
Keywords: Usability Evaluation, Inspection, Use Cases, Early Usability.
Abstract: Usability inspections in early stages of the development process help revealing problems that can be
corrected at a lower cost than at advanced stages of the development. The MIT 1 (Model Inspection
Technique for Usability Evaluation) is a usability inspection technique, which aims to anticipate usability
problems through the evaluation of use cases. This technique was evaluated using a controlled experiment
aimed at measuring its efficiency and effectiveness, when compared to the Heuristic Evaluation (HEV)
method. According to quantitative results, the MIT 1 exceeded the HEV in terms of effectiveness and
obtained a similar performance in terms of efficiency. In other words, the MIT 1 allows finding more
problems than the HEV. On the other hand, the subjects spent more time finding these problems using MIT
1. Moreover, the MIT 1 was considered easy to use and useful by the subjects of the study. We analysed the
qualitative data using the procedures from the Grounded Theory (GT) method and results indicate
improvement opportunities.
1 INTRODUCTION
The communities of HCI (Human Computer
Interaction) and SE (Software Engineering) evolved
separately and each developed their own methods to
meet the needs of their respective customers and
software users. However, in the last twenty years
increasing attempts have been made to meet the gap
between these communities (Juristo et al., 2007).
Seffah et al., (2001) suggest ways in which software
and usability engineers can learn from each other to
facilitate and encourage the convergence of practices
in both communities. It is very important to promote
mutual understanding of the activities and
responsibilities of the two communities to develop
software with high degree of usability. Also, it is
necessary to ensure that usability issues are
adequately assured throughout the development
cycle of a software product (Juristo et al., 2007).
In the context described above, it is essential to
develop usability inspection techniques that can be
applied to traditional SE artifacts. Recent researches
aimed at ensuring a high degree of usability in the
early stages of the development process of
applications, called “Early Usability” (Hornbæk et
al., 2007; Juristo et al., 2007). Part of the proposed
techniques aims at ensuring usability through the
inspection of models used during the design of the
applications, leading to a higher user satisfaction.
Considering the importance of performing the
inspections integrating SE and HCI perspectives,
this paper presents a technique for usability
evaluation in specified use cases. Use cases are
important artifacts for developers, helping to both
build the software and design the interactions
between the system and the users.
The technique addressed in this paper is called
MIT 1 (Valentim et al., 2012). Such technique is
part of a set of techniques called Model Inspection
Techniques for Usability Evaluation (MIT),
composed by two other techniques: MIT 2 (for
usability inspection in mockups) (Valentim and
Conte, 2014b) and MIT 3 (for usability inspection in
activity diagrams) (Valentim et al., 2013).
To support the development and validation of
MIT 1 technique, we have adopted the experimental
methodology presented in Shull et al., (2001). The
methodology comprises four stages: (1) feasibility
studies: to determine the usage possibility of the
technology; (2) observational studies: to improve the
understanding and the cost-effectiveness of the
technology; (3) case studies in real lifecycle: to
characterize the technology application during a real
13
M. Costa Valentim N., Conte T. and Maldonado J..
Evaluating an Inspection Technique for Use Case Specifications - Quantitative and Qualitative Analysis.
DOI: 10.5220/0005374100130024
In Proceedings of the 17th International Conference on Enterprise Information Systems (ICEIS-2015), pages 13-24
ISBN: 978-989-758-098-7
Copyright
c
2015 SCITEPRESS (Science and Technology Publications, Lda.)
lifecycle; and (4) case studies in industry: to identify
if the technology application fits into the industrial
settings. The goal of the MIT 1 is to be easily
adoptable by the industry. We expect that software
engineers can use it to ensure the quality of their use
cases. To achieve this goal, we carried out the first
stage of the methodology by evaluating the
feasibility of the proposed technique.
This paper presents a controlled experiment that
aims to analyze the performance of the MIT 1
technique compared to one of the main usability
inspection methods, the Heuristic Evaluation - HEV
(Nielsen, 1994).
The remainder of this paper is organized as
follows. Section 2 presents the basic concepts on
usability evaluations. Section 3 presents the MIT 1.
In Section 4, we describe the controlled experiment,
while Section 5 presents its quantitative results. In
Section 6 we present the analysis of user perception
and in Section 7 we present the qualitative results
and improvements. In Section 8 we discuss the
threats to validity. Finally, Section 9 presents our
conclusions and future work.
2 BACKGROUND
One of the most relevant quality criteria for the
acceptability of the software is usability (Matera et
al., 2002). According to the norm ISO/IEC 25010
(2011), usability is defined as: “the capability of the
software product to be understood, learned,
operated, attractive to the user, and compliant to
standards/guidelines, when used under specific
conditions”. Usability evaluation has become
indispensable for HCI practice and research (Følstad
et al., 2010). General usability evaluation methods
can be divided into two broad categories (Conte et
al., 2007): (1) Usability Inspections - evaluation
methods based on Experts’ Analysis; and (2)
Usability Tests - evaluation methods involving
user’s participation.
The use of usability tests may not be cost-
effective since they require a large amount of
resources. Usability tests also need a full or partial
implementation of the application, signifying that
such evaluations are mainly moved to the last stages
of the development process (Hornbæk et al., 2007).
Inspection methods, on the other hand, allow
usability evaluations to be performed on artifacts
such as mockups, paper prototypes or user interface
models. Usability inspections are naturally less
expensive than evaluation methods that involve user
participation, since they do not need, besides the
inspectors, any special equipment or laboratories to
be performed (Matera et al., 2002).
Different usability inspection techniques have
been developed and used (Fernandez et al., 2011).
One of the most popular methods is the Heuristic
Evaluation, proposed by Nielsen (1994). This
method aims at finding usability problems through a
compliance analysis of the evaluated system using
heuristics or quality standards. The 10 heuristics
defined by Nielsen are described in Table 1.
Table 1: Heuristic Evaluation (Nielsen, 1994).
Heuristic 1. Visibility of system status
The system should always keep users informed about what is
going on, through appropriate feedback within reasonable
time.
Heuristic 2. Match between system and the real world
The system should speak the users' language, with words,
phrases and concepts familiar to the user, rather than system-
oriented terms. Follow real-world conventions, making
information appear in a natural and logical order.
Heuristic 3. User control and freedom
Users often choose system functions by mistake and will need
a clearly marked "emergency exit" to leave the unwanted state
without having to go through an extended dialogue. Support
undo and redo.
Heuristic 4. Consistency and standards
Users should not have to wonder whether different words,
situations, or actions mean the same thing. Follow platform
conventions.
Heuristic 5. Error prevention
Even better than good error messages is a careful design which
prevents a problem from occurring in the first place. Either
eliminate error-prone conditions or check for them and present
users with a confirmation option before they commit to the
action.
Heuristic 6. Recognition rather than recall
Minimize the user's memory load by making objects, actions,
and options visible. The user should not have to remember
information from one part of the dialogue to another.
Instructions for use of the system should be visible or easily
retrievable whenever appropriate.
Heuristic 7. Flexibility and efficiency of use
Accelerators -- unseen by the novice user -- may often speed
up the interaction for the expert user such that the system can
cater to both inexperienced and experienced users. Allow
users to tailor frequent actions.
Heuristic 8. Aesthetic and minimalist design
Dialogues should not contain information which is irrelevant
or rarely needed. Every extra unit of information in a dialogue
competes with the relevant units of information and
diminishes their relative visibility.
Heuristic 9. Help users recognize, diagnose, and recover
from errors
Error messages should be expressed in plain language (no
codes), precisely indicate the problem, and constructively
suggest a solution.
Heuristic 10. Help and documentation
Even though it is better if the system can be used without
documentation, it may be necessary to provide help and
documentation. Any such information should be easy to
search, focused on the user's task, list concrete steps to be
carried out, and not be too large.
ICEIS2015-17thInternationalConferenceonEnterpriseInformationSystems
14
3 INSPECTION TECHNIQUE
FOR USABILITY
EVALUATION IN USE CASES
One of the artifacts often available in early stages of
the development is the use case. It is an important
artifact for both software development and for the
design of user interfaces. Moreover, it has been
suggested as a valuable artifact for including
usability attributes directly in the software
development process (Hornbæk et al., 2007).
Therefore, uses cases are an important artifact for
assessing the system’s usability.
We propose a usability inspection technique for
use case specification, the MIT 1. MIT 1, partially
illustrated in Table 2, aims to increase the
effectiveness of inspections, providing guidelines
that can be used by inspectors to analyse the use
cases and identify usability defects. Therefore, MIT
1 has verification items that serve as a guide to
interpret Nielsen’s heuristics, when applied to use
cases.
MIT 1 is divided into high and low detailed
level, respectively for use cases with high and low
level of details. The MIT 1 – High Detailed Level is
used for inspecting use cases that present
information such as error messages, informational
texts, warnings, name of screen, name of fields,
among others. The MIT 1 – Low Detailed, on the
other hand, is used for inspecting use cases that do
not present such information. The advantage of
having such division is that inspectors do not have to
waste time reading verification items that will not
help them finding problems for a particular type of
use case. The full version of MIT 1 is available
online in a technical report (Valentim and Conte,
2014a).
The steps of the inspection process of the MIT 1
technique are shown in Figure 1. These steps are: (1)
to evaluate the use case and (2) to identify usability
problems. In order to illustrate the MIT 1’s
inspection process, we have used it to evaluate the
usability of a use case specification. That
specification describes one functionality of an online
system for showing indicators of research and
development in Brazil. This specification is used in
the system to manage courses. In the next
paragraphs we describe how we applied the
inspection process steps to perform a simple
inspection of the use case specification of that
system.
The first step for the identification of usability
problems is to proceed with the evaluation of the
usability verification items. In other words, the
inspectors must check if the use case specification
meets each of the usability verification items. Table
2 shows six examples of the usability verification
items.
Table 2: Example of verification items of the MIT 1
(Valentim and Conte, 2014a).
MIT-1AA. Heuristic Visibility of system status
Verification
Item
MIT 1AA1
Verify if there are some text in the Main,
Alternative and Exception Flows which
informs where in the system the user is;
Verification
Item
MIT 1AA2
Verify if there are some text in the Main,
Alternative and Exception Flows which
informs the user what was done after data
persistence. For example, when changing or
deleting something, a text message is
displayed.
MIT-1AB. Match between system and the real world
Verification
Item
MIT 1AB1
Verify if the names of fields, screens, buttons,
links, error messages and informational texts
in the Main, Alternative, Exception Flows
and Business Rules have familiar concepts to
users, ie, follows the conventions of the real
world;
Verification
Item
MIT 1AB2
Verify if the options, screens or fields
reported by the system in the Main,
Alternative and Exception Flows are
presented in a natural and logical order
according to the concepts of the problem
domain.
MIT-1AE. Heuristic Error prevention
Verification
Item
MIT 1AE1
Verify if the Main, Alternative and Exception
Flows describe warnings from the system that
alert the user via messages (or informational
texts) that the actions he/she is performing
may be inappropriate at that moment.
Verification
Item
MIT 1AE2
Verify if all options, buttons and links that are
present in the application have names that
clearly define which results or states will be
achieved. This must be verified in the Main,
Alternative and Exception Flows and in the
Business Rules
In order to identify usability problems (second
step), inspectors must point in the use case
specification which part did not meet the usability
verification items. If we look at Figure 1 and Table 2
simultaneously, we can relate the nonconformity of
the usability verification items in Table 2 with the
augmented element A and B in Figure 1.
The Verification Item MIT 1AB2 suggests to
verify if the options, screens or fields are presented
in a natural and logical order according to the
concepts of the problem domain. However, the
screen “Course Registration – Training Center” does
not present the concepts of the problem domain
(seFigure Figure 1 element A). In other words, this
alternative flow specifies the functionality “Edit”
and the name of screen does not represent this
EvaluatinganInspectionTechniqueforUseCaseSpecifications-QuantitativeandQualitativeAnalysis
15
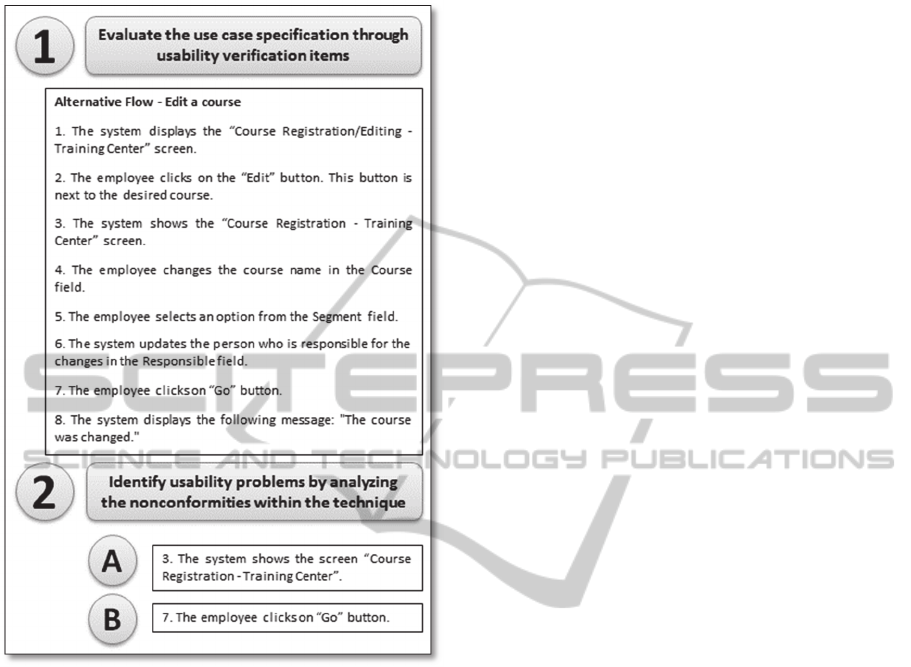
functionality. This is an example of a usability
problem.
Figure 1: Example of the Inspection Process of the MIT 1.
The Verification Item MIT 1AE2 suggests that
all options, buttons and links that are present in the
application should have names that clearly define
which results will be reached or which states will be
achieved. However, the "Go" button does not have a
name that clearly indicates what is achieved by
selecting it (see Figure 1 element B). In other words,
the name of the Go button is not representative for
the user. This is another example of a usability
problem.
4 CONTROLLED EXPERIMENT
In order to test the version 2 of the MIT 1 before
transfer it to the software industry, we performed a
feasibility study, using only the high detailed level
technique. MIT 1 was evaluated in comparison to
HEV, because: (a) HEV is an inspection method
widely used in industry (Fernandez et al., 2012); (b)
MIT 1 is derived from HEV and, thus, to compare
them is important to verify whether the derivation
(MIT 1) is better than the original method (HEV);
(c) the inspectors had a base knowledge in usability
principles, which allowed them to use the HEV.
4.1 Hypotheses
The study was planned and conducted in order to
test the following hypotheses (null and alternative,
respectively):
H01: There is no difference between the MIT 1
and HEV techniques regarding the efficiency
indicator.
HA1: There is a difference in the efficiency
indicator when comparing the MIT 1 and the
HEV techniques.
H02: There is no difference between the MIT 1
and HEV techniques regarding the effectiveness
indicator.
HA2: There is a difference in the effectiveness
indicator when comparing the MIT 1 and the
HEV techniques.
4.2 Context
We carried out the study with one of the use cases of
the online system for showing indicators of research
and development in Brazil (see an extract of such
use case in Figure 1). The experiment was conducted
with senior-level undergraduate students of the
Computer Science course at Federal University of
Amazonas. The students had already attended two
introductory classes about “Software Engineering”
and “Human Computer Interaction” and were
attending the “Design and Analysis of Software
Systems” class (2nd Semester/2013).
4.3 Variables Selection
The independent variables were the usability
evaluation techniques (MIT 1 e HEV) and the
dependent variables were the efficiency and
effectiveness indicators of the techniques. Efficiency
and effectiveness were calculated for each subject
as: (a) the ratio between the number of defects
detected and the time spent in the inspection
process; and (b) the ratio between the number of
detected defects and the total number of existing
(known) defects, respectively.
4.4 Selection of Subjects
Eighteen subjects signed a consent form and filled
out a characterization form that measured their
ICEIS2015-17thInternationalConferenceonEnterpriseInformationSystems
16
expertise with usability evaluation and software
development. The characterization form was
employed to categorize the subjects as having: none,
low, medium or high experience regarding usability
evaluation and software development. We
considered: (a) high experienced, subjects who had
participated in more than 5 usability
projects/evaluations in industry; (b) medium
experienced, subjects who had participated from 1 to
4 usability projects/evaluations in industry; (c) low
experienced, subjects who participated in at least
one usability project/evaluation in the classroom;
and (d) with no experience, subjects who had no
prior knowledge about usability or who had some
usability concepts acquired through
lectures/speeches but no practical experience.
Analogously, the subjects' expertise in software
development was classified following the same
standards. Table 3 (second and third columns) shows
each subject’s categorization.
4.5 Experimental Design
Subjects were divided in two groups, which would
inspect the same use case: the MIT's group and the
HEV's group. The subjects were assigned to each
technique using completely randomized design.
Each group was composed by 9 subjects.
4.6 Instrumentation
Several artifacts were defined to support the
experiment: characterization and consent forms,
specification of HEV and MIT 1 techniques,
instructions for the inspection, a worksheet for the
annotation of the identified discrepancies and a post-
inspection questionnaire. In addition, we used a use
case that is part of the specification of a real system
from a Training Center that manages courses (see
part of use case specification in Figure 1). All
artifacts were validated by the authors of this paper.
4.7 Preparation
All subjects received two-hour training on usability
evaluation. Additionally, for each group, we made a
15-min presentation about the technique that the
group would apply. Similar examples were shown
on how to use both techniques (MIT1 and Heuristic
Evaluation).
4.8 Execution
At the beginning of the study, a researcher acted as
moderator, being responsible for passing the
information from the evaluation to the inspectors.
Then, we divided the subjects into groups for each
technique and each group went to a different room.
Each subject received the artifacts described in
Subsection 4.6. During the inspection, each subject
filled out a worksheet with the find defects. All
subjects returned the worksheet containing the
possible defects and the total time spent in the
inspection. They also delivered the filled out follow
up questionnaires. Each inspector carried out the
problem detection activity individually. During the
detection activity, inspectors did not receive any
assistance from the researchers involved in the
study. Altogether, there were 9 inspectors using the
MIT 1 technique and 9 inspectors using the HEV
technique.
4.9 Discrimination
After the execution, the lists of individual
discrepancies were integrated into a single list,
removing the reference to the inspector who found
the discrepancy and the technique he/she had
applied. A team formed by one software engineer
(the author of the use case) and two usability experts
reviewed such list. This team decided which of the
discrepancies were unique and which were
duplicated (equivalent discrepancies pointed out by
more than one inspector). Also, the team decided
which discrepancies were real defects or false
positives.
5 QUANTITATIVE RESULTS
Table 3 shows the overall results of the usability
evaluation in use cases. We can see that inspectors
who used MIT 1 managed to find between 9 and 19
defects spending about 0.58 and 1.52 hours. On the
other hand, the inspectors that used HEV employed
between 0.38 and 1 hour, however they found
between 4 and 14 defects.
Table 3: Summary of inspection result per subject.
Sub. UE SD
#
Disc.
#
FP
#
Def.
Time
(hour)
Def./
Hour
S01
L N 26 7 19 1.40 13.57
S02
L N 12 1 11 0.97 11.38
S03
M L 14 2 12 0.63 18.95
S04
L N 14 1 13 1.02 12.79
S05
L N 18 2 16 1.52 10.55
S06
L L 12 0 12 0.58 20.57
S07
L N 20 5 15 0.83 18.00
EvaluatinganInspectionTechniqueforUseCaseSpecifications-QuantitativeandQualitativeAnalysis
17
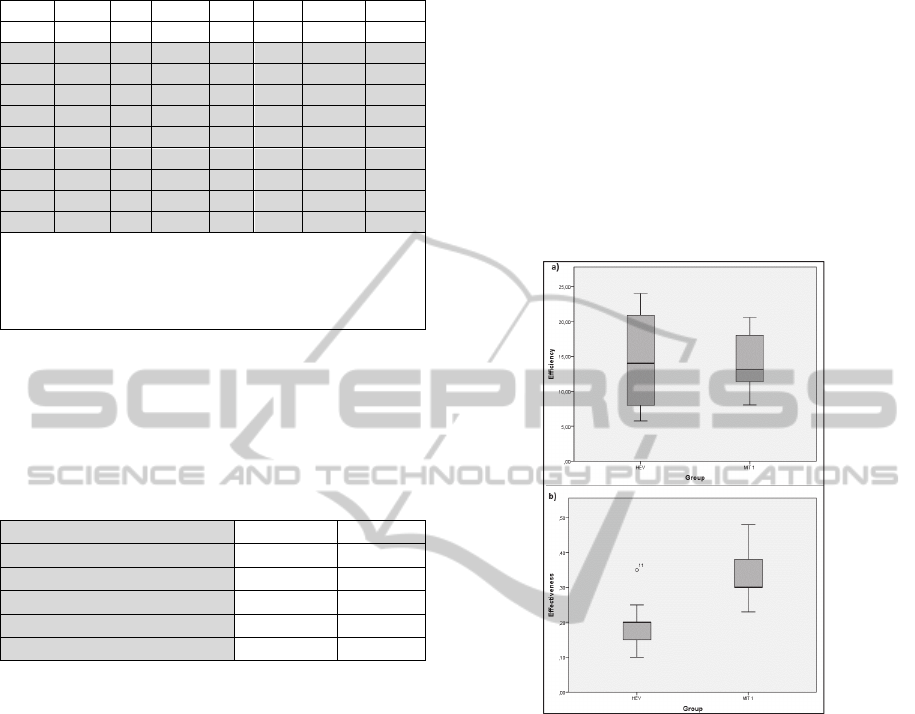
Table 3: Summary of inspection result per subject. (cont.)
S08
L N 14 2 12 0.92 13.90
S09
N N 11 2 9 1.12 8.06
S10
L N 12 2 10 0.42 24.00
S11
L N 17 3 14 0.62 22.70
S12
L N 11 3 8 1.00 8.00
S13
L N 9 3 6 0.83 7.20
S14
L N 4 0 4 0.50 8.00
S15
L L 13 5 8 0.38 20.87
S16
M N 8 0 8 0.45 17.78
S17
L N 9 4 5 0.87 5.77
S18
L N 9 2 7 0.50 14.00
Legend:
Sub – subject; UE - Experience in Usability Evaluation; SD -
Experience in Software Development; H - High; M - Medium;
L - Low; N - None; Disc - Number of discrepancies; FP -
Number of false positives; Def - Number of Defects.
Overall, the inspections resulted a set of 40
usability defects, including the 11 seeded ones.
Defects were seeded because there was the need to
have more defects to be found. Table 4 presents the
average effectiveness and efficiency.
Table 4: Effectiveness and efficiency per technique.
Technique MIT 1 HEV
Total Defects
119 70
Average Defects
13.22 7.78
Effectiveness
33.06% 19.44%
Average Time (min)
59.89 37.11
Efficiency (defects/hour)
13.25 12.57
We performed an analysis using the non-
parametric Mann-Whitney test (Mann and Whitney,
1947), given the limited sample size. We present the
summary of the results using a boxplot graph. The
statistical analysis was carried out using the
statistical tool SPSS V. 19, and α = 0.10. This choice
of statistical significance was motivated by the small
sample size used in this experiment. Figure 2 shows
the boxplot graph with the distribution of efficiency
per technique.
From Figure 2(a), it can be observed that the
MIT 1’s group had almost the same efficiency as the
HEV’s group. When we compared the two samples
using the Mann-Whitney test, we found no
significant differences between the two groups (p =
0.895). These results support the null hypothesis
H01 that states that there is no difference in the
efficiency indicator between the MIT 1 and HEV.
The same analysis was applied to determine
whether there was a significant difference
comparing the effectiveness indicator of the two
techniques in detecting usability defects. The
boxplots graph with the distribution of effectiveness
per technique (see Figure 2(b)) shows that the MIT
1's group was much more effective than HEV's
group when inspecting the usability of the use case.
Also, MIT 1's group median is much higher than
HEV's group median, and all of the MIT 1's group
boxplot is above HEV's group third boxplot quartile.
Furthermore, the Mann-Whitney test confirmed that
MIT 1’s effectiveness was significantly higher than
HEV’s effectiveness (p = 0.002). These results
suggest that the MIT 1 technique was more effective
than HEV when used to inspect the specification of a
use case in this study (support the hypothesis HA2).
Figure 2: Boxplots for (a) efficiency and (b) effectiveness.
6 ANALYSIS OF USER
PERCEPTION
After the quantitative analysis, the post-inspection
questionnaires about technology acceptance
concerning MIT 1 were analysed. Such
questionnaires have been defined based on the
indicators of Technology Acceptance Model - TAM
(Davis, 1989). The indicators defined were: (i)
perceived ease of use, which defines the degree in
which a person believes that using a specific
technology would be effortless, and (ii) perceived
usefulness, which defines the degree in which a
person believes that the technology could improve
his/her performance at work. The reason for
focusing on these indicators is that, according to
Davis (1989), these aspects are strongly correlated to
user acceptance.
ICEIS2015-17thInternationalConferenceonEnterpriseInformationSystems
18
Subjects provided their answers in a six-point
scale, based on the questionnaires applied by
Lanubile et al., (2003). The possible answers are:
totally agree, almost totally agree, partially agree,
partially disagree, almost totally disagree and totally
disagree. In that questionnaire, the inspectors
answered their degree of agreement with the
statements regarding ease of use and usefulness.
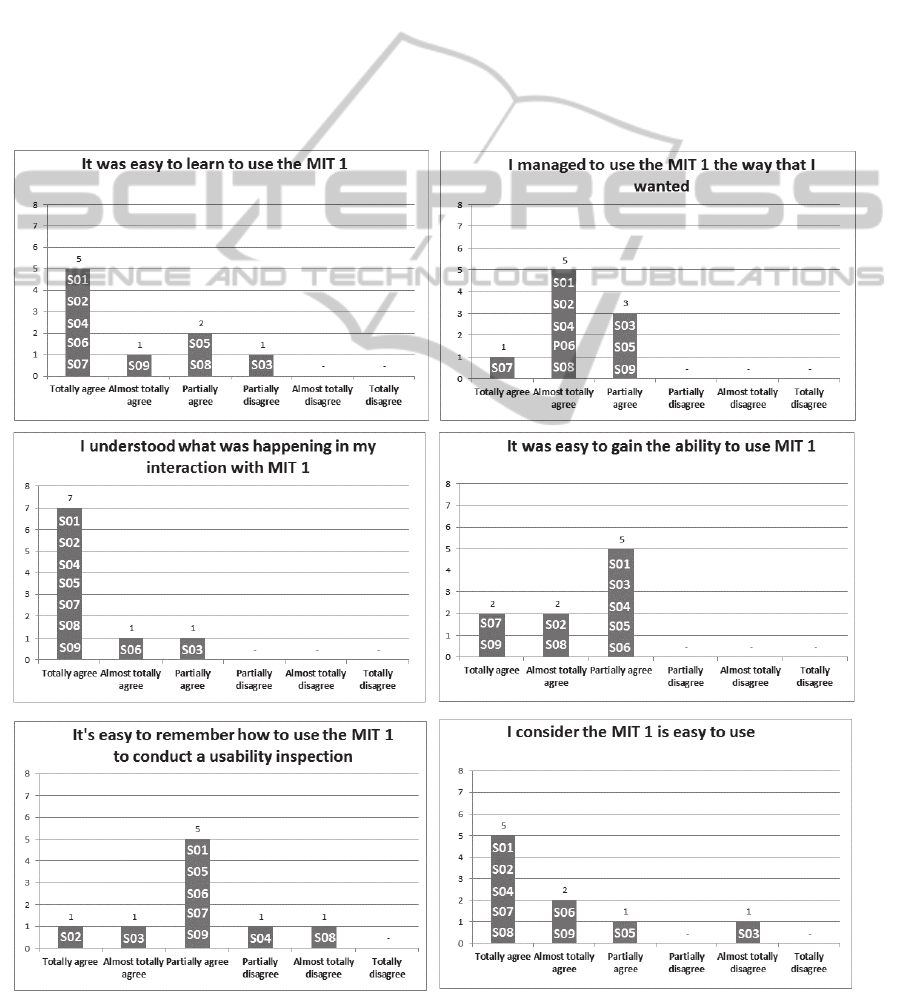
6.1 Perceived Ease of Use
Figure 3 presents the perceptions of the subjects
regarding the ease of use of the MIT 1. The X-axis
of the graphs in Figure 3 refers to the possible
answers of the post-inspection questionnaire and the
Y-axis refers to the number of subjects. The P01,
P02 and other codes represent the subjects presented
in Table 3.
It can be seen in Figure 3 that 7 out of 9 subjects
totally agreed with the statement “I understood what
was happening in my interaction with MIT 1”, given
confidence that the subjects understood what was
happening when they were using the MIT 1.
Another statement with which more than half of
the subjects totally agreed was “It was easy to learn
to use the MIT 1”, showing that the subjects did not
have much difficulty learning to use the MIT. It
should be noticed that subject S05 partially
disagreed with this statement “it was easy to learn to
use the MIT 1”, showing that MIT 1 is not so easy to
learn.
Figure 3: Subjects’ perception on ease of use of the MIT 1.
EvaluatinganInspectionTechniqueforUseCaseSpecifications-QuantitativeandQualitativeAnalysis
19
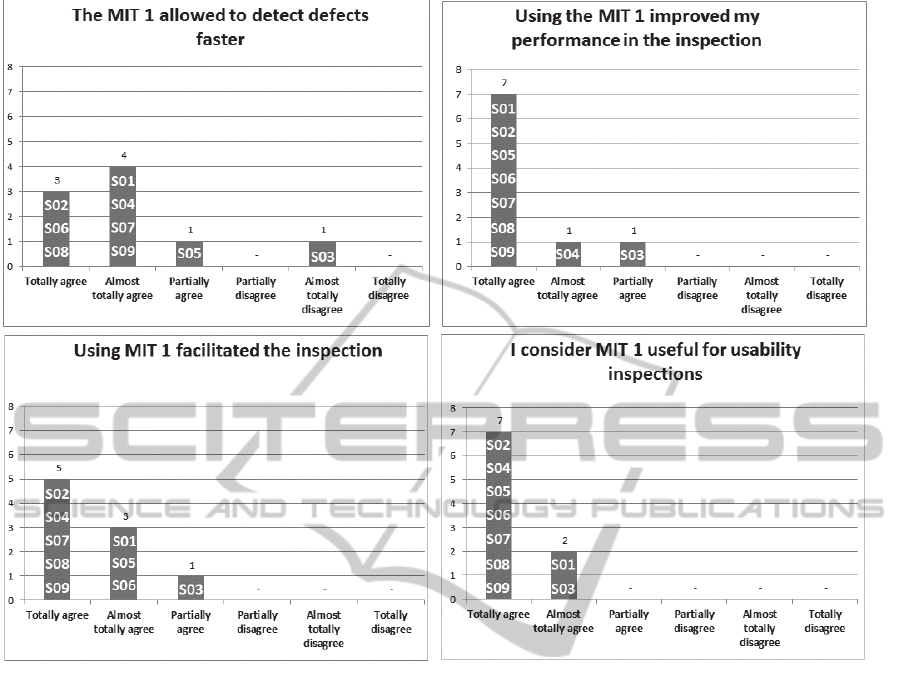
Figure 4: Subjects’ perception on usefulness of the MIT 1.
Two of the nine subjects (S04 and S08)
disagreed with the statement “It's easy to remember
how to use the MIT 1 to conduct a usability
inspection”, showing that MIT 1 is not so easy to
remember. The subject S03 almost totally disagreed
with the statement “I consider that the MIT 1 is easy
to use”, highlighting the difficulty he had when
using MIT 1. However, all inspectors agreed with
the other statements, showing their acceptance
regarding the MIT 1 technique.
6.2 Perceived Usefulness
Figure 4 presents the subjects’ perceptions regarding
the usefulness of the MIT 1. We verified that only
the subject S03 almost totally disagreed with the
statement “The MIT 1 allowed detecting defects
faster”, indicating that at some point the subject S03
found the use of the technique time-consuming.
However, all inspectors agreed with the other
statements, reinforcing that the MIT 1 is helpful in
the inspection process.
7 QUALITATIVE RESULTS AND
IMPROVEMENTS
Besides the analysis using the TAM model, we
carried out a specific analysis of the qualitative data
(additional comments from the inspectors) contained
within the questionnaires. We carried out such
analysis using the procedures of Grounded Theory
(GT) method (Corbin and Strauss, 2008).
The qualitative data that was extracted from the
post-inspection questionnaires was analyzed using a
subset of the phases of the coding process suggested
by Corbin and Strauss (2008) for the GT method:
open coding (1st phase) and axial (2nd phase). To
analyze the qualitative data, we created codes
(concepts relevant to understanding the perception
about the technique and its application process)
related to the subjects' speech - open coding (1st
phase). After that, the codes were grouped according
to their properties, forming concepts that represent
categories and subcategories. Finally, the codes were
ICEIS2015-17thInternationalConferenceonEnterpriseInformationSystems
20
related to each other - axial coding (2nd phase). GT
procedures aim at achieving a deeper analysis, by
comparing and analyzing the relationship between
these concepts. The purpose of the analysis in this
study was to understand the perception of the
inspectors on their experience using the MIT 1.
Since we did not intend to create a theory, we did
not perform the selective coding (3rd phase of GT
method). The stages of open and axial coding were
sufficient to the understanding the causes of some
problems in the application of the MIT 1. The
concepts related to the GT method are presented in
detail in Conte et al., (2009).
In this section, we discuss our qualitative results
about MIT 1. Our implications from these results are
described as follow.
7.1 Comments about Ease of Use of the
MIT 1 and Initial Developed
Improvements
This subsection provides information related to the
difficulties and advantages of the use of the MIT 1
technique that were collected in the experiment.
Some of the difficulties when using MIT 1 were:
there are heuristics that are only applicable to some
parts of the interface represented in the use case (see
quotation from S01 below); there is a large number
of verification items to evaluate the specification of
the use case (see quotation from S02 below); it is
difficult applying the MIT 1 (see quotation from S03
below); and it is difficult remembering the items of
the technique (see quotation from S06 below).
“(…) There are heuristics that apply only to
some [parts of the interface represented in the
use case] (...)”. (Subject 1).
“There are many sub-items to assess, [which]
may become a little confusing (...)”. (Subject 2).
“MIT 1 is a useful technique but difficult to
apply”. (Subject 3).
“There are many types of [items] to be
remembered, but with practice I might remember
most (...)”. (Subject 6).
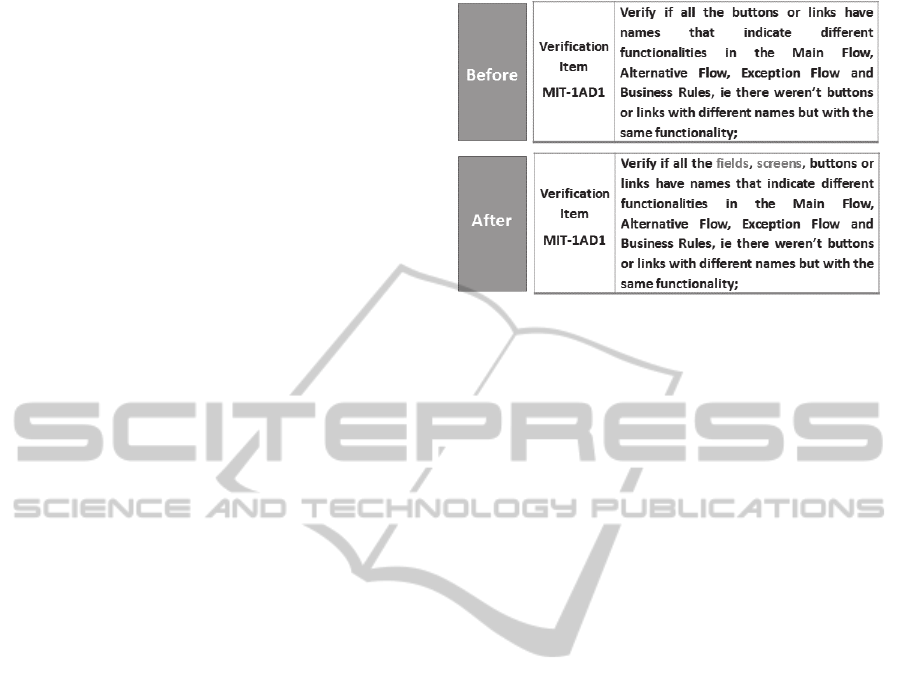
We can see that there were some difficulties and one
of them should be highlighted: there are heuristics
that are applied to only some parts of the interface
represented in the use case. This happened in the
verification item MIT-1AD1, because it suggests
checking if there is a problem only in the name of
the buttons or links. In order for this item to consider
other parts of the interface, we added two other
terms: “fields” and “screens” (see Figure 5).
Figure 5: Verification Item MIT-1AD1.
Similarly, the terms "field", "option" and
"screen" have been added in the verification item
MIT-1AI1. With these improvements, we tried to
make the technique more complete by considering
other parts of the interface represented in the use
case.
The subjects also had difficulties applying the
technique. This was seen by the Perceived Ease of
Use indicator (subsection 6.1) and by the responses
to the post-inspection questionnaire. The goal of the
MIT 1 is to help the inspector find the usability
problems in the use case. However, if the inspector
finds it difficult to use the technique, it is a sign that
it still needs to be improved. A deeper analysis is
being performed on each verification item so that
improvements would be carried out in the future.
7.2 Comments about the Structure of
MIT 1 and Initial Developed
Improvements
This subsection provides the point of view of the
subjects regarding the structure of the technique.
During this experiment, some inadequacies in the
structure of the technique were collected, such as:
there are similar verification items (see quotation
from S09 below) and that there are many heuristics
not used (see quotation from S05 below). Also, one
subject suggested grouping some heuristics (see
quotation below from S01).
“(...) There is some confusion in understanding
which statements we really need to specify (...),
since they contain similar specifications (...)”.
(Subject 9).
“(...) there are many heuristics that are applied
to different types of discrepancies and sometimes
not all are used (...)”. (Subject 5).
EvaluatinganInspectionTechniqueforUseCaseSpecifications-QuantitativeandQualitativeAnalysis
21

“[The] heuristics could be grouped in order to
assist in their identification using the field”.
(Subject 1).
We can see that there were some inadequacies in the
structure of the technique, for instance: some items
are identified as similar in technique. This probably
generated questions during the use of MIT 1. Thus,
an analysis of the frequency of use of each
verification item is being made, as well as an
analysis of the identified defects that were found by
more than one verification item. These analyses will
lead to the identification of verification items that
may be combined or better described.
8 THREATS TO VALIDITY
As in all studies, there are threats that could affect
the validity of our results. In this Section, we discuss
those threats; categorizing them using the same
approach as Wohlin et al., (2000): internal, external,
conclusion and construct.
8.1 Internal Validity
In our experiment, we considered four main threats
that represent a risk for an improper interpretation of
the results: (1) training effects, (2) experience
classification, (3) time measurement and (4)
influence of the moderator. There might be a
training effect if the training on the HEV technique
had lower quality than the training on the MIT 1. We
controlled training effects by preparing equivalent
training courses with the same examples of
discrepancies detection. Also, regarding subject
experience classification, this was based on the
subjects’ self-classification. They were classified
according to the number and type of previous
experiences (in usability evaluation and software
development). Considering time measurement, we
asked the subjects to be as precise as possible, and
the moderator also checked the time noted by each
subject when he/she delivered his/her worksheet.
Finally, to reduce the threat regarding the influence
of the moderator on the results of the study, a team
of experts did an analysis over the identified
discrepancies. Such team judged if the discrepancies
were usability defects or not, without the
interference from the moderator.
8.2 External Validity
Five issues were considered: (1) subjects were
undergraduate students; (2) the study was conducted
in an academic environment; (3) the validity of the
evaluated model as a representative model; (4) the
researcher seeded some defects in the model; and (5)
subjects required training. Regarding Issue 1, few
subjects had experience in industry since they were
only senior-level undergraduate students. According
to Carver et al., (2003), students who do not have
experience in industry may have similar skills as less
experienced inspectors. Regarding Issue 2, the
inspected artifact (use case) is a model that is part of
the specification of a real system. However, it is not
possible to state that the model used within the
inspection represents all types of use case (Issue 3).
Regarding Issue 4, all seeded usability problems
were found by both groups of subjects. Furthermore,
the number of defects found by the inspectors in
both groups was much larger than the number of
defects seeded by the searcher. Finally, regarding
Issue 5, it would be ideal if there was no training
needed in order to apply the technique. However, the
short time spent in training allows developers to use
the technique without prior experience in usability
evaluation.
8.3 Conclusion Validity
In this study, the main problem is the size and
homogeneity of the sample. The small number of
data points is not ideal from the statistical point of
view and furthermore, the subjects are all students
from the same institution. Sample size is a known
problem in studies of IHC and ES (Conte et al.,
2007; Fernandez et al., 2012). Due to these facts,
there is a limitation in the results, which should be
considered indicators and not conclusive ones.
8.4 Construct Validity
We measured efficiency and effectiveness that are
two measures often used in studies that investigate
defect detection techniques (Fernandez et al., 2012).
9 CONCLUSION AND FUTURE
WORK
This paper presented a feasibility study aimed at
comparing two techniques of usability inspection,
MIT 1 and HEV (Nielsen, 1994), in terms of
efficiency and effectiveness. Through the analysis of
the quantitative results of the experiment, we
verified that the MIT 1 showed slightly better
efficiency than the HEV. However, no statistically
ICEIS2015-17thInternationalConferenceonEnterpriseInformationSystems
22

significant difference was found. Regarding the
effectiveness indicator, MIT 1 had a significantly
higher performance than the group that used the
HEV. These results were also confirmed by the
Mann-Whitney test.
From the analysis of user perception we can see
that, in general, most inspectors agreed with the
statements regarding perceived ease of use and
perceived usefulness of the technique. These results
show evidence of ease of use when applying MIT 1.
The fact that MIT 1 had a good acceptance from the
inspectors of the experiment might indicate that this
technique is also suitable for inspectors with low
knowledge on usability inspections. Also, inspectors
stated that the technique has verification items that
are easier to understand and use.
The qualitative analysis enabled the
identification of difficulties when using the MIT 1 in
this feasibility study, such as: items that did not
consider parts of the system described within the use
case interface, the existence of similar items, among
others. These qualitative results led to the initial
improvement of the MIT 1 technique. Some of the
improvements were the reviewing of the verification
items, making them more complete. However, a
deeper analysis of the verification items is being
conducted to improve the technique.
As future work, we intend to carry out new
empirical studies, to ensure the quality of the
technique for its future transfer to industry.
Furthermore, there is another usability evaluation
technique proposed for use case in the literature,
called Use Case Evaluation (Hornbæk et al., 2007).
In the future, we intend to compare MIT 1 to this
method and to conduct studies with industry
subjects.
We expect that the results presented in this paper
are useful for the promotion and improvement of the
current practice and research in usability evaluation.
We also hope that the proposed technique assists the
evaluation of models that are employed in the early
stage of the development process, improving their
quality at a low cost.
ACKNOWLEDGEMENTS
We thank all the undergraduate students from
Federal University of Amazonas who participated in
the empirical study. And we would like to
acknowledge the financial support granted by
CAPES (Foundation for the Improvement of Highly
Educated Personnel) through process AEX
10932/14-3 and FAPEAM (Foundation for Research
Support of the Amazonas State) through processes
numbers: 062.00146/2012; 062.00600/2014;
062.00578/2014; and 01135/2011.
REFERENCES
Carver, J., Jaccheri, L., Morasca, S., Shull, F. “Issues in
Using Students in Empirical Studies in Software
Engineering Education”. In Proceedings of the 9th
International Symposium on Software Metrics, (2003),
Sydney, Australia, pp. 239 – 249.
Conte, T., Massolar, J., Mendes, E., et al. “Usability
Evaluation based on Web Design Perspectives”. In
Proceedings of the First International Symposium on
Empirical Software Engineering and Measurement,
(2007), pp. 146 – 155.
Conte, T., Cabral, R., Travassos, G. H. “Applying
Grounded Theory in Qualitative Analysis of an
Observational Study in Software Engineering – An
Experience Report”. In INFOCOMP Journal of
Computer Science, v.2 (1), (2009), pp. 58-69.
Corbin, J and Strauss, A. Basics of Qualitative Research.
Techniques and Procedures for Developing Grounded
Theory. Sage, Thousand Oaks, USA (2008).
Davis, F. “Perceived usefulness, perceived ease of use,
and user acceptance of information technology”. In
MIS Quarterly, (1989), v. 13, n. 3, pp. 319 – 339.
Fernandez, A., Insfran, E., Abrahão, S. Usability
evaluation methods for the web: A systematic
mapping study". In: Journal of Information and
Software Technology (2011), v. 53, issue 8, pp. 789 -
817.
Fernandez, A., Abrahão, S., Insfran, E., Matera, M.
“Further analysis on the validation of a usability
inspection method for model-driven web
development”. In Proceedings of International
symposium on Empirical software engineering and
measurement (ESEM), Lund, Sweden (2012), pp. 153-
156.
Følstad, A., Law, E. L., Hornbæk, K. “Analysis in
usability evaluations: an exploratory study”. In 6th
Nordic Conference on Human-Computer Interaction.
Reykjavik, Iceland (2010), pp. 647-650.
Hornbæk, K., Høegh, R. T., Pedersen, M. B., Stage, J.
“Use Case Evaluation (UCE): A Method for Early
Usability Evaluation in Software Development”. In
Proceedings of the 11th International Conference on
Human-Computer Interaction, Rio de Janeiro (2007),
pp. 578–591.
ISO, International Organization for Standardization,
ISO/IEC 25010, Systems and software engineering –
SquaRE – Software product Quality Requirements and
Evaluation – System and Software Quality Models
(2011).
Juristo, N., Moreno, A., Sánchez, M., Baranauskas, M. C.
C. “A Glass Box Design: Making the Impact of
Usability on Software Development Visible”. In
EvaluatinganInspectionTechniqueforUseCaseSpecifications-QuantitativeandQualitativeAnalysis
23

Conference on Human-Computer Interaction
(INTERACT), v. 4663 (2007), pp. 541 – 554.
Lanubile, F., Mallardo, T., Calefato, F. “Tool support for
Geographically Dispersed Inspection Teams”. In
Software Process Improvement and Practice, (2003),
v. 8, pp, 217 – 231.
Mann, H. B., Whitney, D. R. “On a Test of Whether one
of Two Random Variables is Stochastically Larger
than the Other”. In Annais of Mathematical Statistics,
v. 18 (1947), pp. 50 – 60.
Matera, M., Costabile, M. F., Garzotto, F., Paolini, P.
“SUE Inspection: An Effective Method for Systematic
Usability Evaluation of Hypermedia”. In IEEE
Transactions on Systems, Man and Cybernetics, Part
A, v. 32 (2002), pp. 93 – 103.
Nielsen, J., “Heuristic evaluation”. “In Usability
Inspection Methods (Eds. Nielsen, J., and Mack, R.L.),
John Wiley & Sons, New York (1994).
Seffah, A., Djouab, R., Antunes, H. “Comparing and
Reconciling Usability-Centered and Use Case-Driven
Requirements Engineering Processes”. In Proceedings
of the 2nd Australasian conference on User interface,
IEEE, Los Alamitos (2001), pp. 132 – 139.
Shull, F., Carver, J., Travassos, G. H., “An empirical
methodology for introducing software processes.”
ACM SIGSOFT Software Engineering Notes, v. 26, n.
5, (2001), pp. 288-296.
Valentim, N. M. C., Oliveira, K. M, Conte, T. “Defining
an Approach for Usability Inspection in Design
Models through Experimentation” (in Portuguese). In:
Proceedings of the 12th Brazilian Symposium on
Human Factors in Computing Systems (IHC), Cuiabá
– MT, 2012, pp. 165 – 174.
Valentim, N. M. C., da Silva, T. S., Silveira, M. S, Conte,
T. “Comparative study between usability inspection
techniques about activity diagrams” (in Portuguese).
In: Proceedings of the 12th Brazilian Symposium on
Human Factors in Computing Systems (IHC), Manaus
– AM, 2013, pp. 92 – 101.
Valentim, N. M. C., Conte, T. “Technical Report: Version
2 of MIT 1”, Report Number 003, (2014a). Available
at: http://uses.icomp.ufam.edu.br/.
Valentim, N. M. C.; Conte, T. Improving a Usability
Inspection Technique based on Quantitative and
Qualitative Analysis (in Portuguese). In Brazilian
Symposium on Software Engineering (SBES), (2014b),
pp. 171 - 180.
Wöhlin, C., Runeson, P., Höst, M., Ohlsson, M. C.,
Regnell, B., Wessl, A. “Experimentation in software
engineering: an introduction”. Kluwer Academic
Publishers, (2000).
ICEIS2015-17thInternationalConferenceonEnterpriseInformationSystems
24
