
An Empirical Study of Recommendations in OLAP Reporting Tool
Natalija Kozmina
Faculty of Computing, University of Latvia, Raina blvd. 19, Riga, Latvia
Keywords: OLAP Personalization, Report Recommendations, Data Warehouse Reporting.
Abstract: This paper presents the results of the experimental study that was performed in laboratory settings in the
context of the OLAP reporting tool developed and put to operation at the University. The study was
targeted to explore which of the modes for generating recommendations in the OLAP reporting tool has a
deeper impact on users (i.e. produces more accurate recommendations). Each of the modes of the
recommendation component – report structure, user activity, and semantic – employs a separate content-
based method that takes advantage of OLAP schema metadata and aggregate functions. Gained data are
assessed (i) quantitatively by means of the precision/recall and other metrics from the log-table analysis and
certain statistical tools, and (ii) qualitatively by means of the user survey and feedback given in a free form.
1 INTRODUCTION
In (Business Dictionary) personalization is defined
as “creation of custom-tailored services that meet
the individual customer’s particular needs or
preferences”. Personalization can be provided by
adjusting data and its visualization according to user
preferences. In this paper report recommendations
are considered as one of the aspects of OLAP
personalization, since they are the result of user
preference analysis.
The field of personalization in OLAP is being
explored among the researchers worldwide.
Golfarelli and Rizzi (2009) stated that
personalization in data warehouses still deserves
more attention by researchers and needs to be
examined more thoroughly both on theoretical and
practical level. There are three main reasons to study
personalization in data warehouses (Golfarelli and
Rizzi, 2009): (i) user preferences allow a user to
focus on the data that seems to be the most essential,
more precisely – while composing and executing
queries, user preferences would be a natural way
how to avoid both an empty set of results and data
flooding; (ii) preferences allow user to specify a
pattern of what data to select as during OLAP
sessions a user might not know exactly what he/she
is looking for; and (iii), to give a user an opportunity
to express preferences on aggregated data.
The experience in using standard commercial
applications for producing and managing data
warehouse reports (for instance, Oracle Business
Intelligence Discoverer and MicroStrategy) at the
University as well as participation in scientific
projects and development of OLAP reporting tool
(Solodovnikova, 2010) served as a complimentary
motivation for further studies in the field of OLAP
personalization. The OLAP reporting tool is a
suitable environment for implementing and testing
the developed techniques of OLAP personalization.
In this tool recommendations on OLAP reports are
implemented so that the users of the reporting tool
would get some guidance on what else to examine.
The rest of the paper is organized as follows: in
Section 2 an overview of the related work is given,
Section 3 shortly describes the recommendation
modes in the OLAP reporting tool and
corresponding methods, in Section 4 the design of
the empirical study is presented and its results are
given, Section 5 concludes the paper, and future
work is described in Section 6.
2 RELATED WORK
Personalization in OLAP can be expressed in
different ways, for instance, by creating an adapted
fact table during the user session according to user
needs and performed actions, or by supplementing
existing hierarchies with new levels based on user
303
Kozmina N..
An Empirical Study of Recommendations in OLAP Reporting Tool.
DOI: 10.5220/0005374503030312
In Proceedings of the 17th International Conference on Enterprise Information Systems (ICEIS-2015), pages 303-312
ISBN: 978-989-758-096-3
Copyright
c
2015 SCITEPRESS (Science and Technology Publications, Lda.)

preferences stated by user-defined constraints, or by
perceiving visualization in OLAP as the key method
for both query specification and data exploratory
analysis, or by providing report recommendations.
The most meaningful studies cover
recommendations with user session analysis and
recommendations with user profile analysis.
In recommendations with user session analysis
(Giacometti et al., 2009, 2011; Marcel, 2014) a
query log is examined on the subject of patterns of
users’ data analysis performed during previous
sessions. As stated by Marcel (2014), log processing
helps to identify the goal of user’s analysis session.
Measure values are being compared and a
significant unexpected difference in data is being
detected. The emphasis is not on recommending
queries from sessions that are prior to the current
session, but on recommending queries from all
sessions, where a user had found the same
unexpected data as in the current session. In
(Giacometti et al., 2009) a concept of a “drill-down
(or roll-up) difference query” is introduced, which is
classified as such, if the result of this query confirms
the difference of measure values at a lower level of
detail (for drill-down) and at a higher level of detail
(for roll-up). Another recently developed approach
that exploits past user experience with queries to
assist in constructing new queries is presented in
(Khemiri & Bentayeb, 2012). In this case, a user can
build a query being guided by the most frequently
employed query elements extracted from the past
queries that are connected to the current query of a
user by some association rules. A new trend of
recommendations in OLAP is set by Aligon et. al
(2014). They explore and measure the similarity of
OLAP sessions (or query sequences) not OLAP
queries, thus, the recommended product is the whole
session. The latest study by Aligon et. al (2015)
supports the idea of OLAP session similarity and
supplements it with a collaborative filtering
approach, i.e. the set of available OLAP sessions is
extended by sessions of other users.
In recommendations with user profile analysis
Jerbi et al. (2009) propose a context-based method
for providing users with recommendations, where
user preferences are stated in the user profile with
restriction predicates on data. The approach
presented by Jerbi et al. (2009) was interpreted and
implemented by (Chaibi & Gouider, 2013). An
analysis context includes two disjoint sets of
elements: a set of OLAP schema elements – fact
tables, measures, dimensions, attributes, etc. and a
set of its values. Restriction predicates, i.e.
restrictions on data values of measures (associated
with an aggregate function) or conditions on data
values of dimension attributes, are ranked with the
relevance score (a real number in the range [0; 1]).
Preferences stated in the user profile, analysis
context of which matches with the analysis context
of the current query, are integrated in the current
query, thus, providing more customized content, and
such query is recommended to a user.
The ability to express preferences on the level of
OLAP schema elements (or schema-specific
preferences) is beneficial for a user who is
unfamiliar with the structure of data warehouse
report or uncertain about the data of interest, as well
as for an active reporting tool user who would like
to keep track of new and existing reports of interest.
All of the methods for producing report
recommendations briefly presented in section 3 take
advantage of OLAP schema elements, its
interconnections, and acceptable aggregate
functions. The methods are suitable for different
groups of users – novice, advanced or expert.
Neither of the observed OLAP query
recommendation techniques with user session or
user profile analysis generates recommendations
analyzing OLAP schema and its elements. In this
paper, the similarity of OLAP sessions proposed by
(Aligon et. al., 2014, 2015) is not considered,
because the "units" compared are queries (or
reports), not OLAP sessions.
Moreover, a cold-start user (i.e. a user with no
previous activity in the system) issue, which is very
common in recommender systems, was not tackled
in the context of OLAP. One of the methods for
producing report recommendations (see section 3.2)
deals with this problem to provide report
recommendations to users with poor or absent
activity history.
Another contribution of this paper is a
comparison of methods for providing report
recommendations on how user preferences are being
gathered – either explicitly (e.g. in a user profile) or
implicitly (e.g. in a query log). The choice of the
approach to gather user preferences
(implicit/explicit) is not well-grounded by other
authors, and neither was discussed the aspect of
setting user preferences with business terms. Thus,
in the empirical study methods employing user
preferences gathered either explicitly or implicitly
are opposed to each other to draw conclusions on
which of the two approaches is rated higher by users
and to understand whether users agree to invest
effort into completing their user profile.
ICEIS2015-17thInternationalConferenceonEnterpriseInformationSystems
304

3 RECOMMENDATION MODES
IN THE OLAP REPORTING
TOOL AND UNDERLYING
METHODS
Users of the reporting tool may have various skill
levels (e.g. expert, novice), which is why different
methods for generating report recommendations
based on user preferences are applied. Methods for
providing report recommendations involve
implicitly acquired user preferences (i.e. gained
automatically from user activity log) that make up a
user profile and explicitly stated user preferences
(i.e. provided directly by user in the profile). Each
method is exploited in the mode, in which a user
receives recommendations in the reporting tool.
Naturally, recommendations in each mode are
presented as a list of links to reports with similarity
values sorted in descending order.
The methods for generation of report
recommendations are very briefly described in this
section, since they are the subjects of separate
papers of the author.
3.1 User Activity Mode
The user activity mode (M
UA
) employs the hot-start
method for generation of recommendations. It is
applied for a user who has had a rich activity history
within the reporting tool.
The hot-start method is composed of two steps.
Firstly, user preferences for data warehouse schema
elements are discovered from the history of user’s
interaction with the reporting tool stored in a log-
table and gathered in a user profile (Kozmina and
Solodovnikova, 2011; Kozmina, 2013). Secondly,
reports are determined that are composed of data
warehouse schema elements potentially the most
interesting to a user. Weights of schema elements
are used to propagate the degree of interest (DOI)
from sub-elements (e.g. attributes, measures) to the
elements of higher level (e.g. fact tables,
dimensions, schemas). When a new schema is
defined in the data warehouse repository, weights of
the new schema elements are calculated and weights
of the existing schema elements are adjusted.
DOIs are calculated according to a specific
algorithm. When DOIs are updated in the user’s
OLAP preferences, the user profile is compared
with all reports defined in the reporting tool
metadata and reports, which are potentially
interesting for the user, are determined. User’s
schema-specific OLAP preferences are compared
with schema elements used in each report to
estimate the hierarchical similarity between a user
profile and a report. The hierarchical similarity
depends on the number of schema elements used in
the report and the DOIs set for these elements in the
user profile.
3.2 Report Structure Mode
The report structure mode (M
RS
) employs the cold-
start method for generation of recommendations. It
is applied when a user of the reporting tool starts
exploring the system or a user has a poor activity
history (i.e. the number of activity records is lower
than some pre-defined threshold value).
The essence of cold-start method is as follows:
firstly, structural analysis of existing reports is
performed, and secondly, likeliness between each
pair of reports is revealed (Kozmina and
Solodovnikova, 2011; Kozmina, 2013). To measure
likeliness (also referred to as similarity),
Cosine/Vector similarity is applied.
The cold-start method addresses two issues most
common in recommender systems: a new item or
long-tail as in (Park and Tuzhilin, 2008) issue and a
cold-start user (i.e. a user with no previous activity
in the system) issue. The main point of a new item
or long-tail issue in recommender systems is that
items, which are either newly added to the system or
unpopular (i.e. received too few rating set by users),
are never recommended, because the overall rating
score based on user ratings is either absent or too
low. In the cold-start method the new item issue
along with the cold-start user issue is solved, since
the likeliness between reports is defined irrespective
of user activity. More precisely, similarity scores
that reflect likeliness are recalculated each time a
new report is being created, an existing report is
being deleted or any kind of changes in existing
reports are being made.
3.3 Semantic Mode
In semantic mode (M
S
) semantic metadata is
considered as a means of formulating user
preferences for data warehouse reports explicitly
applying a pre-defined description of data
warehouse schema elements (Kozmina and
Solodovnikova, 2012). To be more precise, a user
formulates his/her preferences employing
understandable business terms and assigns an
arbitrary DOI to each preference.
AnEmpiricalStudyofRecommendationsinOLAPReportingTool
305

In the reporting tool one may set preferences
manually (or explicitly) by choosing appropriate
semantic terms that describe OLAP schema
elements and assigning a specific DOI to a
particular attribute or measure represented by
semantic metadata. For explicitly defined schema-
specific preferences, it is possible to apply the
adapted hot-start method (referred as semantic hot-
start method) for providing recommendations on
reports.
The steps to be performed to process user
preferences defined with semantic data are as
follows. First, a user defines schema-specific OLAP
preferences with semantic terms. To limit the set of
terms, the user should select a glossary that seems to
be the most suitable and understandable for him/her
and choose one of the synonym terms from the
glossary. Then, user preferences are normalized
transforming terms into concepts, because a set of
terms corresponds to exactly one concept.
Afterwards, user preferences are re-formulated
employing OLAP schema elements instead of
concepts. Next, in compliance with the OLAP
preferences metamodel (Kozmina and
Solodovnikova, 2012), a user should assign a DOI
to each of the OLAP preferences, i.e. a quantitative
value (e.g. natural numbers 1–100), which is
normalized to the interval [0; 1]. After the schema
elements used in the report are determined, user’s
DOI for all employed schema elements is updated
hierarchically starting from the elements of the finer
level of granularity, i.e. attributes and measures.
Then, the similarity score between a report and a
user profile is computed by means of the
hierarchical similarity.
4 AN EMPIRICAL STUDY ON
RECOMMENDATION MODES
AND ITS RESULTS
The experimental study was performed in laboratory
settings and was targeted to explore which of the
methods for generating recommendations in the
reporting tool has a deeper impact on users (i.e.
produces more accurate recommendations).
Limitation of the study is that recommendations
in the reporting tool are generated individually for
each user taking as an input his/her preferences
only. It is done this way, because users of the
reporting tool might have different rights on reports.
Thus, recommendations generated for a group of
users with similar preferences, might be of little help
to a certain user, because he/she doesn’t have the
rights to execute a number of report(s) from the
recommendation list.
4.1 The Goal of the Experimentation
and Research Questions
The goal template of the Goal/Question/Metric
(GQM) method introduced by Basili (1992) was
adopted to formulate the goal of the experiment:
Analyze methods for generation of report
recommendations implemented in OLAP reporting
tool for the purpose of evaluation with respect to
their performance from the point of view of the
researcher in the context of laboratory settings.
Two research questions (RQ1 and RQ2) to be
covered in this empirical study are the following:
RQ1 – Which of the implemented modes (and its
underlying methods) of generating report
recommendations in the OLAP reporting tool – i.e.
user activity, reports structure, or semantic mode –
has a deeper impact on users?
RQ2 – Which of type of methods for gathering
user preferences – implicit (implemented in user
activity mode and reports structure mode) or
explicit (implemented in semantic mode) – has a
deeper impact on users?
A mode has a deeper impact on a user (or, in
other words, outperforms the other mode), if it
produces recommendations with more accuracy
(which can be measured) and leads to completing
the task using the recommendation component of
the reporting tool extensively.
To evaluate recommendations in each mode,
measures Precision/Recall and F
1
-measure are
applied – see section 4.3 for more detailed measure
description and section 4.5 for the analysis results.
A task is one of the exploratory tasks of equal
complexity, which is assigned to a user in a certain
recommendation mode. There are 4 tasks in each
user group and each task consists of 4 subtasks.
Each subtask implies some data to be found in terms
of a single report. All subtasks are neither trivial,
nor sophisticated, because in each of them a user has
to be able to understand and find the necessary
reports and data, change report settings (e.g.
parameters and page items), etc.
First, users complete a test task in the mode with
no recommendations, then the 1st task in report
structure mode, the 2nd task in the semantic mode,
and finally, the 3rd task in user activity mode. The
task order is the same for all users, but tasks vary
ICEIS2015-17thInternationalConferenceonEnterpriseInformationSystems
306

depending on the user group and rights on reports.
4.2 Subjects
An experiment was conducted with a set of report
data on user interaction with Moodle course
management system (referred as Moodle or Moodle
CMS) and study process in the University. 70
reports had been available for the subjects.
The population for the experiment consists of
dedicated and motivated participants (or subjects)
related to the University and interested in the
reports. Moreover, either the subjects are Moodle
users and are directly involved in the study process
(e.g. students and academic staff) or they are
interested in an overview of user activity in Moodle
and study process (e.g. administrative staff). All of
the subjects are perceived as decision-makers which
to lesser or greater extent affect business processes
(e.g. department directors monitor study process and
make investment decisions whereas students follow
reports on grades and make decisions on which
courses to attend).
Moodle is not actively employed in all faculties
of the University, thereby, the scope of participants
narrows to active users of Moodle CMS, namely,
representatives of the Faculty of Computing, IT and
Academic department.
In statistics a rule of thumb suggested by Roscoe
(1975) is that in experimental research samples of
30 or more are recommended, which is why there
are 30 participants of the experimental study. There
were 3 groups of subjects according to the
distinction in rights on report data, thus, making the
population more diverse and closer to the real-life
circumstances:
Students (10 subjects). The main consumers of
the Moodle e-course content. In the reporting
tool they would be interested to get detailed data
that mostly describes them, e.g. their grades and
activities in Moodle and study process.
Academic staff (8 subjects). The ones who
participate in the the study process and in
content creating for Moodle CMS (e.g. lecturers,
professors). In the reporting tool they would be
interested to get general data such as student
progress in their courses, etc.
Administrative staff (12 subjects). The ones who
monitor study process and make decisions on
how to invest in the study process (e.g.
department directors). In the reporting tool they
would be interested to get data generalized on
the level of faculty or study program, e.g. usage
of Moodle tools by professors and students.
4.3 Variables
Each mode (M
UA
, M
RS
, and M
S
) has an underlying
method of generating report recommendations in the
OLAP reporting tool (hot-start, cold-start, and
semantic hot-start respectively). To evaluate the
quality of recommendations in each mode
Precision/Recall metrics are applied. Suppose that
throughout the whole session of user’s interaction
with the reporting tool one can detect a set of reports
that have been relevant for the user in terms of
providing data of interest (RL) and a set of ones that
haven’t been (NRL). Meanwhile, a user has two
options while exploring reports in order to collect
necessary data – whether to use a recommendation
component or not. The characteristics of the
possible outcomes are:
True positive (TP) – the number of relevant
reports that the user examined by means of
hitting the link in the recommendation
component (reports belong to RL set correctly
labeled as relevant);
False positive (FP) – the number of irrelevant
reports in the recommendation component
(reports belonging to NRL set mistakenly labeled
as relevant);
False negative (FN) – the number of relevant
reports that the user examined not following the
recommendation link (reports belonging to RL
set mistakenly labeled as irrelevant);
True negative (TN) – the number of irrelevant
reports that were not displayed as
recommendations during the session (reports
belonging to NRL set correctly labeled as
irrelevant).
The values of TN do not characterize the usage
of recommended reports and does not affect
Precision (P) and Recall (R), therefore, it is
excluded from further evaluation.
The value of P (P=TP/(TP+FP)) is the ratio of
reports accessed by a user via recommendation link
and executed to the total number of relevant and
irrelevant reports in the recommendation
component.
The value of R (R=TP/(TP+FN)) is the ratio of
reports to execute that were accessed by user via
recommendation link and executed to the total
number of reports classified as relevant and
executed by user (i.e. recommendations that were
accessed either by following or not following a
recommendation link).
AnEmpiricalStudyofRecommendationsinOLAPReportingTool
307

F
1
-measure (or F
1
-score, F
1
=2*P*R/(P+R)) is a
measure of test’s accuracy that combines P and R
into a single value by calculating different types of
means of both metrics (Schroder et al., 2011).
4.4 Design Principles
The design principle applied to subjects was
blocking on rights (students/academic
staff/administrative staff) or blocking on experience
with reporting tools (novice/advanced users &
experts). The population was chosen randomly, but
with several restrictions (exclusion criteria): (i) a
subject should have been a dedicated Moodle user
or directly involved in the study process, (ii) a
subject should have been interested in taking part in
the experimentation, and (iii) if the subject was a
representative of more than one group, then he/she
could take part in the experiment only once.
The subjects had to perform 4 different tasks
consecutively and individually: one task not
applying any recommendation mode, and 3 tasks
applying a certain recommendation mode – one task
in report structure mode (M
RS
), one task in semantic
mode (M
S
), and one task in user activity mode
(M
UA
). The tasks differ in each of 3 groups of
subjects. The time required for completing each task
depended on individual abilities of each subject in
particular (e.g. experience in reporting tools,
knowledge of data domain), which is why there was
no strict time frame. Each task was considered to be
finished, when a subject had completed all 4
subtasks. Average time per participant to complete
all 4 tasks was 1 hour 30 minutes.
Then, each user had to fill in a survey on each of
the tasks with 16 questions in total. The questions
touched upon task clarity and complexity as well as
if the recommendations were helpful and if the user
had mostly used Top3 recommendations. In general
questions users: (i) themselves stated their
experience with reporting tools, (ii) compared task
completion in any of the recommendation mode
(1st–3rd task) with that without any
recommendation mode (test task), (iii) stated the
task(s) in which they used recommendation
component most of all, and (iv) stated the task(s)
where they have received the most precise
recommendations. Also, users could leave their
comments in free form in the end of the survey.
During the individual meeting each subject was
given an oral explanation considering the whole
process of the experimentation as well as the data
about the subject that was going to be collected and
used to perform analysis and prepare summary of
the study. Then, the demonstration of how to use the
reporting tool followed.
4.5 Results of the Log-table Analysis
All values of TP, FP, FN, P, R, and F
1
-measure were
gained from experimental tasks completed in report
structure (M
RS
), semantic (M
S
), and user activity
(M
UA
) modes. Particular logging procedures had
been added to the source code of the reporting tool
to capture each click of the subject and
characteristics associated with it (e.g. report ID, user
ID, mode ID, current page loaded, button pressed,
parameters entered, recommendation chosen, etc.)
by inserting a new record into the log-table. To keep
track of the recommendation component usage, a
flag (0/1) indicates, whether a subject has executed
the report by hitting a recommendation link or not.
Kitchenham et al. (2002) advised not to ignore
outliers. Outlier tests with GraphPad QuickCalcs
1
for F
1
-measures acquired in each of the
recommendation modes showed that there are no
significant outliers in M
RS
and M
UA
, and detected 1
significant outlier in M
S
. In this case, a subject
ignored the recommendations and found the relevant
reports (which were also in the recommendation list)
by browsing the OLAP reporting tool.
Now, let’s formulate the null hypotheses derived
from the RQ1 and RQ2:
H
01
: There is no significant difference in the
performance of generating recommendations in
mode M and in the remaining modes, where M
{M
RS
, M
S
, M
UA
};
H
02
: There is no significant difference in the
performance of generating recommendations
between modes employing methods that gather
user preferences implicitly and the one that
gathers it explicitly.
As the results of Shapiro-Wilk
2
normality test
show, the F
1
-measure data in each of the
recommendation modes is not normally distibuted.
To test the above-mentioned null hypotheses, an
online Mann-Whitney test
3
was used, which is
suitable for non-normally distributed data.
1
GraphPad QuickCalcs:
http://graphpad.com/quickcalcs/Grubbs1.cfm
2
Shapiro-Wilk normality test:
http://sdittami.altervista.org/shapirotest/ShapiroTest.html
3
Mann-Whitney test:
http://elegans.som.vcu.edu/~leon/stats/utest.html
ICEIS2015-17thInternationalConferenceonEnterpriseInformationSystems
308
To test H
01
, 3 pairwise comparisons of F
1
-
measure values have to be made: F
1
-measure values
in (i) M
RS
and M
S
, (ii)
M
RS
and M
UA
, and (iii) M
S
and M
UA.
To test H
02
, the mean of F
1
-measure values
in modes that employ implicit user preferences (i.e.
M
UA
and
M
RS
) is compared to the values of F
1
-
measure values in a mode employing explicit user
preferences (M
S
). When the calculated two-tailed P-
value (statistical significance) is less than 0.05, then
the two sets of F
1
-measure values in question are
significantly different.
The conclusions drawn from the results of
Mann-Whitney test are as follows:
There is no significant difference in performance
of the recommendation component of the
reporting tool in report structure (M
RS
) and
semantic (M
S
) modes (P 0.806782);
The recommendation component in report
structure (M
RS
) or in semantic mode (M
S
)
outperforms that in user activity (M
UA
) mode
(respectively, P 0.000566 and P 0.002316);
There a marginally significant difference in the
performance of generating recommendations
between modes gathering user preferences
implicitly and the one gathering it explicitly
(P 0.026018).
The results of the log-table analysis show that
report structure and semantic modes (with a little
difference in scores) produce the most relevant
report recommendations for users regardless of their
experience or belonging to a certain user group,
whereas the lower number of relevant
recommendations appears in user activity mode.
Recommendations in user activity mode are affected
by report execution, which does not always reflect
user interest, especially, in a short period of time (as
it was in terms of the experimentation).
4.6 Results of the User Survey Analysis
The survey sampling method is cluster-based
sampling as surveying individuals belong to three
different groups: administrative staff, academic
staff, and students. Those groups do not intersect, as
an individual can take part in the experimentation
and survey as a representative of only one group.
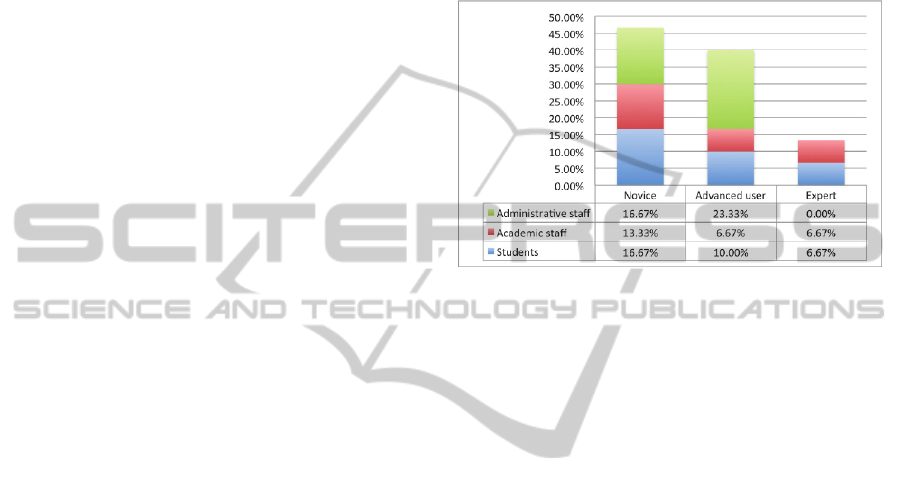
Figure 1 illustrates how users classified
themselves according to their experience with
reporting tools. All survey results include 16 graphs
in total.
A comment or a suggestion in the survey was
not mandatory, however, 25 out of 30 subjects
provided their feedback. All comments have been
given in a free form, and sorted and classified.
There are two groups of feedback: the one that gives
a subjective rating to report execution in
recommendation modes, and the other one that
includes ideas on what to improve in user
interface/functionality of the reporting tool and its
recommendation component or overall
impressions/concerns.
Figure 1: User survey question: “How would you evaluate
your experience with reporting tools in general?”.
The summary of results acquired from user survey
and user feedback form is as follows.
Even though semantic mode is the one where a
user has to do some extra work by stating his/her
preferences explicitly and the task in this mode was
mostly qualified as “Average” (while other tasks
seemed “Easy”), it was the most preferred mode in
subject feedback. Moreover, the ability to affect and
control recommendations is mostly considered as an
advantage. Also, survey results showed that
experimentation participants considered that the
most precise recommendations were produced in
semantic mode. As to the modes where
recommendations are generated on the basis of
implicitly stated user preferences, report structure
mode is a “runner-up”, while user activity mode
stays a little underrated. Subjects stated that report
structure mode would perform best for users who
lack experience in the reporting tool. As some
subjects notice, user activity mode would have more
value in the long run and would suit best for users
who have to execute a set of reports on a regular
basis.
User survey results were also split into two
groups according to user experience with reporting
tools – i.e. novice (inexperienced users) vs.
advanced users and experts (experienced users). In
the estimation of most participants in both user
groups the most complex task was in semantic mode
(rated as “Average”), and qualified as “Mostly
AnEmpiricalStudyofRecommendationsinOLAPReportingTool
309
clear”. However, an overwhelming majority in both
user groups regardless of the experience stated that
the most precise recommendations were received in
semantic mode. Recommendations in all three
modes helped (i.e. “Yes”, ”Mostly yes”) subjects of
both groups to complete the tasks, although, the task
in user activity mode was the only one that had also
negative responses (i.e. “Mostly no” – in both user
groups, ”No” – in experienced user group). This
may be explained by the fact that experienced users
work with the reporting tool with more confidence,
explore and execute the larger number of reports
including the irrelevant ones. This way, their
activity history is richer and contains reports that
should not have been executed in all of the previous
tasks, thus, leading to erroneous recommendations.
One may conclude that user activity mode shows
comparatively worse results in terms of one session
irrespective of the experience of the user. Subjects
of experienced user group claimed that they used
recommendation component most of the time in
semantic mode, meanwhile, novice users preferred
both report structure and semantic mode.
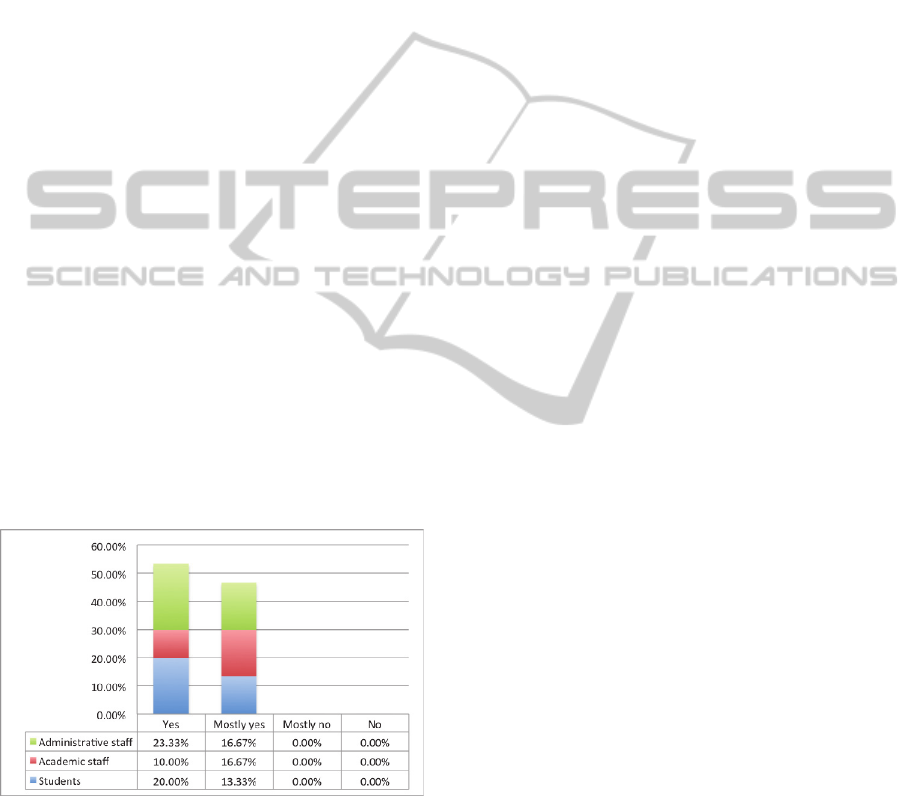
In general, the results of the experimental study
showed that all of the methods for generation of
report recommendations were positively evaluated
in terms of saving user effort. The participants were
asked to compare, whether it was easier to complete
the tasks with the help of report recommendations
than without them; 53.33% of all respondents
answered “Yes” and the remaining 46.67% replied
with “Mostly yes” (see Figure 2).
Figure 2: User survey question: “Is it easier to complete
the tasks employing any of the recommendation modes
(1st-3rd tasks) than to complete the task without any
recommendations (test task)?”.
5 CONCLUSIONS AND
LIMITATIONS
The main contribution of this paper is the study of
the metadata-based recommendations in OLAP
reporting tool in user activity, report structure, and
semantic mode. The empirical research on a set of
30 subjects with various skill level in reporting tools
(novice/advanced user/expert) was performed to
draw conclusions on user experience with each of
the recommendation modes.
Analysis of the results of the experimental study
was threefold and results were gathered from such
sources as: log-table, user survey, and user
comments given in a free form.
Log-table analysis showed that there is no
significant difference in performance of the
recommendation component in report structure and
semantic modes; however, in report structure or in
semantic mode the recommendation component
outperforms that in user activity mode.
User survey results showed that experimentation
participants considered that the most precise
recommendations were produced in semantic mode
(regardless of their skill level).
Summary of the user feedback helped to
conclude that semantic mode, which requires extra
effort in defining user preferences, is more suitable
for experienced users, whereas novice users prefer
either structure mode as an implicit way of stating
preferences or semantic mode as an explicit one;
subjects found it hard to evaluate the user activity
mode in one session time, although it could be the
most frequently used mode in everyday life to
complete monotonous tasks.
Considering the type of gathering user
preferences, log-table analysis showed that there is a
marginally significant difference in the performance
of generating recommendations between modes that
gather user preferences implicitly (i.e. report
structure and user activity modes) and the one that
gathers it explicitly (semantic mode) in favor of the
latter. In addition, user feedback revealed that even
though the preferences in semantic mode are stated
explicitly that requires an extra effort, this mode is
the most preferred one comparing to others.
There are certain limitations for application of
the methods for generation of report
recommendations. These methods exploit schema-
specific OLAP preferences only. It was decided to
concentrate on schema-specific OLAP preferences,
due to the lack of research results by other authors
on the methods for generating recommendations on
ICEIS2015-17thInternationalConferenceonEnterpriseInformationSystems
310

the basis of OLAP schema elements.
Recommendations in the reporting tool are
generated individually for each user taking as an
input his/her preferences only. It is done this way,
because users of the reporting tool might have
different rights on reports. Thus, recommendations
generated for a group of users with similar
preferences, might be of little help to a certain user.
Collaborative filtering is out scope of this paper.
6 FUTURE WORK
The OLAP reporting tool needs to be further
developed in terms of the technical implementation,
namely, in the aspect of usability, as concluded from
user feedback. Besides, it would be beneficial to
involve some users into exploiting the reporting tool
with the recommendation component for a long
period of time on a regular basis. The feedback that
such a user would give could be compared with the
results acquired in the existing experimental study.
Certain improvements in all three methods for
generation of report recommendations may be
considered such as, for example, collecting user
feedback on received report recommendations (i.e. a
“yes/no” answer to the question “was the
recommendation helpful?”). This feedback might be
integrated into the calculation of similarity values in
each of three proposed methods, thereby, allowing
users to interactively state their opinion on the
received recommendations and improve its quality.
Other direction is the development of the
technical application of the recommendation
component. There may be considered an idea of
making the recommendation component a
parameterized module that would be compatible not
only with this particular OLAP reporting tool, but
also with others, physical, logical, and semantic
metadata of which support CWM standard (Poole et
al., 2003).
REFERENCES
Aligon J., Golfarelli M., Marcel P., Rizzi S., Turricchia E.
2014. Similarity Measures for OLAP Sessions.
Knowledge and Information Systems, 39(2): 463-489.
Aligon J., Gallinucci E., Golfarelli M., Marcel P., Rizzi S.
2015. A Collaborative Filtering Approach for
Recommending OLAP Sessions. Decision Support
Systems, 69(2015):20-30.
Basili V. 1992. Software Modeling and Measurement: The
Goal/Question/Metric Paradigm. CS-TR(2956),
University of Maryland, 24p.
Business Dictionary: Definition of the Personalization
(online) http://www.businessdictionary.com/
definition/personalization.html.
Chaibi N., Gouider M.S. 2013. Personalization and
Recommendation of Queries in Multidimensional
Data Base. International Journal of Engineering
Science Invention (IJESI), 2(5):74-80.
Giacometti A., Marcel P., Negre E., Soulet A. 2009.
Query Recommendations for OLAP Discovery Driven
Analysis. In: Proc. of 12th ACM Int. Workshop on
Data Warehousing and OLAP (DOLAP'09), Hong
Kong, pp 81-88.
Giacometti A., Marcel P. Negre E. Soulet A. 2011. Query
Recommendations for OLAP Discovery-driven
Analysis. Data Warehouse Mining, 7(2):1-25.
Golfarelli M., Rizzi S. 2009. Expressing OLAP
Preferences. In: Winslett M. (ed.) SSDBM 2009.
LNCS, Springer, 5566:83-91.
Jerbi H., Ravat F., Teste O., Zurfluh G. 2009. Preference-
Based Recommendations for OLAP Analysis. In:
Proc. of 11th Int. Conf. on Data Warehousing and
Knowledge Discovery (DaWaK'09), Linz, Austria, pp
467-478.
Khemiri R., Bentayeb F. 2012. Interactive Query
Recommendation Assistant. In: Proc. of 23rd Int.
Workshop on Database and Expert Systems
Applications (DEXA'12), IEEE, Vienna, Austria, pp
93-97.
Kitchenham B.A., Pfleeger S.L., Pickard L.M., Jones
P.W., Hoaglin D.C., El Emam K., Rosenberg J. 2002.
Preliminary Guidelines for Empirical Research in
Software Engineering. IEEE Transactions on Software
Engineering, 28(8): 721-734.
Marcel P. 2014. Log-driven User-centric OLAP. In: Proc.
of 37th Int. Convention on Information and
Communication Technology, Electronics and
Microelectronics (MIPRO'2014), Opatija, Croatia,
IEEE, pp 1446-1451.
Park Y.-J., Tuzhilin A. 2008. The Long Tail of
Recommender Systems and How to Leverage It. In:
Proc. of the ACM Conf. on Rec. Systems (RecSys'08),
Lausanne, Switzerland, pp 11-18.
Poole J., Chang D., Tolbert D., Mellor D. 2003. Common
Warehouse Metamodel Developers Guide. Wiley
Publishing, 704p.
Kozmina, N. 2013. Adding Recommendations to OLAP
Reporting Tool. In: Proc. of the 15th Int. Conf. on
Enterprise Information Systems (ICEIS'13), Angers,
France, vol. 1, pp 238-245.
Kozmina N., Solodovnikova D. 2011. On Implicitly
Discovered OLAP Schema-specific Preferences in
Reporting Tool. Applied Computer Systems, 46:35-
42.
Kozmina N., Solodovnikova D. 2012. Towards
Introducing User Preferences in OLAP Reporting
Tool. In: Niedrite L, et al. (eds.) BIR 2011
Workshops. LNBIP, Springer, 106:209-222.
AnEmpiricalStudyofRecommendationsinOLAPReportingTool
311

Roscoe J. T. 1975. Fundamental Research Statistics for
the Behavioral Sciences, 2nd ed. New York: Holt
Rinehart & Winston, 483p.
Schroder G., Thiele M., Lehner W. 2011. Setting Goals
and Choosing Metrics for Recommender System
Evaluation. In: Proc. of UCERSTI-2 at the 5th ACM
Conf. on Rec. Systems, Chicago, USA, pp 78-85.
Solodovnikova D. 2010. Data Warehouse Schema
Evolution-oriented Reports Definition and Execution
Tool. Summary of PhD Thesis [online]
http://blogi.lu.lv/solodovnikova/files/2011/04/kopsavil
kums_eng.pdf
.
ICEIS2015-17thInternationalConferenceonEnterpriseInformationSystems
312
