
Bottom-up Analysis of the Solar Photovoltaic Potential
for a City in the Netherlands
A Working Model for Calculating the Potential
using High Resolution LiDAR Data
B. B. Kausika
1
, O. Dolla
1
, W. Folkerts
2
, B. Siebenga
3
, P. Hermans
4
and W. G. J. H. M. van Sark
1
1
Copernicus Institute of Sustainable Development, Utrecht University,
Heidelberglaan 2, 3584 CS Utrecht, The Netherlands
2
Solar Energy Application Centre (SEAC), High Tech Campus 21, Eindhoven, The Netherlands
3
I-Real, Stationsweg 30, Terborg, The Netherlands
4
Aurum Europe, Zandsteen 6, Hoofddorp, The Netherlands
Keywords: Solar Photovoltaic Potential, LiDAR Data, Bottom-up Approach.
Abstract: This paper presents a working model to estimate the solar photovoltaic potential using high- resolution
LiDAR data and Geographic Information Systems. This bottom-up approach method has been selected to
arrive at the potential as this gives a better estimate than a top-down approach. The novelty of the study lies
in estimating the potential at high resolution and classifying the rooftop as suitable or not for solar
photovoltaic installations based on factors like irradiation, slope and orientation. The city of Apeldoorn in
the Netherlands has been selected as the study area. The model was able to successfully locate suitable sites
for photovoltaic installations at rooftop level. In addition, the area feasible for the installations and the
potential power output has also been calculated. We conclude that the city has a potential of 319 MWp
capacity, which would yield 283.9 GWh/yr in relation to the 304 GWh/yr consumption from residential
buildings in the area.
1 INTRODUCTION
Photovoltaic (PV) solar energy in Europe has been
increasing rapidly in the past few years.
Technological developments and research efforts
have brought PV in the renewable energy sector to a
new level. Estimation of the actual potential of PV
in the residential sector creates various business
opportunities and would assist in policy making. In
addition, consumers are also increasingly aware of
how PV could benefit them, as in many countries
retail grid parity is present (Olson et al. 2014).
Several top-down studies have been performed on
solar PV potential in the Netherlands, sometimes in
conjunction with potential studies for Europe
(Alsema and Brummelen 1992; Bergsma 1997; De
Noord et al. 2004; Krekel et al. 1987). Many studies
also mention different capacities based on different
top-down approaches. (Krekel et al. 1987), (Alsema
and Brummelen 1992), (Corten and (Bergsma 1997).
De Noord et al. re-assessed these potential estimates
and presented the realistic potential of solar PV in
the Netherlands to be 400 km
2
(80-120 GWp) for
building integrated PV (BIPV) and 200 km
2
(40- 60
GWp) for ground-based PV (GBPV). The latest
figure for PV potential is presented by Lemmens et
al., at 150 GWp and is based on the present
electricity consumption in the Netherlands of 120
TWh (Lemmens et al. 2014).
To summarize present top-down estimates for
BIPV potential, in the Netherlands it ranges from
200- 400 km
2
, or 40-80 GWp. Land based PV
installations would perhaps add another 200 km
2
.
Total country potential thus ranges from
80-120 GWp. At the end of 2013, the total amount
of installed PV was estimated at 722 MWp (CBS
2014). It is predicted that in the year 2020 an amount
of 4 GWp will be installed in the Netherlands
(KEMA 2012). With present annual growth rates,
this may be a conservative estimate.
Since the top-down assessment values are
difficult to rely upon these should be validated using
129
B. Kausika B., Dolla O., Folkerts W., Siebenga B., Hermans P. and G. J. H. M. van Sark W..
Bottom-up Analysis of the Solar Photovoltaic Potential for a City in the Netherlands - A Working Model for Calculating the Potential using High Resolution
LiDAR Data.
DOI: 10.5220/0005431401290135
In Proceedings of the 4th International Conference on Smart Cities and Green ICT Systems (SMARTGREENS-2015), pages 129-135
ISBN: 978-989-758-105-2
Copyright
c
2015 SCITEPRESS (Science and Technology Publications, Lda.)

bottom-up assessments that now are possible, using
tools such as “Solar Atlas”, in Dutch Zonatlas
(Zonatlas), which are based on aerial photographs
and solar irradiation. But determining the actual
solar potential of BIPV using high-resolution data
can be very challenging due to the complexity of the
urban areas.
High resolution rooftop potential studies are
relatively new and not much has been done in this
area at rooftop level for estimating the technical and
geographical potential for PV deployment.
(Izquierdo et al. 2008) estimated the technical
potential of roof integrated PV systems using easily
available data and stratified-samples of
Geographical Information Systems (GIS) maps at a
regional level. Based on this work, PV solar energy
potential estimations at municipal to regional level
was conducted in Italy with the help of global solar
radiation maps taken from the Joint Research Centre
of the European Commission (Bergamasco and
Asinari 2011). (Hofierka and Kaňuk 2009) proposed
a methodology for PV potential estimation in urban
areas based on the open-source solar radiation tool
r.sun (developed by (Šúri and Hofierka 2004)) and
3-D city model in GIS. Furthermore, models to
estimate solar potential on building rooftops using
GIS and statistical approaches to create roof-top
solar radiation maps were explored by (Karteris et
al. 2013; Kodysh et al. 2013). (Redweik et al.
2013)developed a model to calculate the solar
energy potential of the buildings taking into account
both the roofs and the facades using high resolution
LiDAR (Laser Imaging Detection And Ranging)
data and applied the model to the campus of
university of Lisbon. However, all the mentioned
studies fall short in estimating the potential at
individual rooftop level.
In the present study, we estimate the rooftop PV
potential in Apeldoorn, a city in the Netherlands
using high resolution LiDAR data and GIS
techniques. Only roof integrated PV is addressed
here. With the use of Solar Analyst (Fu and Paul M
Rich 1999) of ArcGIS solar irradiation over large
geographic areas is computed accounting for
atmospheric effects, sun angle, elevation and effects
of shadows by buildings, elevation and orientation.
Classification of the solar irradiation map was done
to differentiate between optimum and less optimum
suitable sites. These were the basis of potential
estimation, where further energy potential
calculations are made taking into account the slope
and orientation information. These estimations
would help in looking at the trend of PV diffusion,
create business opportunities and additionally
provide an insight for policy implementations.
2 METHODOLOGY
The area chosen for the study was the city of
Apeldoorn (52° 13′ N, 5° 57′ E), in the Gelderland
province of the Netherlands. For locating the
potential PV sites and for calculating the PV
potential a digital elevation model (DEM) derived
from LiDAR data was used. This was obtained from
Actueel Hoogtebestand Nederlands (AHN)
(Nederland 2013). This key input has a resolution of
50 cm (point spacing of 9 points per m
2
, which is
well suited for estimation of solar radiation at
roof-tops. The study area chosen in shown in Figure
1. The city itself is at low elevation, while in the
West one recognizes a hilly region called De
Veluwe. Another important dataset was a vector file
of the footprints of residential buildings in the study
area. In this paper we focus on the residential sector.
The recent building footprint layer was obtained
from Basisregistratie Adressen en Gebouwen
(BAG), which is a part of the government cadaster
system.
Figure 1: City of Apeldoorn which is taken as the study
area in this research.
The estimation of solar potential in this study
was calculated in two steps. First, suitable locations
for roof-top PV were singled out, and then potential
estimation calculations were performed based on
GIS data analysis. We specified some requirements
in order to characterize suitable locations; and
performed all the calculations using ArcGIS.
The criteria chosen for locating suitable PV sites
were solar irradiation, slope and orientation. This
has been adopted from the work of (Chaves and
Bahill 2010). The Area Solar Radiation Tool of the
ArcGIS Spatial Analyst automatically performs the
solar irradiation calculation based on the model by
SMARTGREENS2015-4thInternationalConferenceonSmartCitiesandGreenICTSystems
130
(Fu and Paul M. Rich 1999). This model takes DEM
as the main input and other parameters relating to
slope, shade and transmissivity of the atmosphere
and calculates the solar irradiance during the time
specified and produces an output image having pixel
values in units of Wh/m
2
.
The other inputs for the model were slope and
orientation, which were also created by the Spatial
Analyst tool in ArcGIS.
All the three images were masked to show only
residential buildings and were converted into binary
raster images taking the following criteria:
• Feasible Slope: less than or equal to 38
degrees
• Feasible Solar Irradiation: greater than 70%
of the annual maximum received in the area
which has been taken at 600kWh/m
2
according to the modelled irradiance
• Feasible Orientation: (a) South facing and
(b) other orientations.
South facing slopes have been considered as
optimum while the other slopes have been taken as
less optimum in this study. The binary rasters were
then combined together to create a final binary
image, which was then filtered to create a smooth
and continuous image.
A raster to polygon tool was used to convert the
suitable areas into a vector polygon layer. Attributes
like area, potential capacity and power were then
attached to these polygons. A value of 150Wp/m
2
has been taken as the PV power density that can be
installed. Therefore, the final output has been
classified as follows
• 0 : for unsuitable areas shown in red
• 1: partially suitable areas (with high solar
irradiance and orientations other than
south) shown in yellow and
• 2: optimally suited areas( high irradiation
and south facing slopes) in green.
In addition, the production from the estimated
capacity was determined using values determined by
(van Sark et al. 2014). This study states that the
annual production of a PV system in the Netherlands
can be estimated at 875 kWh/kWp. Therefore, for
optimum (south facing) oriented areas 950
kWh/kWp has been chosen and for other, less
optimal orientations 750 kWh/kWp has been taken.
3 RESULTS
The results are explained in the following
subsections. The first subsection shows the model
inputs and in the second subsection binary outputs
after the application of criteria are shown. The third
subsection shows the final output, which is the result
of a binary (AND) operation followed by a raster to
polygon transformation and addition of attributes
and finally the potential estimations.
3.1 Model Inputs
In this subsection the inputs taken in the model are
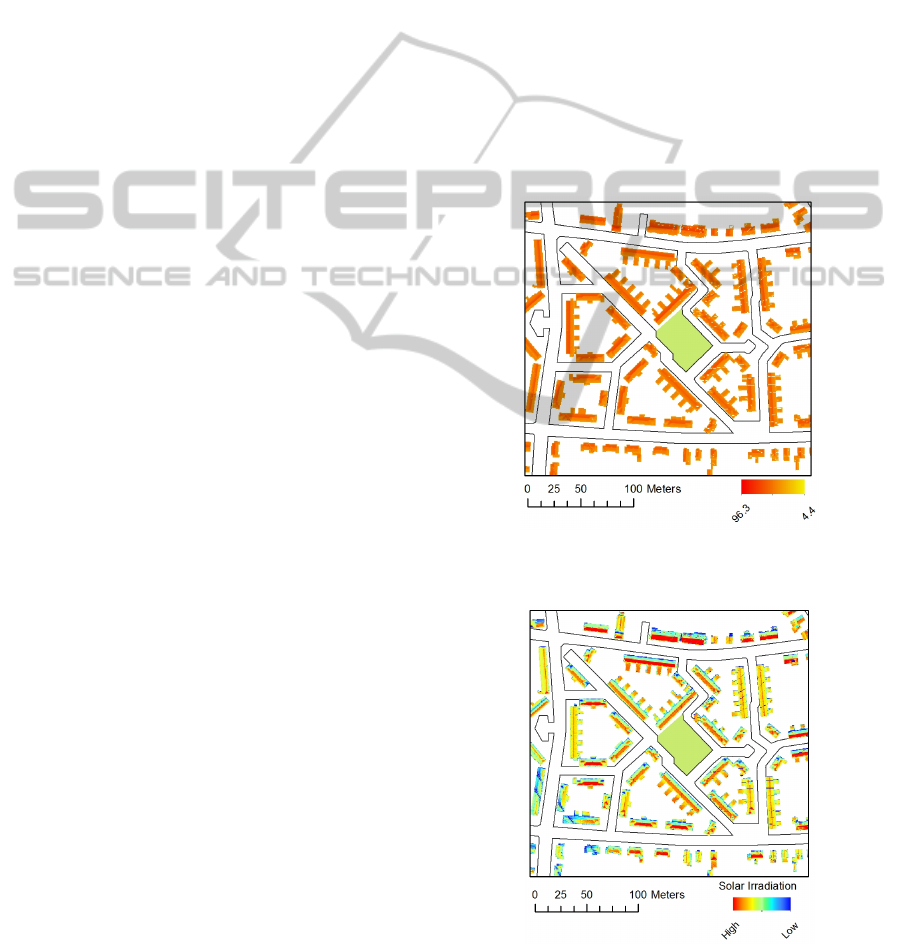
displayed. Figure 2 shows the height map of the
buildings. Figure 3 shows the annual solar radiation
image in kWh/m
2
. The area receives an annual
maximum irradiation of 960 kWh/m
2
in a year
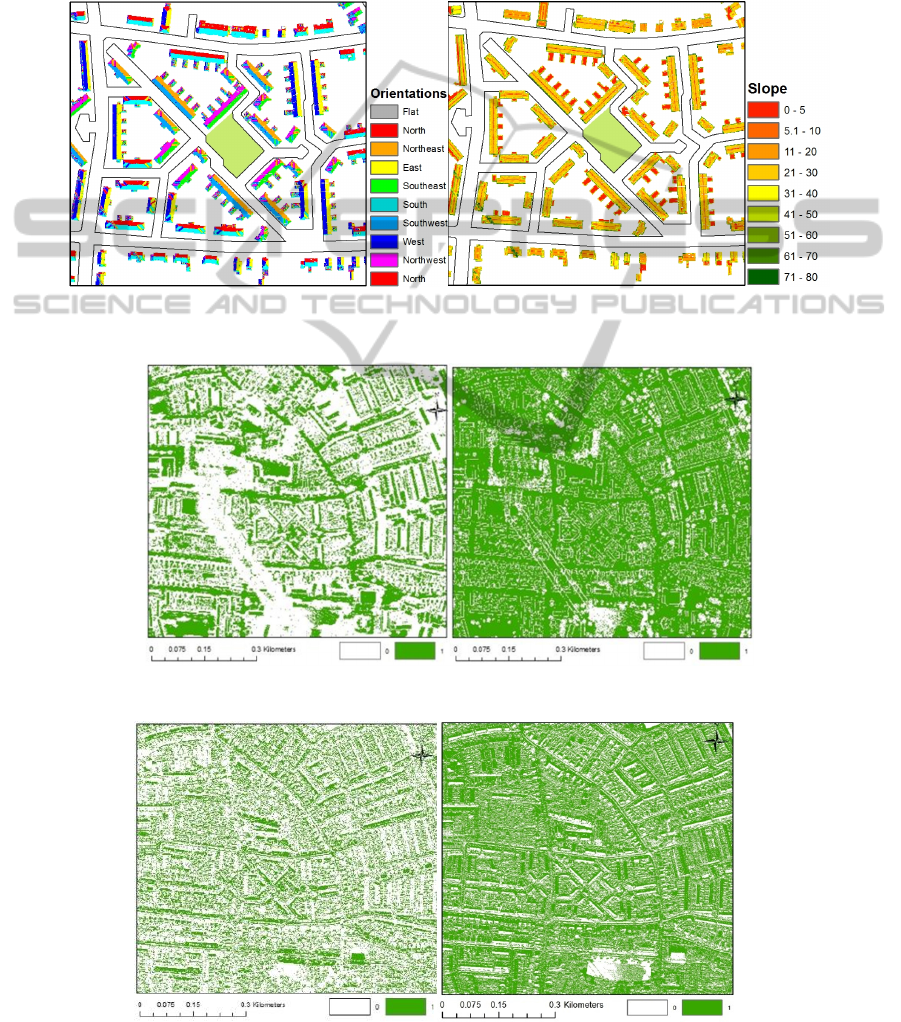
according to the model-based calculations. Figure 4
shows the orientation image or the direction of the
slope. Followed by a slope image where a distinction
between flat and sloping roofs is vivid.
Figure 2: AHN height information derived for residential
buildings. Height information is in meters.
Figure 3: Solar Irradiation image derived for building by
running the Solar Radiation tool. South facing slopes are
seen to receive greater irradiation.
Bottom-upAnalysisoftheSolarPhotovoltaicPotentialforaCityintheNetherlands-AWorkingModelforCalculatingthe
PotentialusingHighResolutionLiDARData
131
3.2 Binary Outputs
Binary outputs after applying the mentioned criteria
for slope, solar irradiation and orientation have been
determined and are presented here.
Figure 5 shows in green the optimum irradiation
map of areas receiving greater than 600 kWh/m
2
per
year. We see that most of the building rooftops are
selected along with a few roads or empty areas. The
right image in Figure 5 shows the feasible slope
areas in green, which are 38° and below. The white
areas show unfeasible areas, which we can identify
mostly as facades or vegetation.
Images in Figure 6 are the optimum orientation
map, which shows south facing slopes in green (left
image) and other orientations image (right image).
Figure 4: Left: Orientation image showing the direction of slope of the rooftops. Right: Slope image classified in classes to
distinguish between flat and sloping roofs.
Figure 5: Optimum irradiation image (left) and feasible slope image (right).
Figure 6: Optimum orientation image (left) showing south facing slopes and other orientations image (right).
SMARTGREENS2015-4thInternationalConferenceonSmartCitiesandGreenICTSystems
132
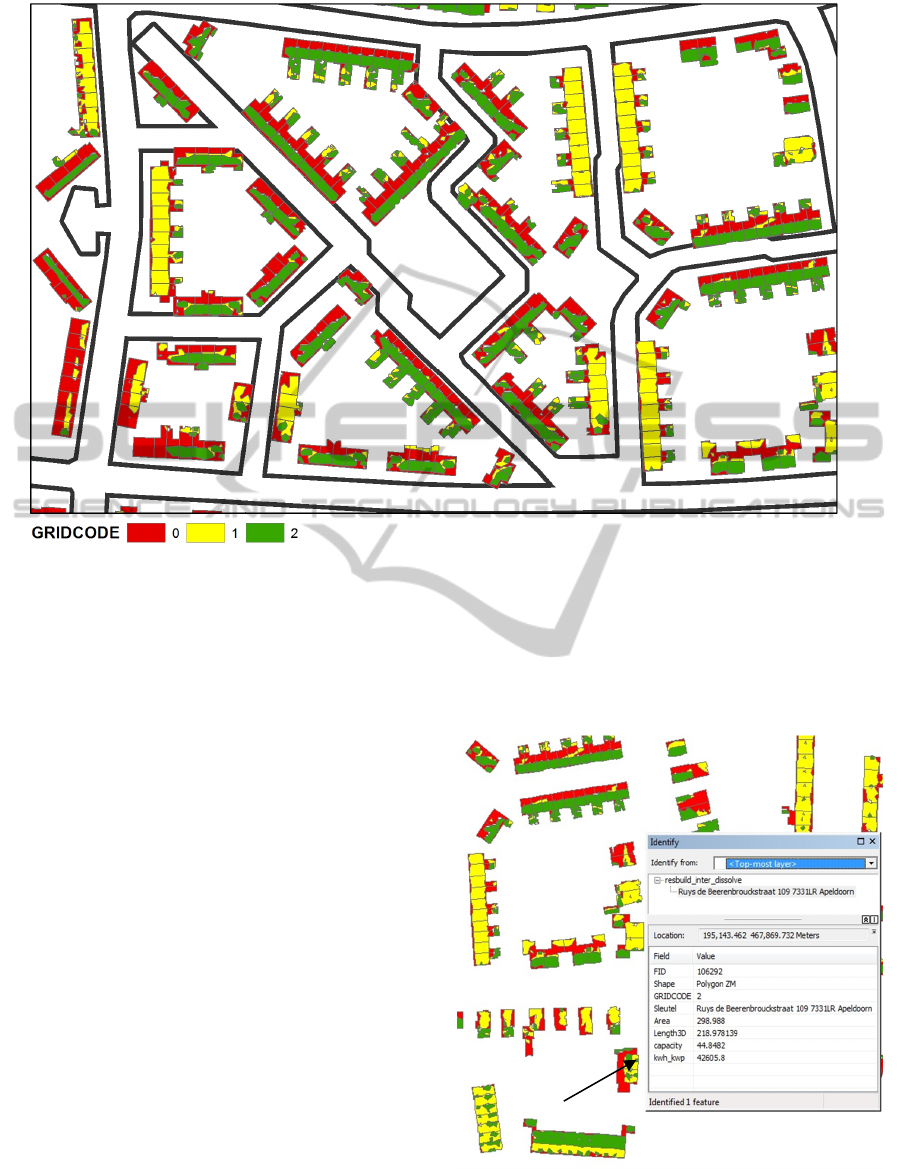
Figure 7: Final output showing the geographic potential. Gridcode 0 shows unfeasible areas, 1 represents partially suitable
area and 2 shows best suits areas for the deployment of PV.
3.3 Final Output
The final output is a polygon layer that shows 3
classes (Figure 7). Areas in green are optimally
best-suited locations for PV. These areas receive
maximum amount of solar irradiation and have an
optimum slope and south orientation. South facing
slopes in the Northern hemisphere receive maximum
amount of solar irradiation.
The areas in yellow are partially optimum or the
other orientations, which still receive about more
than 70% of the average solar irradiation in the
region. These areas are suitable for PV but may not
show high energy yields, as they do not receive
maximum solar irradiation throughout the year.
The red areas are categorised as totally
unsuitable. These regions receive either minimum
amount of solar radiation or have unfeasible slopes
(facades or steep slopes) or are either shaded from
trees or nearby buildings.
The final output presented below is the result of
a smoothing filter on a raster, which was then
converted into a polygon shapefile. These polygons
were then intersected with the building information
from BAG so that the final output has address
information along with the building properties as
shown in Figure 8.
Figure 9 shows the attribute table associated with
the final map. Each record corresponds to an address
and each address is further categorised based on the
grid code, which is 0, 1 or 2.
Figure 8: Final map with information on address, potential
capacity and power.
Bottom-upAnalysisoftheSolarPhotovoltaicPotentialforaCityintheNetherlands-AWorkingModelforCalculatingthe
PotentialusingHighResolutionLiDARData
133
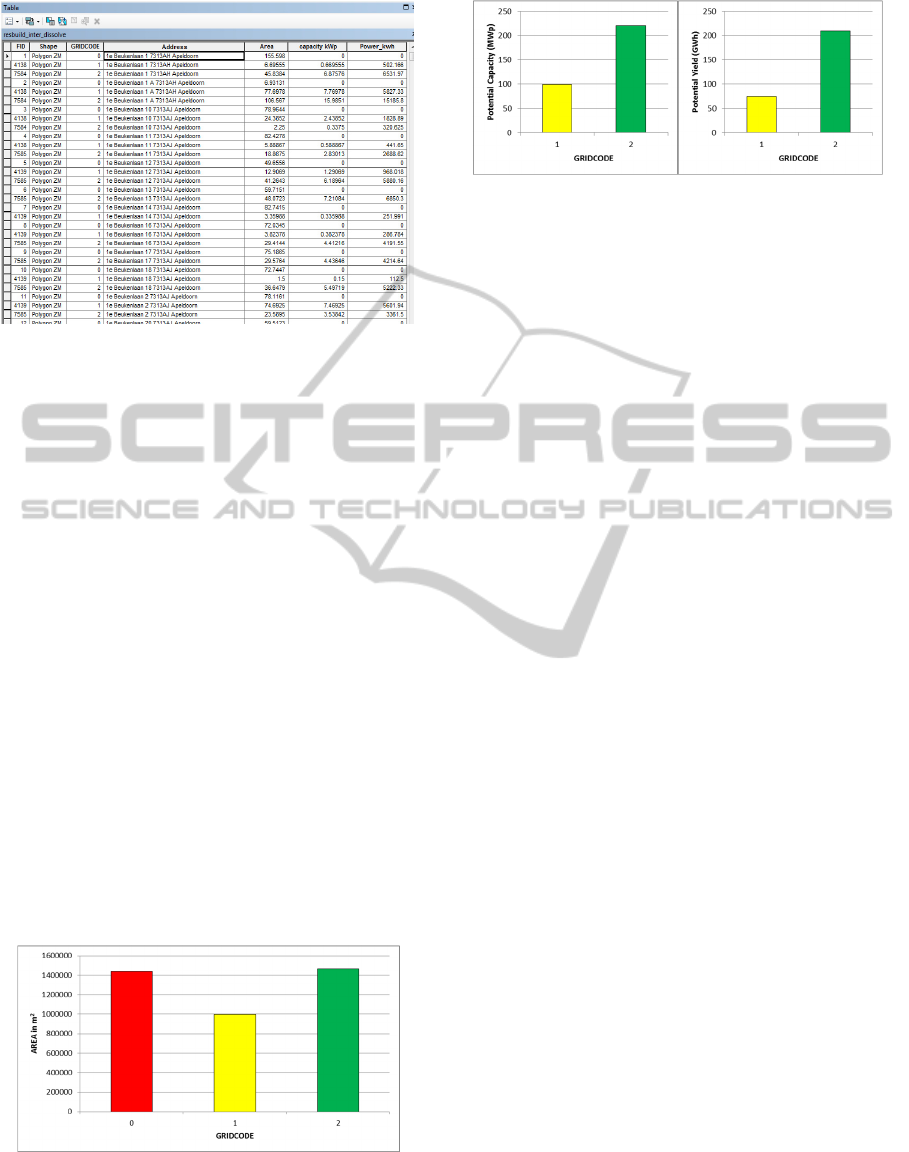
Figure 9: Attribute table for the final output.
3.4 Potential Estimation
Potential estimations for the city of Apeldoorn have
been calculated using the field calculator of ArcGIS
for each of the final polygons as can been seen from
the table in Figure 9. Figure 10 shows the rooftop
area in relation to grid code. Total area is about 3.9
km
2
. A constant power density of 150 Wp has been
used to estimate the potential capacity per square
meter. This value has been multiplied with the total
area available. Potential estimation has not been
performed for grid code values of 0.
The potential PV capacity for the city of
Apeldoorn thus was estimated at 319.9 MWp for the
residential buildings (Figure 11). This would mean a
power production of 283.94 GWh. Note that the
present PV capacity installed in the region is 3.4
MWp and the annual demand is around 230 GWh at
the rate of 3500 kWh/yr per household.
Using an annual average household
consumption, PV would be able to provide the
annual energy demand of 65,730 households, which
is more than 100% of the total households in
Apeldoorn.
Figure 10: Graph showing rooftop area covered under
each class after analysis. The total of these classes
corresponds to the total roof area of residential buildings
in Apeldoorn.
Figure 11: Potential capacity in MWp and expected yield
in GWh of the optimally suitable areas (Grid code 2) and
partially suited areas (Grid code 1).
4 CONCLUSIONS
In this paper a working model for the estimation of
solar PV potential using high-resolution LiDAR data
and GIS techniques has been presented. Detailed PV
potential estimation studies require high-resolution
height information models. The model presented in
this paper shows great potential and is easy to
implement. The calculations showed that the city of
Apeldoorn has great PV potential in its residential
sector. Based on an average electricity consumption
of residential houses in Apeldoorn of 3500 kWh/yr,
the potential electricity that could be generated
would be able to cover the electricity demand of the
city completely and even produce more.
The application of this methodology to a city has
shown that this method could be deployed in the
whole country for accurate bottom-up determination
of PV potential. This method could also be applied
to the whole of the Netherlands but proper
extrapolation techniques have to be developed. This
is currently under investigation.
REFERENCES
Bergamasco, L. and Asinari, P., 2011. Scalable
methodology for the photovoltaic solar energy
potential assessment based on available roof surface
area: Application to Piedmont Region (Italy). Solar
Energy, 85(5), pp.1041–1055. Available at:
http://dx.doi.org/10.1016/j.solener.2011.02.022.
CBS, 2014. CBS StatLine - Energy consumption private
dwellings; type of dwelling and regions. Available at:
http://statline.cbs.nl/Statweb/publication.
Chaves, A. and Bahill, T.A., 2010. Locating Sites for
Photovoltaic Solar. Available at: http://www.esri.com/
news/arcuser/1010/solarsiting.html.
Fu, P. and Rich, P.M., 1999. Design and implementation
of the Solar Analyst: an ArcView extension for
modeling solar radiation at landscape scales. In
Proceedings of the 19th annual ESRI user conference,
SMARTGREENS2015-4thInternationalConferenceonSmartCitiesandGreenICTSystems
134

San Diego, USA. Available at: http://professorpaul.
com/publications/fu_rich_1999_esri.pdf.
Fu, P. and Rich, P.M., 1999. Design and Implementation
of the Solar Analyst: an ArcView Extension for
Modeling Solar Radiation at Landscape Scales. 19th
Annual ESRI User Conference, pp.1–24.
Hofierka, J. and Kaňuk, J., 2009. Assessment of
photovoltaic potential in urban areas using open-
source solar radiation tools. Renewable Energy,
34(10), pp.2206–2214. Available at:
http://www.sciencedirect.com/science/article/pii/S096
0148109000949.
Izquierdo, S., Rodrigues, M. and Fueyo, N., 2008. A
method for estimating the geographical distribution of
the available roof surface area for large-scale
photovoltaic energy-potential evaluations. Solar
Energy, 82, pp.929–939.
Karteris, M., Slini, T. and Papadopoulos, a. M., 2013.
Urban solar energy potential in Greece: A statistical
calculation model of suitable built roof areas for
photovoltaics. Energy and Buildings, 62, pp.459–468.
Available at: http://dx.doi.org/10.1016/j.enbuild
.2013.03.033.
KEMA, 2012. Nationaal Actieplan Zonnestroom,
Kodysh, J.B. et al., 2013. Methodology for estimating
solar potential on multiple building rooftops for
photovoltaic systems. Sustainable Cities and Society,
8, pp.31–41. Available at: http://dx.doi.org/10.1016/
j.scs.2013.01.002.
Nederland, A.H., 2013. AHN - Actueel Hoogtebestand
Nederland - homepage.
Available at: http://www.ahn.nl/index.html.
Olson, C.L. et al., 2014. Is grid parity an indicator for PV
market expansion in the Netherlands? Solar Energy,
2013, p.2012. Available at: ftp://130.112.2.101/
pub/www/library/report/2013/m13041.pdf.
Redweik, P., Catita, C. and Brito, M., 2013. Solar energy
potential on roofs and facades in an urban landscape.
Solar Energy, 97, pp.332–341. Available at:
http://dx.doi.org/10.1016/j.solener.2013.08.036.
Van Sark, W. et al., 2014. Opbrengst van
zonnestroomsystemen in Nederland, Available at:
http://pers.uu.nl/nederlandse-zonnepanelen-opbrengst-
kengetal/.
Šúri, M. and Hofierka, J., 2004. A New GIS-based Solar
Radiation Model and Its Application to Photovoltaic
Assessments. Transactions in GIS, 8(2), pp.175–190.
Available at: http://onlinelibrary.wiley.com/
doi/10.1111/j.1467-9671.2004.00174.x/abstract.
Zonatlas, GA NAAR DE ZONATLAS | Zonatlas
Apeldoorn. Available at: http://www.zonatlas.nl/
apeldoorn/ontdek-de-zonatlas/.
Bottom-upAnalysisoftheSolarPhotovoltaicPotentialforaCityintheNetherlands-AWorkingModelforCalculatingthe
PotentialusingHighResolutionLiDARData
135
