
A Cost–benefit Analysis of Continuous Assessment
∗
Amalia Duch, Joaquim Gabarr
´
o, Jordi Petit, Maria J. Blesa and Maria J. Serna
ALBCOM Research Group, Computer Science Department, Universitat Polit
`
ecnica de Catalunya - Barcelona Tech, 08034,
Barcelona, Spain.
Keywords:
Continuous Assessment, Cost-benefit Analysis, CS1.
Abstract:
The first course on programming is fundamental in the Facultat d’Inform
`
atica de Barcelona. After a major
redesign of the Programming-1 course in 2006 to give it a more practical flavor, an increasing number of
measures have been undertaken over the years to try to increase its pass rate while maintaining a fixed quality
level. These measures, that can be roughly summarized as an important increase in assessment, imply an
increase in the workload of both students and instructors that does not always correspond to the increase of
pass rate they provide. In this paper, and within the context of this course, we analyze quantitatively the
amount of work required from faculty to implement the series of measures and we conclude that, within this
course, continuous assessment is expensive and has reached its limit.
1 INTRODUCTION
The Programming-1 course at the Facultat
d’Inform
`
atica de Barcelona of the Universitat
Polit
`
ecnica de Catalunya involves about 450 first-
year students, about 15 faculty members and two
coordinators per semester. In September 2006, the
course’s coordinators redesigned the course adopting
a “learn-by-doing” approach (Arrow, 1962): from
the very beginning, students were expected to solve
a strategically and carefully organized collection
of programming problems. An integral part of
the course was an online programming judge that
automatically verifies in real time whether student
solutions are correct (Petit et al., 2012). Students are
organized into groups that weekly have 3 hours of
theory lectures as well as 3 hours of practical lessons
in a computing laboratory. An account of the first two
years of this experience is given in (Gim
´
enez et al.,
2009), where it is shown that, unfortunately, a high
number of students failed to pass the course. Indeed,
the data collected on the online judge showed that the
effort that most students dedicated to the course was
far from the required workload (7.5 ECTS
2
). In fact,
the data compiled by the system and the observations
∗
Authors are partially supported by projects TIN2013-
46181-C2-1-R (COMMAS), TIN2012-37930-C02-02 of
the Spanish Ministry of Science and Innovation and SGR
2014-1034 (ALBCOM) of the Generalitat de Catalunya.
2
European Credit Transfer and Accumulation System
(ECTS) is a standard for comparing the study attainment of
made by instructors also show that, in general, most
students did not even invest in the course the time
needed for the theory lectures and the laboratory
sessions.
As lecturers in a technical university we are deeply
engaged in the development of a learning society.
However there is a big gap between general theo-
ries (Arrow, 1962; Solow, 1997; Stiglitz and Green-
wald, 2014) and our everyday lecturing task. Con-
cerned and committed to the challenge of helping stu-
dents to achieve the practice and knowledge required
to attain a passing mark, the Programming-1 aca-
demic staff have been introducing, over time, a series
of measures with the intention of motivate students to
work harder, more autonomously and more continu-
ously while maintaining the general goals, level and
approach of the course. As a consequence, the course
has suffered several amendments, which, overall ac-
counts for an important increase of continuous assess-
ment of students at the expense of a parallel increase
of the workload of the faculty.
The time devoted to teaching is a limited resource
and it should be optimized with no detriment of its
quality. To do so, a fundamental issue is to estimate
the cost-benefit of the different faculty tasks. Such in-
formation would help to the assessment of the taken
measures in terms of productivity (or effectiveness).
This paper is a proposal on this direction and can pro-
higher education across the European Union. One ECTS
credit corresponds to 25 hours of student work.
57
Duch A., Gabarro J., Petit J., Blesa M. and Serna M..
A Cost–benefit Analysis of Continuous Assessment.
DOI: 10.5220/0005432300570066
In Proceedings of the 7th International Conference on Computer Supported Education (CSEDU-2015), pages 57-66
ISBN: 978-989-758-108-3
Copyright
c
2015 SCITEPRESS (Science and Technology Publications, Lda.)

vide a starting point for fruitful discussions.
Specifically, we perform a cost–benefit analysis
that determines the impact of those continuous assess-
ment’s measures by contrasting the pass rate of the
students with the workload of the instructors. To do
so, we describe the series of measures that have been
applied to the editions of the course from its inception
and we present some data about their implementation.
We propose a simple way to interpret them under eco-
nomic terms by means of productivity and marginal
gain notions (Varian, 2005).
At first, our methodology consists in recognizing
which changes have been applied to the course since
its kick-off. This results in a series of measures la-
beled with timestamps that serve as the time basis of
our study. The analysis of the temporal evolution of
evaluative activities for a course is a well established
subject (Mart
´
ın-Carrasco et al., 2014). Following a
long tradition in education analysis (Bowles, 1970;
Hanushek, 2008), we use the rate of students pass-
ing the course as our primary measure of production.
Specifically, we use the following magnitudes:
• N
t
denotes the total number of students at time t,
• P
t
denotes the number of students passing the
course at time t, therefore
• 100P
t
/N
t
corresponds to the pass rate at time t
and,
• W
t
denotes the total number of working hours
required from the faculty members to teach the
course at time t.
It is clear that our model and our data are limited
and do not take into account several pedagogical, psy-
chological and sociological aspects that affect the be-
havior of both students and faculty members. Nev-
ertheless, we think that it can provide insights in the
way this massive course has evolved as well as tools
for future directions.
According to the results reported in this paper, we
can provide criteria to assess the benefit of each of the
introduced measures. We can observe that the bene-
fit of incrementing the load of continuous assessment
reaches soon a limit, regarding the pass rate of the
students and the instructors’ workload.
The forthcoming sections are organized as fol-
lows. First, in Section 2, we give an overview of the
context and original design of the course, as well as a
description of the different evaluative activities pro-
posed over the latter years. Then, we describe the
impact of those measures on the pass rate of the stu-
dents in Section 3. The total workload induced by
this course is described and estimated in Section 4.
An analysis in economical terms is carried out in Sec-
tion 5. Finally, in Section 6, we present our conclud-
ing remarks.
2 THE COURSE: CONTEXT,
DESIGN AND EVOLUTION
Context. In the Spanish educational system, the ad-
mission to Universities (in terms of number of vacan-
cies, threshold qualification, etc.) is established by
a public government office which is independent of
universities. After concluding their secondary stud-
ies, students must do a multi-subject general test in
order to be able to apply for a university vacancy.
Those tests are valid countrywide. Thus, in general,
first-year students are not previously filtered by any
specific admission exam designed by Universities. In
order to compensate that lack of specific filtering, the
first year in most of the degrees somehow becomes
a selective procedure. That happens also at the Fac-
ultat d’Inform
`
atica de Barcelona where, at the end
of the first year, many of the approx. 450 incoming
students will drop out. The current selection criteria
at the Facultat d’Inform
`
atica de Barcelona is that all
four subjects composing the first year of the degree
must be successfully passed in at most four consecu-
tive semesters.
Table 1 shows, for the academic year 2006-
2007, the percentage of students passing the first four
semesters at their first try in our school. We are
not entering in the debate of what is an acceptable
pass rate. However, there is a general agreement that
the percentage for Programming-1 was too low and
should be improved.
With respect to Programming-1, by 2006 there
was also a big consensus on the fact that, indepen-
dently of their grades, most students did not mas-
ter the programming skills needed for subsequent
courses. Consequently, the Programming-1 course
was completely redesigned in September 2006. This
was done under the agreement that the level of re-
quired programming skills were correctly designed
and should not be changed in the coming years. In
the following subsection we give a short overview of
the new course (full details can be found in (Gim
´
enez
et al., 2009)).
Design. The main goal of the new Programming-1
course was to ensure that students would learn and
master basic practical programming skills. In order
to achieve this goal, the course was organized around
the notion of “programming problems”, that is, small
programming tasks, specified in terms of valid inputs
and desired outputs, for which students must write
CSEDU2015-7thInternationalConferenceonComputerSupportedEducation
58

Table 1: For each subject in the academic year 2006-2007:
#Stu is the total number of students; %Enr is the percent-
age of students who pass; and %Exa is the percentage of
students who pass among those who took the final exam.
Subject #Stu %Enr %Exa
Algebra 809 24% 32%
Computers-1 744 44% 57%
Physics 751 39% 48%
Programming-1 721 20% 32%
a small, correct and efficient C
++
program perform-
ing the required tasks. During the course, students
would solve as many programming problems as pos-
sible among a collection containing more than 300
problems. The collection was conveniently organized
by topic and difficulty. Some of these problems were
expected to be solved individually during the labora-
tory sessions with the help of an instructor; some oth-
ers were expected to be solved without the instructor’s
immediate support. Theory sessions were used, as
usual, to introduce the techniques and tools required
to solve the problems. In the exams, students were
asked to solve programming problems with a diffi-
culty similar to those in the collection. Those exams
took place in the laboratory room where students used
to work every week.
In order to apply this methodology, an online ed-
ucational programming judge was developed (Petit
et al., 2012). Online programming judges are web
systems that store a repository of problems with the
facility to check whether a candidate solution is cor-
rect. The judge executes the submitted program on
a set of public and private test cases, and matches
the obtained outputs with the expected ones. On-
line judges originated in programming contests such
as the UVa Online Judge (Revilla et al., 2008), and
have widely been dapted to educative settings (Ihan-
tola et al., 2010; Verd
´
u et al., 2012; Tonin et al., 2012).
In particular, the judge of Programming-1 has evolved
into www.jutge.org, an open access virtual learning
environment for computer programming (Petit et al.,
2012).
The judge was an inflection point for our program-
ming courses. Indeed, this kind of public good offers
advantages to the students since it is a tool to freely
work and study as it may be used 24/7. Also, it is an
invaluable help to instructors. Allowing to track eas-
ily the work and evolution of their students and for the
assessment of exams.
In particular, the judge was also used during the
exams, where it was compulsory to submit a correct
solution in order to be evaluated. After the exam,
only the correct solutions were additionally checked
by human instructors, mainly to grade their adequacy
www.jutge.org Green light Red light
Figure 1: Jutge.org with two of its verdict icons: The green
light icon for submissions that pass all the test cases of a
problem, and the red light icon marking submissions that
fail some test cases.
to general quality criteria. The aim of this strict rule
was to force students to put a lot of effort to practice
on their own. However, our students perceived it as
really unfair.
The results of introducing this methodology of
teaching and learning to program were not as success-
ful as expected at the very beginning. As a conse-
quence, several measures were taken with the inten-
tion of turn the situation around. In what follows, we
describe those measures and comment on how they
affected the evolution of the course.
Evolution. In order to try to improve its learnability,
and therefore its pass rate, a series of gradual modi-
fications were applied to the course as initially con-
ceived. As it will be seen in the next section, none
of these measures was able to boost the rate of suc-
cess on its own, a fact that resulted in their continued
application over the years.
Specifically, this is the list of the main measures
applied to the course organization since its kick-
off, dividing the total time span into eight periods
t
0
,. .. ,t
7
:
t
0
Kick-off (2006-2007): The first edition of this
course started with 3 hours of theory lectures
addressed to groups of 60 students and 3 hours
of practical (laboratory) sessions addressed to
groups of 20 students. There were two exams
(a mid-term exam and a final exam) consisting
of two practical problems each. The exams took
place at the same rooms where students were used
to work every week on their practical lessons. The
students were asked to solve the problems, to im-
plement their solutions and to submit their pro-
grams to the online judge. Each solution to a prob-
lems could be submitted more than once. Each
submission gets a verdict from the online judge in
a few seconds. Only those programs accepted by
the Judge (labeled with a green light, see Figure 1)
were then graded by the instructors. The rest (i.e.,
those labeled with a red light) were given the low-
est mark: a zero, in the Spanish system.
t
1
Introduction of quizzes (2007-2008): In order to
encourage students’ continuous work, four addi-
ACost-benefitAnalysisofContinuousAssessment
59

tional practical exams were distributed along the
semester. Those exams consisted of an exercise of
the same format and complexity as those solved
in the practical sessions, and thus simpler than the
problems included in the mid-term and final exam.
The goal of this action was two-fold: first, to help
students to get used to work under the same sce-
nario, of the final exam, and second, to encour-
age them to work hard and get good marks. They
could obtain up to a 10% of the final qualification
by working continuously and succeeding in those
exams.
t
2
Grading red lights (2008-2009): Several lectur-
ers and the majority of students considered that
the fact of grading only those solutions labeled
green by the online judge was unfair. Therefore,
the Facultat d’Inform
`
atica de Barcelona urged the
coordinators of the course to remove this rule, and
to manually grade all the solutions (including the
incorrect ones, the ones that did not succeed to get
a green light by the online judge).
t
3
Written final exam (2009-2010): There was also
the feeling among a few lecturers and some stu-
dents that the fact that exams were only practi-
cal and ran in front of the computer, was also a
cause of failure. In order to neutralize that opin-
ion and minimize the effects of that situation, the
hands-on practical final exam was replaced by a
final written (traditional) exam.
t
4
New degree (2010-2011): In September 2010 the
Facultat d’Inform
`
atica de Barcelona introduced a
new curriculum for the Degree of Computer Sci-
ence to comply with the new law of the European
Union regarding graduate studies. This new cur-
riculum is the one that the Programming-1 course
currently follows. The most relevant changes
were: (a) that the theory lectures were reduced
from 3 to 2 hours, and (b) that practical exercises
became mid-term exams with a greater weight on
the final mark.
t
5
Lists of problems to hand-in (2011-2012): To
enforce continuous work again, several lists of
mandatory practical exercises for each topic of the
course were introduced. Those lists were com-
posed by the standard exercises which were al-
ready included in the set of problems of practical
sessions. Therefore, the students had the possibil-
ity to solve them before the exam.
In order to be accepted to mid-term exams, stu-
dents must properly solve and submit (via the on-
line judge) around 70% of the exercises of those
lists. The mid-term exams’ problems were taken
from these lists.
t
6
Re-evaluation course (2012-2013): As another
effort to increase the rate of success, the Facultat
d’Inform
`
atica de Barcelona introduced the con-
cept of a remedial exam for students whose grade
was not good enough but not bad enough. Once
the usual course is finished, these students could
apply for remedial lectures that consisted in in-
tensive daily sessions of 2 hours each, during 6
consecutive days. Attendance to the lectures is
mandatory. The re-evaluation course gives the
students who are very close to pass the course, the
right to a further examination. As in the normal
course, that right is also conditioned to solving
70% of the problems of some proposed lists. If a
student does not pass the remedial exam, the orig-
inal qualification of the course is kept. Otherwise,
the minimal mark that allows to pass (a 5, in the
Spanish system) is awarded. No higher marks can
be obtained.
t
7
Quizzes not from the lists (2013-2014): In or-
der to lead the students towards a more creative
learning, the mid-term exams are now composed
by new problems instead of by problems coming
from the lists. Those problems are unknown to the
students by the time of the exam.
3 PASS RATE
Taking into account the history of the course detailed
in the previous section, we now turn our attention to
the evolution of the pass rate (or rate of success) as a
function of the measures taken over time.
Table 2 shows, by timestamp, the number of en-
rolled students and the number of students that pass
the course. Figure 2 shows the pass rate from the
timestamps t
0
to t
7
. Notice that t
0
is labeled as 2007
but the data corresponds to the course 2006-2007.
Similarly for other timestamps. One can see that the
proportion of students who pass the course in a first
attempt started at around 20% and is now close to
40%. More specifically, it is also shown that:
• The introduction of quizzes at t
1
had almost no
effect in the percentage of students who finished
the course successfully.
• Grading red lights at t
2
had almost no effect on
increasing the success of students (but, at least, it
removed the feeling of unfairness).
• The introduction of a written final exam at t
3
mod-
estly improved the percentage of success by a 3%.
• The adaptation to the new degree at t
4
had some
effect, since this last modification boost the per-
CSEDU2015-7thInternationalConferenceonComputerSupportedEducation
60

Table 2: Timestamp t, number of enrolled students (N
t
),
number of students who pass the course (P
t
) and its per-
centage (%).
Time N
t
P
t
%
t
0
-Kick-off 377 77 20%
t
1
-Introduction of quizzes 492 102 21%
t
2
-Grading red lights 497 105 21%
t
3
-Written final exam 417 98 23%
t
4
-New degree 493 145 29%
t
5
-Lists of problems to hand-in 492 205 42%
t
6
-Re-evaluation 465 232 49%
t
7
-Quizzes not from the lists 436 166 38%
centage of success to 30%, although still not good
enough.
• Using lists of problems to hand-in for the quizzes
at t
5
turned the percentage of success up to 41%.
In spite of that positive result, the instructors were
not pleased with this action since they got the im-
pression that it reinforced memorizing programs
rather than learning to program. The students con-
centrated too much on the problems of the lists
and did not work progressively on problems of in-
creasing difficulty. Without that background, they
got often blocked and frustrated when tackling
more difficult problems.
• The remedial exam introduced at t
6
increased the
rate of success from 41% to 50%. This amend-
ment seems to suggest that there is an impor-
tant percentage of students in the boundary of
the passing mark who, with a bit more practice
and personalized attention, succeed to pass the
Programming-1 course. The mandatory atten-
dance to lectures seems to have some influence
on that success.
• Using problems that were not in the lists for ex-
ams at t
7
decreased the rate of success from 50%
to 38%. This important decrement of the rate of
success reinforces the risks mentioned for the ini-
tiatives taken at t
5
. The impression of the faculty
members is that this decrement is temporal and
should improve in the forthcoming semesters.
4 WORKLOAD
Our goal in this section is to estimate the workload of
the course, W
t
, t ∈ {t
0
,. .. ,t
7
}, in each of its stages,
measured as the total number of working hours in-
vested by faculty members.
Computing W
t
is difficult because every new edi-
tion of the course involves slightly different tasks to
Figure 2: Percentage of students who pass the course by
year (timestamp). A graphical representation of the last col-
umn of Table 2 .
be performed by faculty members with different pro-
files, dedications and efficiencies. Moreover, the fac-
ulty members involved in the course also changes
from semester to semester. Additionally, the percep-
tion of each faculty member about the time invested
in each task is also different.
We have approximated W
t
by decomposing it into
several tasks and conducting a survey among the cur-
rent instructors of the course to get their cost (in
hours) estimates, for each of the tasks. Therefore,
W
t
is conformed by the number of working hours re-
quired to:
• T
t
: lecture theory.
• L
t
: supervise practical lectures.
• E
t
: design, test and prepare exams.
• G
t
: mark exams.
• V
t
: supervise exams.
• C
t
: coordinate the course.
• S
t
: maintain software.
To a greater or lesser extent, all these quantities
(except S
t
) are dependent on the number of students.
We have not included here the working hours required
for the initial design of the course and of the design
and implementation of the online judge.
The value used here for estimating each of these
measures is the average over 14 answers received in
survey carried out at the end of the last semester (fall
semester of the course 2014-2015). Since we did not
have similar information from previous editions of the
course (and it would have been almost impossible to
obtain it), we extrapolated the results to past editions
taking into account the way in which each applied
amendment impacted the workload of each task. The
technicalities for the calculation of the values of each
task are given in Appendix A, and these values are
shown in Table 3.
ACost-benefitAnalysisofContinuousAssessment
61
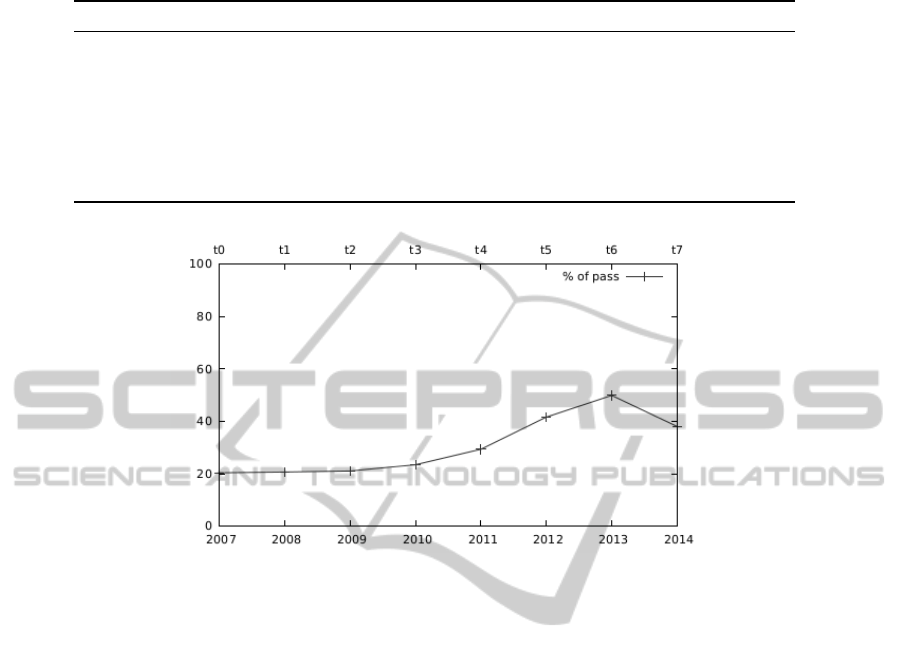
Table 3: Timestamp t, workload (in hours) of the tasks of the course.
Time T
t
L
t
E
t
G
t
V
t
C
t
S
t
W
t
W
t
/N
t
t
0
-Kick-off 707 1697 24 91 76 34 300 2928 7.76
t
1
-Introduction of quizzes 923 2214 36 178 99 40 300 3788 7.69
t
2
-Grading red lights 932 2237 36 597 100 40 300 4241 8.53
t
3
-Written final exam 782 1877 30 501 73 36 300 3598 8.62
t
4
-New degree 617 2219 30 592 282 50 300 4087 8.29
t
5
-Lists of problems to hand-in 615 2214 18 591 333 50 300 4120 8.37
t
6
-Re-evaluation 602 2153 30 558 333 48 300 4022 8.64
t
7
-Quizzes not from the lists 565 2022 30 524 314 47 300 3801 8.71
Figure 3: Workload (in hours) of each task of the course by year (timestamp). A graphical representation of the first eight
columns in Table 3.
Figure 3 shows the evolution over time of the
workload of each of the tasks. One can see that the
most significant contributions to the total cost W
t
at
each timestamp are practical lectures and theory lec-
tures. In spite of that, the faculty members have the
impression that the same does not apply to students.
The tendency among many students as the course ad-
vances is not to attend lectures.
One can also see that all the tasks —except V
t
and
G
t
— are almost constant over time. Both V
t
and G
t
increase from t
0
to t
7
and are the principal reason why
W
t
also increases. Indeed, this behavior is as expected
because the measures introduced along the years are
mostly evaluative ones (i.e., directly or indirectly in
the form of exams) and then it is natural that they
mostly impact the tasks involved in designing, super-
vising and assessing exams.
Having the total workload hours W
t
required for
the course at every t, we can calculate the faculty
workload per student at timestamp t as
W
s
t
= W
t
/N
t
.
This measure indicates how many of the working
hours of the faculty members are dedicated to each
student. In other words, it indicates what is the cost of
every student in terms of faculty working hours. Fig-
ure 4 shows the evolution of this cost over time. As
the plot shows, the cost per student increased by an
hour from t
0
to t
7
. As we said before, this extra hour
exclusively corresponds to the increase in grading and
supervising (G
t
and V
t
, respectively). Figure 4 shows
that almost all the increment on the cost per student
appears at t
2
, together with the measure of grading
also the programs that obtained a red-light verdict by
the online judge. In spite of that effort, we previously
shown that the t
2
amendment did not have much in-
fluence on the pass rate.
5 ANALYSIS
In this section we go deeper into the analysis of the
pass rate and the workload by relating them trough
economic concepts.
On the surface, one can think that the whole evolu-
tion of the course (by means of the measures taken) is
a great success since the whole workload (W
t
) incre-
mented by a modest 13% while duplicating the rate of
success of the students. However, the measures taken
did not affect the whole workload but only G
t
and V
t
CSEDU2015-7thInternationalConferenceonComputerSupportedEducation
62
Figure 4: Hours of faculty work per student by year (times-
tamp). A graphical representation of the last column in Ta-
ble 3.
Figure 5: Productivity by year (timestamp).
that were (at least) triplicated. Therefore, the duplica-
tion of the rate of success does not seem to justify the
triplication of G
t
+V
t
.
In order to get more insight on how each measure
affects the pass rate, in the following we conduct a
cost-benefit analysis relating workload and pass rate.
Economists define productivity or effectiveness as
the ratio of outputs to inputs used in the production
process (Varian, 2005). In our case, being very coarse
and with all the safeguards and warnings required,
one can see the number of students that succeed the
course as the output and the total workload as the in-
put. Therefore we talk about the course productivity
Π
t
as the ratio of these two quantities over time. This
is,
Π
t
= P
t
/W
t
.
Figure 5 shows the behavior of Π
t
from t
0
to
t
7
. Looking at the plot we can observe that Π
t
has
the typical S-curve shape in economic terms (Varian,
2005). The interpretation that it is generally given to
this kind of curve is that if one reaches the inflection
point (as it seems to be our case, although we have
few observations after this inflection point) there is no
sense to continue increasing the input (i.e., the work-
load of the course, in our case) because this increment
has no impact on the output. In fact, it is negative.
Specifically the curve of Π
t
has three sections that
are noteworthy:
1. The first one is from t
1
to t
2
in which Π
t
decreases
due —as we already mentioned— to the grading
of exam problems labeled with a red light verdict
by the online judge.
2. The second one is from t
2
to t
5
where it increases.
During this period we can read from the curve that
the course was being productive in the sense that
the amendments applied were being effective as
was the increase of the workload.
3. The last period corresponds to t
5
to t
7
in which Π
t
drastically decreases. In this period the workload
increased but the number of students that passed
the course decreased. This is because the mid-
term practical exams are currently composed by
new problems that are not known in advance by
students. measure
We consider now more closely the impact of the
different measures over time. To capture the variation
of work among periods we define
∆W
t
= W
t
/N
t
−W
t−1
/N
t−1
and for the variation of students that pass the course
we define
∆P
t
= P
t
/N
t
− P
t−1
/N
t−1
.
We compare both of them by the rate
∆
t
= ∆W
t
/∆P
t
.
Abusing again of economics terminology, we call this
rate the marginal gain at time t of the undertaken mea-
sure (Varian, 2005).
Let us consider the following five general cases:
a) Case ∆W
t
> 0 and ∆P
t
< 0. Increasing the work-
load while decreasing the percentage of success-
ful students corresponds to a very negative under-
taken measure. It seems definitely a situation to
avoid.
b) Case ∆W
t
< 0 and ∆P
t
< 0 can be considered in
general as a negative option; of course one wants
to decrease ∆W
t
but not with the consequence of
decreasing also ∆P
t
. However, if |∆W
t
| |∆P
t
|
the undertaken measure deserves to be carefully
analyzed. It might be the case that a small de-
crease in ∆P
t
is justified if it implies a huge de-
crease of the workload.
c) Case ∆W
t
≥ 0 and ∆P
t
≥ 0 and ∆W
t
∆P
t
. This
corresponds to a big increase of work for a small
increase in the number of passing students, which
is in general a situation to avoid.
ACost-benefitAnalysisofContinuousAssessment
63

Table 4: Variations on rate of success, workload and marginal gain by timestamp.
Period ∆P
t
∆W
t
∆
t
t
1
-Introduction of quizzes 0.31 -0.07 -0.21
t
2
-Grading red lights 0.40 0.83 2.11
t
3
-Written final exam 2.37 0.10 0.04
t
4
-New degree 5.91 -0.30 -0.05
t
5
-Lists of problems to hand-in 12.25 0.11 0.01
t
6
-Re-evaluation 8.22 0.26 0.03
t
7
-Quizzes not from the lists -11.82 0.07 -0.01
d) Case ∆W
t
≥ 0 and ∆P
t
≥ 0 and ∆P
t
∆W
t
. This
is a positive case, a small increase in the quantity
of work produces a big improvement.
e) Case ∆W
t
< 0 and ∆P
t
> 0. This is in general an
outstanding measure. The larger the distance be-
tween ∆W
t
and ∆P
t
, the better the measure.
It is worth observing that the cases where ∆
t
is re-
ally unbalanced deserve special attention. Such cases
reflect an important disagreement between the effort
(measured by ∆W
t
) and the results (measured by ∆P
t
).
Let us now interpret the amendments taken in this
course in terms of the cases above. Table 4 shows the
values of ∆P
t
, ∆W
t
and ∆
t
over time.
t
1
Introduction of quizzes (2007-2008): This mea-
sure falls under Case e). Since |∆W
t
| is very small
this was a moderately productive measure.
t
2
Grading red lights (2008-2009): This amend-
ment falls under Case c). As we already men-
tioned this was a negative and unjustified mea-
sure that wastes a huge amount of resources. On
one hand, it fails to take advantage of the online
judge as a tool to help assessment, but on the other
hand —and as a consequence— it requires work-
ing hours that could be probably invested in more
productive activities.
t
3
Written final exam (2009-2010): The amend-
ment falls under Case d). So it seems to be a
positive measure. Indeed, given that the red light
verdicts have to be assessed, it is better to have
written exams since the time to design and super-
vise them is lower. However, this is only true in
the context of marking red light verdicts, not in
general. If compared against t
1
then it seems to be
a negative measure.
t
4
New degree (2010-2011): This is a positive mea-
sure that falls under Case e). Introducing mid-
term exams with a significant weight over the final
grade seems to have a very positive impact. The
fact of decreasing the number of hours of theory
lectures decreased the workload but did not seem
to affect the rate of success.
t
5
Lists of problems to hand-in (2011-2012): This
seems to be an outstanding amendment. It falls
under Case e). However one has to be prudent
with such kind of amendments. There is no doubt
that it increased the rate of success while decreas-
ing the workload, but the contents of mid-term ex-
ams were previously known by students. At the
end, that might be a drawback because of the in-
direct use of mechanical learning, which is a risky
practice. As C. P. Snow strongly stated:
“It was an examination in which the questions
were usually of considerable mechanical difficulty
but unfortunately did not give the opportunity
for the candidate to show mathematical imagi-
nation or insight or any quality that a creative
mathematicians needs.” (See foreword of (Hardy,
1940).)
t
6
Re-evaluation (2012-2013): This can be consid-
ered a positive amendment despite being very ex-
pensive. It falls under Case d).
t
7
Quizzes not from the lists (2013-2014): This
amendment falls under Case a). It seems to be a
situation to avoid if one looks only into the num-
bers. However, when related to the situation at
t
5
, it seems to confirm our perception that the stu-
dents are learning in a more mechanical way.
6 CONCLUSIONS
In this paper we have described the series of measures
taken to increase the pass rate of the Programming-1
course since its inception. The successive introduc-
tion of these reported measures increased the weight
of continuous assessment as a way to incentive stu-
dents work.
However, it appears that despite applying all these
measures, the rate of success of this massive course
has not increased as much as expected, while in fact,
all this increase of continuous assessment produced a
significant increase of the faculty workload.
In order to obtain a quantitative assessment of the
impact of each measure over both workload and pass
rate we have introduced two functions: productivity
CSEDU2015-7thInternationalConferenceonComputerSupportedEducation
64

and marginal gain. These functions provide a way
to rank the adopted measures as negative or posi-
tive. Our findings are valuable for the design of future
strategies for this and similar courses.
The analysis tools reported on this study provide
a way to analyze the effectiveness of new measures.
According with their corresponding cost-benefit anal-
ysis, the measure can be maintained, tuned or with-
drawn, under the general hypothesis that the current
content of the course as well as the proficiency levels
achieved by students who passed the course should
not be changed.
In particular, for some of the adopted measures, it
becomes clear that the amount of invested resources
(faculty workload) did not justified their impact in the
pass rate. For instance, the substantial overhead of
grading red lights had almost no impact on passing
rate. Other measures did have a positive impact with-
out increasing the workload like the weights given to
the different exams. Moreover, as all the introduced
measures involve continuous assessment, our study
shows that the corresponding workload has reached
its limit.
Some pedagogical strategies around the use of the
online Judge as an automated aid to motivate, help
and evaluate students that are used in this course have
been successfully used also in other courses (such as
Programming-2, Data structures and algorithms, Al-
gorithms, Functional programming, among others). It
could be interesting to extend this kind of analysis to
those courses.
We are aware that the scope of our study could be
extended. We have focused uniquely on the passing
rate but a finer analysis taking into account students
marks and motivation might bring more insights in
the effectiveness of every measure.
REFERENCES
Arrow, K. J. (1962). The economic implications of learn-
ing by doing. The Review of Economic Studies,
29(3):155–173.
Bowles, S. (1970). Towards an educational production
function. In Education, Income, and Human Capital,
pages 9–70. National Bureau of Economic Research.
Gim
´
enez, O., Petit, J., and Roura, S. (2009). Programaci
´
o 1:
A pure problem-oriented approach for a CS1 course.
In Hermann, C., Lauer, T., Ottmann, T., and Welte,
M., editors, Proc. of the Informatics Education Europe
IV (IEE-2009), pages 185–192.
Hanushek, E. A. (2008). Education production functions. In
The New Palgrave Dictionary of Economics. Palgrave
Macmillan.
Hardy, G. (1940). A Mathematicians Apology. Cambridge.
Reprinted with Foreword by C.P. Snow 1967. Cam-
bridge University Press, Canto Edition, 1992.
Ihantola, P., Ahoniemi, T., Karavirta, V., and Sepp
¨
al
¨
a, O.
(2010). Review of recent systems for automatic as-
sessment of programming assignments. In Procs.
of the 10th Koli Calling International Conference on
Computing Education Research, pages 86–93. ACM.
Mart
´
ın-Carrasco, F. J., Granados, A., Santillan, D., and Me-
diero, L. (2014). Continuous assessment in civil engi-
neering education - yes, but with some conditions. In
CSEDU 2014 - Proceedings of the 6th International
Conference on Computer Supported Education, Vol-
ume 2, Barcelona, pages 103–109. SciTePress.
Petit, J., Gim
´
enez, O., and Roura, S. (2012). Jutge.org: an
educational programming judge. In Proceedings of
the 43rd ACM technical symposium on Computer sci-
ence education, SIGCSE 2012, pages 445–450.
Revilla, M., Manzoor, S., and Liu, R. (2008). Competitive
learning in informatics: The UVa online judge experi-
ence. Olympiads in Informatics, 2:131–148.
Solow, R. M. (1997). Learning from ‘Learning by Doing’
Lessons for Economic Growth. Stanford University
Press. Series: Kenneth J. Arrow Lectures.
Stiglitz, J. E. and Greenwald, B. C. (2014). Creating a
Learning Society: A New Approach to Growth, De-
velopment, and Social Progress. Columbia University
Press. Series: Kenneth J. Arrow Lectures.
Tonin, N., Zanin, F., and Bez, J. (2012). Enhancing tradi-
tional algorithms classes using URI online judge. In
2012 International Conference on e-Learning and e-
Technologies in Education, pages 110–113.
Varian, H. R. (2005). Intermediate Microeconomics: A
Modern Approach (7th Edition). W. W. Norton and
Company.
Verd
´
u, E., Regueras, L. M., Verd
´
u, M. J., Leal, J. P., de Cas-
tro, J. P., and Queir
´
os, R. (2012). A distributed system
for learning programming on-line. Computers & Ed-
ucation, 58(1):1 – 10.
A TECHNICAL DETAILS
In this appendix we calculate the amount of working hours
per task at each stage of our course based on the 14 answers
that we obtained by surveying current instructors and ex-
trapolating these values to previous timestamps. Note that
most measures, once taken, remain in force, thus the work-
loads involved are accumulated.
t
0
Kick-off (2006–2007): The course started with two
kind of lectures, theory and practical, of 3 hours per
week each. Theory lectures were given to groups of
60 students, and the survey says that in average it takes
1.5 hours to prepare one hour of theory lectures. This
results in a total of 2.5 hours of work (preparation +
lecturing). Since the course is 15 weeks long, we have:
ACost-benefitAnalysisofContinuousAssessment
65

T
t
0
hours =
(1 + 1.5)
hours
1h theory
× 3
1h theory
week× group
×15 week ×
N
t
0
60
group ≈ 1.7 × N
t
0
hours
where N
t
is the total number of enrolled students at
time t. Proceeding similarly for practical sessions and
considering that the size of the laboratory groups is
of 20 students, and that the preparation of each hour
of practical sessions takes 1 hour, we have that L
t
0
=
2 × 3 × 15 ×
N
t
0
20
.
There were two exams of 2 problems each. There were
2 turns of exams (morning and afternoon), all the stu-
dents that have morning classes are examined with the
same exam which is different from the exam of the af-
ternoon students. So 4 problems should be prepared (2
per turn). Since each exam lasted for 2 hours and the
students were distributed in laboratory rooms with 20
computers we have that V
t
0
= 2 × 2 ×
N
t
0
20
. We estimate
that the preparation of each problem takes in average 3
hours of work (this include writing the statement, im-
plementing the solution and designing the tests that the
system requires to judge the submissions). Therefore,
E
t
0
= 24.
Only the solutions of students that obtained a green
light for a problem were graded by hand, and this
was, approximately, a third of the students, so G
t
0
=
2 × 2 × 0.2 ×
N
t
0
3
hours, considering that grading one
problem takes 12 minutes.
The coordination of the whole course has a fixed cost
k plus a cost that depends on the number of students of
each course. We estimate this last amunt in one half
hour per group of 10 students, then C
t
0
= k +0.5 ×
N
t
0
10
.
Finally, we are estimating that the software mainte-
nance takes 4 hours a day yielding to S
t
0
= 4 × 5 × 15
per course.
t
1
Introduction of quizzes (2007–2008): In this period
4 small mid-term exams were introduced in addition
to the two original exams and they were applied also
in two turns. Considering that the time required to
prepare each small exam was 1.5 hours and that the
time required to grade the small exam of one student
was 6 minutes, this measure increased E
t
and G
t
to
E
t
1
= E
t
0
+ 4 × 2 × 1.5 and G
t1
= 4 × 0.3 ×
N
t1
3
. The
workload of all the other tasks remained the same.
t
2
Grading red lights (2008–2009): When all the sub-
missions (and not only the green labeled ones) have to
be graded G
t
was triplicated. G
t
2
= 4 × 0.3 × N
t
2
.
t
3
Written final exam (2009–2010): At this point the fi-
nal exam was changed to be a written exam of 3 prob-
lems. The exam was organized in only one turn applied
to all the students (same exam for all students).
The time to prepare a problem for a written exam is es-
timated in 2 hours (1 hour less than the time of a practi-
cal exam). Therefore E
t
3
= E
t
1
− 2 × 2 ×3 + 3 × 2. The
written exam lasts for 3 hours. Since larger rooms (with
place for 60 students) can be used for a written exam,
V
t
decreased to V
t
3
= 2 ×
N
t
3
20
+ 3
N
t
3
60
.
t
4
New degree (2010–2011): With the new degree the
hours of theory lectures per week decrease from 3 to
2 per group yielding T
t
4
= 2.5 × 2 × 15 ×
N
t
4
60
. The
evaluation system also changed. The big mid term
exam disappeared. The four small mid term exams
became formal exams of one problem each. Thus,
E
t
4
= 4 × 3 × 2 + 2 × 3 The first 3 mid term practi-
cal exams lasts 1.5 hours each while the last one for
2.5 hours. The final exam still lasts 3 hours, thus
V
t
4
= (3 × 2 × 1.5 +2 × 2.5)
N
t
4
20
+ 3
N
t4
60
.
t
5
Lists of problems to hand-in (2011–2012): A list of
problems per exam to be delivered by the students be-
fore the exam was introduced. The problems of the ex-
ams were chosen from the problems of the list. The
preparation of each laboratory problem decreased to 1.5
hours. Hence E
t
4
= 4 × 2 × 1.5 + 3 × 2 = 18. Finally,
the preparation of the lists increase C
t
by 10 hours, so
that C
t
4
= k +10 + 0.5
N
t
4
10
.
t
6
Re-evaluation (2012-2013): This measure added 3
hours to E
t
, 20 hours to T
t
, 60 hours to L
t
, 15 hours
to G
t
and 3 hours to V
t
.
t
7
Quizzes not from the lists (2013-2014): This measure
involved the creation of new problems for the mid-term
practical exams, instead of taking them from the lists.
This increased the time for preparing each problem
from 1.5 to 3 hours. Thus E
t
5
= 4 × 2 ×3 + 3 ×2 = 30.
CSEDU2015-7thInternationalConferenceonComputerSupportedEducation
66
