
High Power Laser Diodes with Optical Feedback
Contribution to Doctoral Consortium
Dennis Bonsendorf
LIMO Lissotschenko Mikrooptik GmbH, Bookenburgweg 4-8, Dortmund, Germany
Ruhr-Universität Bochum, Universitätsstraße 150, Bochum, Germany
1 RESEARCH PROBLEM
High power direct diode lasers, as they are used in
material processing or photonic pumping
applications, are sensitive to back reflected light,
which is usually called “optical feedback”. This
feedback is generated unintendedly by optical
surfaces of laser processing tools like cutting heads
or by the processed surface itself. In material cutting
or welding processes copper or aluminum are highly
reflective materials (Steen, 2010) and photonic
crystals can be origin of unwanted radiation even at
changed wavelength (Dowley, 1998). Inside the
laser system the beam transformation or the fiber
coupling unit generates optical feedback. In some
applications optical feedback is actually desired as
part of the design. Volume Bragg gratings (VBG)
reduce the spectral width by utilization of feedback.
However, there is a price to pay, when the reflected
light reaches the emitter of the laser diodes it can
result in spectral modulation, lifetime reduction or
catastrophic optical (mirror) damage (COMD).
2 OUTLINE OF OBJECTIVES
To provide laser systems with reliable and stable
operation in the presence of optical feedback, design
guidelines have to be elaborated and evaluated.
To do this a measurement setup is developed to
apply optical feedback to laser diodes, which is
controlled in intensity and direction. Its influence on
the electrical and optical properties of the laser diode
is observed. Laser diode bars with different types of
semiconductor material, structure and emitter count
are investigated. Then the parameters with influence
the probability of disturbance or device failure are
identified. These parameters can rise or lower the
risk of a COMD.
The influence of emitter position variation in
fast-axis direction (smile) was evaluated. Optical
components used for beam transformation,
combination or fiber coupling have individual
behavior to the generation of optical feedback.
The study is mostly application related as the
used laser diodes and optical elements are
commonly used components and optical layouts.
This ensures that the gathered information lead to
developments of protection strategies and devices
for industrial laser diode systems against the threat
of optical feedback.
3 STATE OF THE ART
Laser diodes are typically designed for stand-alone
operation. For example the front facet reflectivity is
optimized to achieve highest efficiency or highest
brightness. However, the presence of optical
elements is not taken into account, although they
influence the internal resonator design. From the
point of view of the laser diode manufacturer this
point is comprehensible as the field of applications
is wide it is difficult to optimize laser diodes to
cover multiple optical scenarios.
For this reason the interaction between optical
system and laser diodes were subject to extensively
investigations (Ohtsubo, 2010). Especially single
mode laser emitters with optical feedback got high
attention. This is an effect of the commonly use of
these types of laser diodes in the communication
technology (Kaminow, 2013). In contrast, the
information on broad area laser emitters and
especially on laser bars are sparse. Also long term
effects of optical feedback to the reliability of laser
diodes are not yet understood.
4 METHODOLOGY
This chapter describes the measurement techniques
and procedures to gather the information about laser
device failure due to optical feedback.
47
Bonsendorf D..
High Power Laser Diodes with Optical Feedback - Contribution to Doctoral Consortium.
Copyright
c
2015 SCITEPRESS (Science and Technology Publications, Lda.)
4.1 Laser Diodes
The used laser diodes are commercially available
components. They are mounted p-side down on a
passively cooled cooper heat sink. All laser diodes
used in experiments are checked in advance. This
includes visual inspection of front facet, recording of
optical power to current and voltage (PIV)
characteristics as well as spectral measurements and
near and far field intensity distributions. The
different types are listed in Table 1.
Table 1: Batches of test laser diodes.
Batch Material Wavelength Emitter No.
A AlGaAs 808 nm 19
B InGaAs 980 nm 10
C InGaAs 1010 nm 10
Laser diodes of batch A based on semiconductor
material containing aluminum and are well known
for susceptible behavior against optical feedback.
Laser diodes with InGaAs semiconductor are more
robust. Two versions with different wavelengths are
tested (batch C and D).
4.2 Detection of Failure Threshold
The threshold of device failure has to be identified to
derive design limits. Optical and electrical behavior
is observed to gather indicators connected to defined
feedback intensities.
4.2.1 Test Setup
The setup has to be suitable to measure and control
the amount of optical feedback reflected towards the
laser diode. The optical system has to be comparable
to commonly used designs for laser systems.
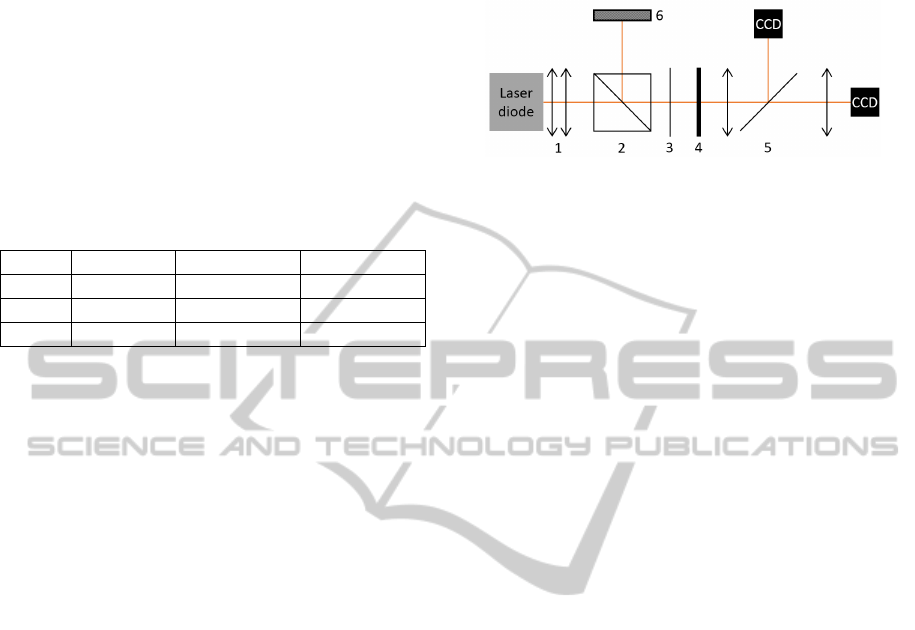
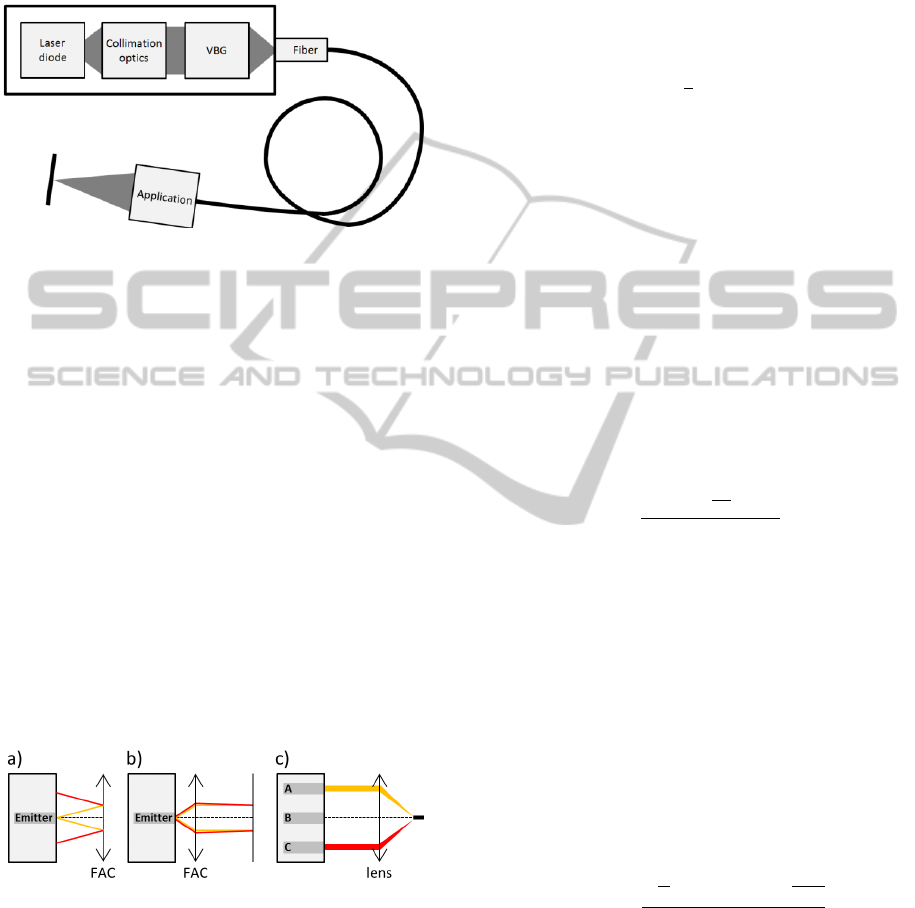
In Figure 1 the basic layout of the test system is
illustrated. The radiation of the laser diode is
collimated by cylindrical lenses in fast- and slow-
axis direction. An array of biconvex lenses rotates
the beam of each emitter geometrically by 90
degrees to achieve a more symmetric beam
parameter product. This component is part of the so
called beam transformation system (BTS). Note, that
the nomenclature of slow- and fast axis direction are
now inverted. The collimated beam is transmitted
through a polarization beam splitter and a quarter
wave plate. After reflection at a mirror the beam
passes the polarization optics again. Depending on
the angle of the wave plate, a part of the beam is
reflected at the beam splitter and hits on a power
measurement head. The remaining radiation is
transmitted towards the laser diode and focused via
the collimation lenses back onto the emitter.
Figure 1: Measurement setup with variable feedback
intensity and beam diagnostics. 1) collimation optics 2)
polarization beam splitter 3) wave plate 4) feedback mirror
5) beam splitter 6) power measurement head.
Closely behind the BTS two slit blades are
mounted to limit the transmitted radiation to a
defined number of emitters. This allows determining
the influence of optical feedback on a single or
multiple emitters.
The electrical properties of the laser diode are
monitored using a calibrated resistor together with a
voltmeter. Photodiodes are used to measure the
optical intensity. They are referenced to a
commercial power measurement head. An optical
imaging system is used to observe both, the near-
field intensity distribution of the emitter facet and
the far-field intensity distribution. A spectrometer
takes the spectrum of the laser beam.
This measurement setup is automated as the
quarter wave plate rotation is motorized and the
measured data are collected by data loggers and
software acquisition.
4.2.2 Procedure
The optical feedback beam is adjusted by
manipulating the angle of the reflection mirror. The
electrical and optical behavior of laser diodes with
optical feedback is used to find the optimal
alignment. Details to this behavior are given in
chapter 5.1. Several steps are necessary to optimize
the feedback injected into the laser emitter. First, the
laser diode is operated without the feedback mirror
and the centroid of the near-field intensity
distribution is marked. After adding the feedback
mirror the laser diode is operated below laser
threshold. The mirror angle is varied along slow axis
direction until the signal on the camera reaches its
maximum. This step uses the threshold reduction
effect due to optical feedback. In fast axis direction
the mirror is tilted until the intensity distribution
reaches the before marked position. Now the
threshold reduction current value can be determined.
Due to temperature expansion a slight
PHOTOPTICS2015-DoctoralConsortium
48
readjustment is necessary at the working point. At
high operation currents a lower feedback level has to
be chosen to avoid damage to the laser diode. The
spectrum is used as an indicator of maximal
feedback injection, as the wavelength rises with
higher feedback.
Depending on the test scenario the load of the
laser diode starts minimal and is than raised until
device failure. The load is controlled either by the
feedback intensity or the operation current.
4.3 Long Term Tests
Industrial field experience has shown that optical
feedback may lead to reduced lifetime of laser
diodes. Devices with an initially stable operation
condition may fail with time delay. This
presumption is analysed by the following long term
test.
4.3.1 Test Setup
Twenty-four devices of batch C are used in this long
term test. Each was collimated in both axis and then
applied to a reflective element. The transmitted
radiation was absorbed by a beam dump. The
devices were split up into four groups equipped with
different feedback levels. The reflective elements
were a 20 % VBG, a 10 % VBG and a plate with
8,2 % broadband feedback, respectively. One group
was used as reference without optical feedback.
Every laser diode is monitored by a photodiode
and the data recorded by a logger.
4.3.2 Procedure
All laser diodes are operated at their working point
(I = 55 A). Optical output power and spectra of each
laser diode are measured frequently and the emitters
are inspected if a COD occurred. The test is
cancelled when several laser diodes have damaged
emitters.
5 RESULTS & ANALYSIS
5.1 General Behavior Due to Optical
Feedback
This chapter shows the influence of optical feedback
to the optical and electrical properties of laser
diodes. These properties indicate how much of the
feedback is coupled back into the emitter. Basing on
this information the alignment of the feedback
mirror is evaluated.
5.1.1 Results
The laser threshold current is reduced due to optical
feedback. 808 nm bars (batch A) have a typical laser
threshold of 7,15 A (standard deviation σ = 0,23 A)
which is reduced to 4,56 A (σ = 0,38 A) with optical
feedback. The laser threshold current of 980 nm bars
of batch B without feedback is 4,38 A (σ = 0,21 A)
and is reduced to 2,98 A (σ = 0,10 A) with feedback.
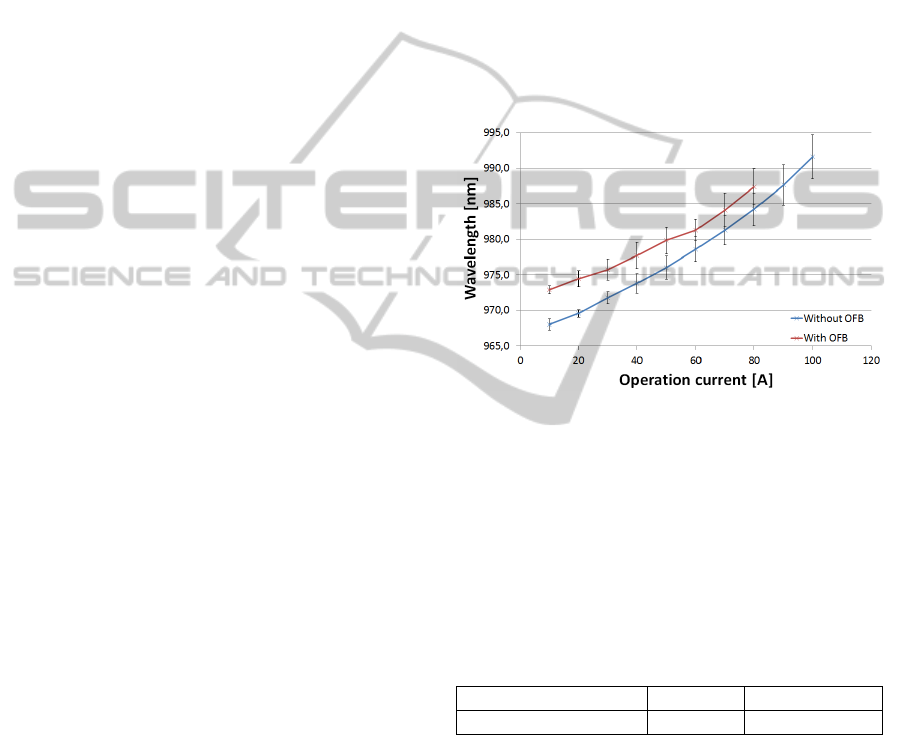
The wavelength of the emitted radiation shifts to
longer wavelengths when the feedback intensity
rises. In Figure 2 the wavelength depended of optical
feedback at different operation currents is compared.
Figure 2: Central wavelength with and without optical
feedback of laser diodes of batch B.
The operation voltage of the laser diode
decreases with optical feedback intensity. As the
emitters of the laser bar are parallel operated this
effect occurs more intensive when all emitters are
exposure to optical feedback. Depending on the
intensity the operation voltage can be lowered to the
values given in Table 2.
Table 2: Voltage reduction by optical feedback.
Batch A B & C
Voltage reduction 14 mV 8 mV
5.1.2 Discussion
The presented values are only given at a qualitative
level of optical intensity. Future presentation will be
able to give them in context of a quantitative
feedback level injected into the laser diode emitters.
This will be possible as a result of the calculations
and beam simulations introduced in chapter 5.4.
The laser threshold current has a strong
dependence to the intensity of optical feedback. It
has a high suitability as a criterion of how well the
HighPowerLaserDiodeswithOpticalFeedback-ContributiontoDoctoralConsortium
49
feedback mirror is aligned. The physical background
of laser threshold reduction can be explained by the
Kobayashi-Lang rate equations, which are not
subject of this survey (Kobayashi and Lang, 1980).
It can be shown that the feedback mirror operates as
an external resonator and has an influence of the
electron-photon transition of the semiconductor.
The wavelength rises with higher amount of
optical feedback. This effect can be caused by a
raising temperature, which would affect a higher
band gap of the electron transition. The
semiconductor temperature rises due to absorption
of the feedback radiation, which doesn´t fulfil the
resonator condition.
Operation voltage reduction is observed with
increased optical feedback. This effect might be also
a result of the temperature change of the
semiconductor bulk. There are several sources
reporting of the temperature dependence of the
semiconductor voltage. There are applications using
this method as a thermal detector (Ryu, 2005).
For this work it is most important that a
significant dependence of the optical feedback
intensity to the laser threshold current, wavelength
and operation voltage could be shown. Therefor
these parameters can be used to evaluate the quality
of the feedback beam alignment.
5.2 Detection of Failure Threshold
5.2.1 Results
Laser diodes of batch A are operated at nominal
current of 50 A. The feedback intensity is raised
until COD occurs. This measurement is performed
for single emitters which are isolated with slit blades
and whole bars. The mean value and standard
deviation of this series are given in Table 3. The
OFB power is calculated from the device optical
output power reduced by the power ejected by the
polarization optics.
Table 3: Optical feedback power at device failure of laser
diodes of batch A.
OFB
power
Standard
deviation
Isolated Emitter 1,3 W 0,15 W
Whole bar 0,8 W 0,09 W
When testing laser diodes of batch B raising the
optical feedback intensity doesn´t compulsory lead
to COD. Instead, the operation current is raised in
10 A steps until device failure. The test has been
performed for isolated emitters, 3-emitter-packs and
whole bars. The current values causing a COD are
given in Table 4.
Table 4: Operation current at device failure of laser diodes
of batch B.
Current at
COD
Standard
deviation
Isolated Emitter 92 A 3 A
Neighbored emitter 70 A 2,8 A
Whole bar 60 A 2,7 A
During determination of device failure threshold
also spectra of the laser beam are taken. Figure 4
Error! Reference source not found. shows the
spectrum of an isolated emitter of batch A. The
optical feedback power is varied. Two points are
noticeable: First, at 0,4 W feedback power there is a
significant change of the spectrum. Second, above
1,1 W the spectrum series ends; this is due to COD.
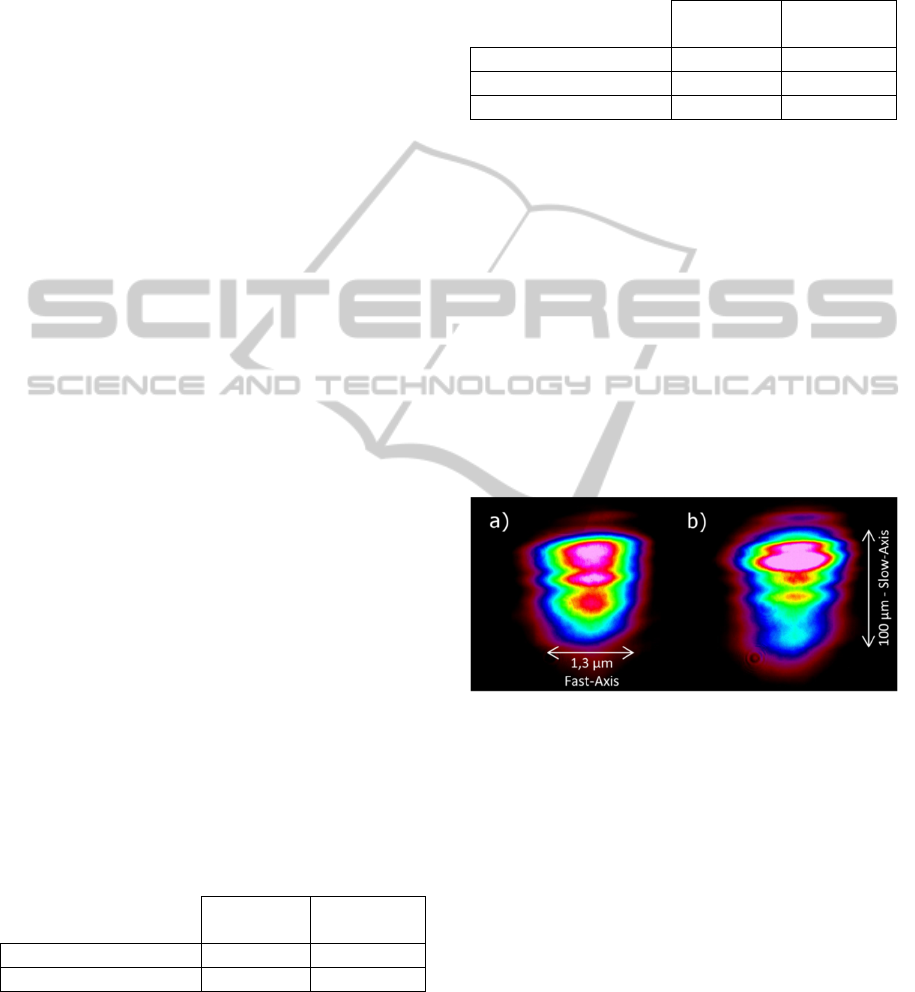
Simultaneously the near field distribution is
captured. In Figure 3 two shots are compared: one at
a feedback power below 1,1 W leading to the change
in the spectrum and one above. The spots with the
highest intensity moved and the size of the spot is
larger. This shows that the near field distribution
changed at the same moment as the spectrum.
Figure 3: Near field distribution a) before and b) after
change in spectrum.
In the next step the spectrum of a whole bar
(batch A) is observed. The feedback is applied to all
emitters at the same time. The contribution of the
different emitters to the spectrum and their variation
due to optical feedback is illustrated in Figure 5.
After finishing the COD threshold measurement
the laser diodes are examined with a light
microscope. Figure 6 shows a typical front facet of a
laser diode with COMD. The blue-green colored
part represents semiconductor. In the bottom part of
the figure the heat sink is visible. As the device was
operated in LED operation mode the violet stripe
represents the remaining radiation generated by the
emitter.
PHOTOPTICS2015-DoctoralConsortium
50
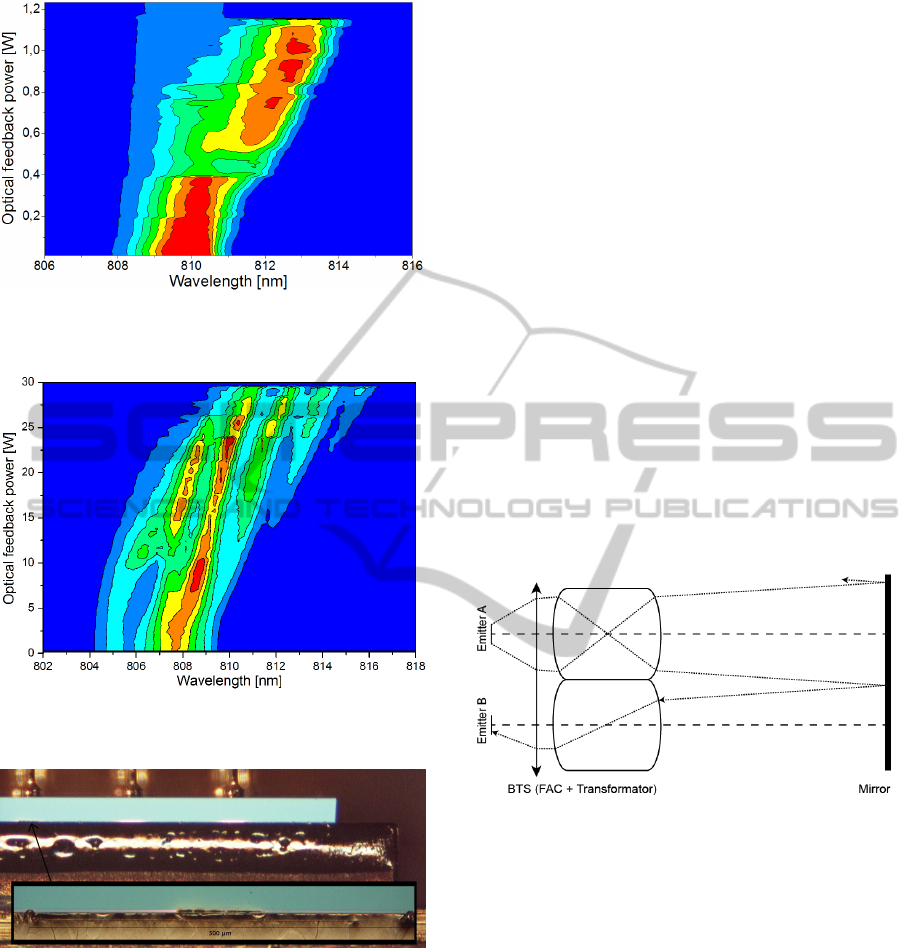
Figure 4: Spectrum shift by feedback intensity variation in
case of an isolated emitter.
Figure 5: Spectrum of whole bar of batch A with varied
optical feedback intensity.
Figure 6: Light-microscope picture of facet with COMD.
The violet area is radiation from LED operation mode of
the laser diode.
5.2.2 Discussion
The measurements prove the expectation that
devices of batch A are less robust against optical
feedback than devices of batch B. The value named
OFB power is the power generally reflected towards
the emitter. It is not equal to the power injected into
the emitter because losses at optical elements have
to be taken in account. This value will be calculated
in future.
The failure threshold is higher in case of an
isolated emitter compared with several emitters with
optical feedback. First, this can be due to a higher
thermal load of the semiconductor when several
emitters are applied of optical feedback. The
radiation is partly absorbed in the bulk material and
heats up. The higher temperature can increase the
risk of COD.
Second, the emitters are subject of direct
radiation from other emitters. All emitters are
collimated by the same FAC lens, but each emitter
has its own lens array element of the beam
transformer (compare Figure 7). The beam has a
remaining divergence after collimation and the beam
expands by propagation. The returning beam can be
larger than the lens array aperture. The part of the
beam which doesn´t fit through its array element is
then coupled to the beam path of the neighbored
emitter. On this way it is finally coupled into that
emitter. That means that an emitter of a laser bar has
a higher optical load due to the optical feedback of
its neighbored emitters.
Figure 7: The beam emitter from Emitter A expands due to
its remaining divergence. After reflection the beam can hit
on the transformator array segment of the emitter B.
The laser diode has several optical properties. It
could be shown that these correspond to each other.
Changes in the spectrum lead to changes in the near
field distribution. Intensity peaks in the near field
distribution are observed to be the origin of COD.
The position of these intensity peaks might be at the
same position of the defects visible on the front facet
investigated by light microscopy after COD.
5.3 Long Term Behaviour
5.3.1 Test Results
Optical feedback has the ability to damage a laser
diode instantly. This damage threshold can be
HighPowerLaserDiodeswithOpticalFeedback-ContributiontoDoctoralConsortium
51
determined as shown before. When a laser diode is
operated below this damage threshold this doesn´t
correspond to a stable operation mode. The COD
can occur time-delayed.
To demonstrate this behaviour each one emitter
per test procedure is isolated. The optical feedback
intensity is variable and set to a value below instant
COD threshold. The time to COD is measured and
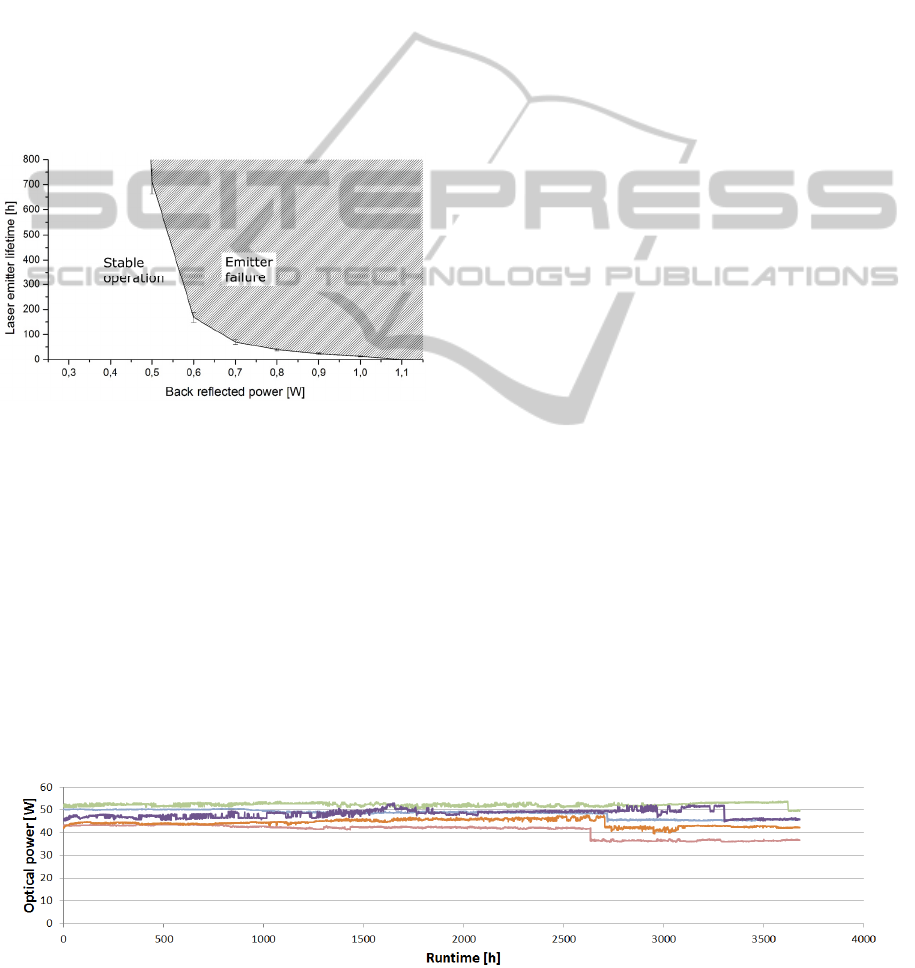
the mean values are shown in Figure 8. At feedback
levels close to the instant COD threshold the emitter
lifetime is very short and lasts between several hours
to several days. When the optical feedback intensity
is lowered further the lifetime is significantly higher.
The measurement point with the longest lifetime
before COD was at half the instant COD threshold
and ran for about 700 hours.
Figure 8: Runtime until device failure dependent on
optical feedback intensity. In this chart measurement
series of laser diode batch A are presented.
Another scenario operates with a far lower
feedback, which is instead applied for a longer time
period. This scenario has been examined by a long
term test using laser diodes of batch C. Figure 9
shows the optical power of five of 28 during the
whole test. At these five devices a COD of one
emitter occurred. Three of the failure laser diodes
were equipped with a 20 % VBG, while two had a
8,2 % broad band feedback. The first device failure
happened after 2700 hours of operation, the test has
been cancelled after 3700 hours.
One of the laser diodes has been inspected by
spectroscopic methods in advance. In cooperation
with the team around Dr. Tomm of the Max Born
Institute Berlin the bar was observed by laser beam
induced current (LBIC) procedure. This can show
defects present inside or on the surface of the
semiconductor (Fang, 1992). One emitter of a bar
indicated defects inside the bulk material. During the
test exactly this emitter failure.
5.3.2 Discussion
In further steps an appropriate model is developed to
describe this behaviour. The “Weibull”-distribution
might be suitable to fit the measurement results. It is
commonly used for reliability analysis and
description of failure probability (Ohring, 1998).
Moreover there are studies about lifetime reduction
of laser diode systems, which are subject to other
stress factors, like cooling temperature or operation
current increase. If device failure behaves similar in
both cases, optical feedback and other stress factors,
the same physical reason for COD might be
responsible.
The long term test shows that even feedback
rates of commonly used optical elements can reduce
the lifetime of laser diodes drastically. It is not yet
shown why two laser diodes with lower feedback
had COD. There might be a difference between
narrow and broad band feedback.
An interesting result is that the emitter with
defects showed COD during he test. It can be an
indication that device failure occurs preferable at
emitters with existing defect cells. To provide more
data another test run with laser diodes inspected by
the LBIC procedure is currently in preparation.
5.4 Describing Model
5.4.1 Optical System Modelling
The amount of optical feedback reaching the laser
diodes facet can be calculated. Therefore the
Figure 9: Optical power trends of five laser diodes operated in the long term test. Three with 20 % VBG and two with 8,2 %
broad band feedback. The drop in each trend indicates the moment of emitter failure.
PHOTOPTICS2015-DoctoralConsortium
52
components of a laser diode system have to be
described individually. The optical components
shown in Figure 10 are typical for high power laser
diode systems. However, VBG and fiber coupling
are optional and depend on the application needs.
Figure 10: Typical elements of an optical system relevant
for amount of optical feedback.
The optical elements can be divided into three
main groups and their belonging beam paths are
drafted in Figure 11. a) Collimation optics. The
divergent laser beam and hits on the fast axis
collimation (FAC) lens. Commonly the first flat
surface has a distance of only 70 to 150 µm to the
emitter. The light is reflected divergent and only a
small part is reflected into the emitter. b) Selective
optics. The beam is collimated and hits a plane
surface, where it is partly reflected. As the reflected
beam is collimated it can be transmitted over long
distances inside the optical system. c) Focusing
optics. The beam is focused on the plane surface of
an optical element like a light guiding fiber. This
case is interesting, when observing a multi emitter
bar. Each emitter beam path is mirrored and reversed
and ends finally at an emitter opposite of the original
one. Here a strong coupling between each two
emitters can be observed.
Figure 11: Three groups of optical elements contributing
to the amount of optical feedback: a) collimation optics, b)
selective optics and c) focusing optics. Yellow lines
represent forward beams, red illustrates reflected beams.
The optical power reaching the laser diodes facet
is calculated by the emitter output power
the reflectance R of the reflective element and
the transmission efficiency of the optical system.
P
P
(1)
While
and R can be measured has to be
calculated. describes how much of the angular and
the spatial intensity distribution of a laser diode
emitter is transmitted through the optical system. As
the intensity distribution of an emitter is not
homogenous it is approximated by a super Gaussian
distribution.
(2)
This is valid for spatial and angular distribution
by picking according parameters. σ represents the
half width or angle of radiation at 1/e² intensity,
respectively. The SG value is used to fit the
Gaussian distribution to the measured intensity
distribution.
is used to set the result to 1, when the
integral over the whole range is calculated.
The constraints of the integral depend on the
individual optical component. Depending on the
number of variables equation 2 has to be integrated
in both spatial and both angular directions.
FAC Reflection (Figure 11a): Beams emitted
from the facet from one point are reflected back into
the active region by fulfilling these upper and lower
angular constraints:
,
tan
2
2
(3)
By changing emitter height h
E
to width w
E
and
emitting point position y
E
to x
E
the integration
constraints in slow axis direction are given.
Additionally this has to be integrated spatially in x
and y direction.
FAC aperture (Figure 11b): Due to remaining
divergence the beam size increases after collimation.
When reflected through the optical system it can be
cut of at the aperture of the optical elements.
Especially the FAC lens has typically a small
aperture A. The integration constraints of equation 2
are given by the distance d between FAC lens and
reflective element and focal length f:
,
tan
2
2tan
(4)
In this case only the fast axis direction has
influence to the transmission efficiency and has to
be integrated angular and spatial.
Smile: Induced through mechanical stress by
soldering a laser chip onto a heat sink the center of
an emitter has an offset ∆ to the optical axis. The
angular distribution is not relevant in this case. Here
HighPowerLaserDiodeswithOpticalFeedback-ContributiontoDoctoralConsortium
53
the spatial integration constraints are modified.
,
∆
(5)
On this way the influence of all optical
components to the total amount of optical feedback
reaching the emitter can be described.
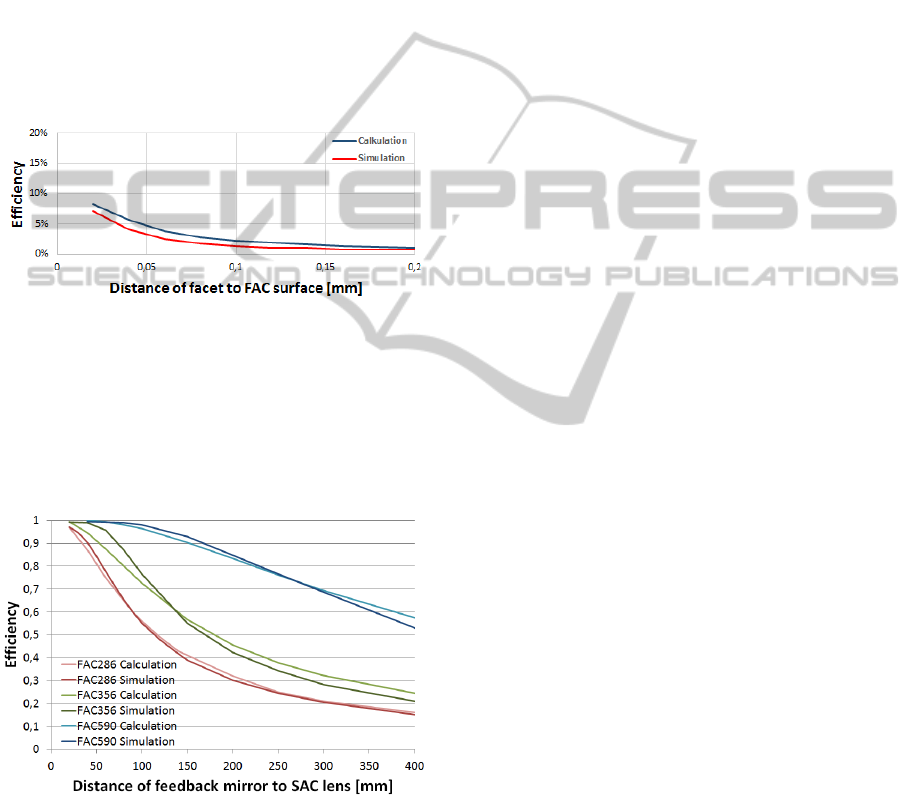
5.4.2 Validation & Discussion
For validation these equations were calculated with
the parameters of typically optical components and
simulated with the optical design software ZEMAX.
Figure 12 shows the results of the equation 2
with the constraints of equation 3 compared with the
simulation of light reflected at the FAC lens surface.
Figure 12: Efficiency of the transmission of the reflected
beam through the FAC lens aperture.
This has also been done for equations 2 and 4
describing the beam cut off due to exceed of lens
aperture. Several FAC lens types are used. The
comparison of calculated and simulated values is
plotted in Figure 13.
Figure 13: Efficiency of the transmission of the reflected
beam through the FAC lens aperture.
Both figures show a good agreement of
calculation and simulation.
In a future step measurement data will be added
to these plots.
6 STAGE OF THE RESEARCH
The experimental work of this research project has
proceeded to final stage. Measurement series with
different devices are completed. Defect threshold of
isolated bars and multiple emitters are determined.
Additionally a long term test in cooperation with the
MBI Berlin is in preparation. In the next stage the
observed effects of optical feedback to the laser
diode properties are compared and described by
physical theory. To calculate the optical power
injected into the laser diode emitters a
comprehensive optical model will be elaborated.
This will finally describe the coupling efficiency of
the reflected light. Within the next months parts of
the presented work will be published in peer-
reviewed journals.
Based on the results of this work LIMO will be
capable to integrate protection devices into laser
diode systems. For this purpose knowledge of the
damage threshold of the used laser diodes, influence
of the optical components and application are
necessary. This information will be derived from the
next stage research and lead to a reliable operation
of high power laser diode systems.
REFERENCES
Dowley, M., 1998. Diode Pumped Solid State (DPSS)
Lasers: Applications and Issues. Optical Society of
America.
Fang, W., Ito K., 1992. Identifiability of Semiconductor
Defects from LBIC Images. SIAM J. Appl. Math.,
52(6), 1611–1626.
Kaminow, I., Li, T., Willner, E., 2013. Optical Fiber
Telecommunications Volume VIA: Components and
Subsystems. Academic Press.
Kobayashi, K., Lang, R., 1980. External optical feedback
effects on semiconductor injection laser properties.
IEEE J. Quantum Electron 16, 347-355.
Steen, W., Mazumder, J., 2010. Laser Material
Processing. Springer.
Ohtsubo, J., 2010. Semiconductor Lasers: Stability,
Instability and Chaos. Springer.
Ohring, M., 1998. Reliability and Failure of Electronic
Materials and Devices. Academic Press.
Ryu, H., et. al., 2005. Measurement of junction
temperature in GaN-based laser diodes using voltage-
temperature characteristics. Applied physics letters
87, 093506.
PHOTOPTICS2015-DoctoralConsortium
54
