
User and Group Profiling in Touristic Web Portals
Through Social Networks Analysis
Silvia Rossi
1
, Francesco Barile
2
and Antonio Caso
3
1
Dipartimento di Ingegneria Elettrica e Tecnologie dell’Informazione,
Universita’ degli Studi di Napoli “Federico II”, Napoli, Italy
2
Dipartimento di Matematica e Applicazioni, Universita’ degli Studi di Napoli “Federico II”, Napoli, Italy
3
Dipartimento di Fisica, Universita’ degli Studi di Napoli “Federico II”, Napoli, Italy
Keywords:
User Profiling, Group Recommendation, Dominance, Small Groups, Social Networks.
Abstract:
Touristic Web Portals can be considered windows on cultural cities. By providing all the necessary information
in one single portal, the user is free to decide her/his preferred items/activities without the need of consulting
different information sources. However, this kind of interface introduces the typical information overload
problem. In this work, we present our framework for profiling both a single user and a group of users that
relies on a not intrusive analysis of the users’ behaviors on social networks/media. By using data drawn from
social networks, it is possible to obtain useful indirect information to profile occasional users. Moreover, the
analysis of the behavior of small close groups on social networks may help an automatic system in the merge
of the different preferences the users may have, simulating somehow a decision process similar to a natural
interaction. In this direction, our aim is to identify key users taking in account concepts from research on
users’ connectivity and on users’ communication activity.
1 INTRODUCTION
The Smart City concept led to a series of projects
with the aim of making cities more “livable” places
for both residents and tourists, and of improving city
management, by bringing together local skills, com-
munity institutions and, above all, a massive use of In-
formation and Communications Technologies (ICT).
In this context, we are involved in a smart city
project whose main mission is to develop ICT compo-
nents with the aim of re-evaluate the cultural heritage
fruition of the historic center of Naples. In partic-
ular, some of developed components aim at the cre-
ation of a framework, with web and mobile applica-
tions, that helps tourists in visiting the city, providing
a collection of touristic Points of Interest (POI) with
descriptions, images and details with different levels
of depth.
Usually, when tourists plan their vacation, they
look for transports, accommodations, cultural sites,
restaurants, events and so on. In most cases, they
have to refer to several web-applications, at least one
for each service, while we would like to provide a
unified window to the city which gathers all informa-
tion and services and shows them on a map as POI,
in order to support tourists in travel organization pro-
cess. Since the number of the available POI is high
and since many tourists visit a city only for few days,
it is not possible to visit and evaluate every POI: the
tourist has to make a selection of what he/she believes
to be the most valuable POI.
In this work, we describe a general framework that
relies on the automatic analysis of both single user
profiles and group relationships, using the same social
network, in order to provide a POI filtering technique
that can work for both. In particular, form one side,
we address the cold-start problem, to properly evalu-
ate the similarity between users, by shifting such eval-
uation on a different domain (e.g., a social network).
On the other side, the sparsity problem is addressed
by evaluation item categories and not only the spe-
cific items. The same automatic analysis of the user
behaviors on social networks can be used to evalu-
ate social relationships among users in a group that
can help in the creation of group recommendations.
The use of this common framework to address both
problems, up to our knowledge, was never addressed
before in literature.
In detail, the developed framework is based on an
automatic user profiling system that, without intrud-
455
Rossi S., Barile F. and Caso A..
User and Group Profiling in Touristic Web Portals Through Social Networks Analysis.
DOI: 10.5220/0005448704550465
In Proceedings of the 11th International Conference on Web Information Systems and Technologies (WEBIST-2015), pages 455-465
ISBN: 978-989-758-106-9
Copyright
c
2015 SCITEPRESS (Science and Technology Publications, Lda.)

ing the users with questionnaires, provides recom-
mendations and decision support facilities for tourist
users. In the proposed system, we use recommenda-
tion generated from users’ profiles both to filter the
POI to visualize and in order to help the user in the
creation of a personalized itinerary. However, in this
domain, it is difficult to extract explicit signals from
the users about their interests. Typically tourists in-
teract with the system only in preparation (or during)
the trip, while user profiling techniques depend on in-
depth analysis of users’ traveling behavior and pref-
erences. In the proposed system, we chose to use
social networks as external sources for constructing
user profiles on the basis of detailed observations of
users’ interaction on the social network. Recent stud-
ies have shown that, by using data drawn from social
networks, it is possible to improve the quality of a
recommendation system (Guy et al., 2009; Said et al.,
2010) while obtaining useful indirect information to
profile occasional users.
Moreover, one of the main features in the plan-
ning of a city tour is the simultaneous presence of
multiple users, usually aggregated in small groups
(e.g., families or groups of friends), each with her/his
own preferences and inclinations, which rarely want
to separate or isolate themselves during the journey.
In touristic application domains, group profiles have
been taken into account (Souffriau and Vansteenwe-
gen, 2010), however mainly as an optimization prob-
lem among POI. Moreover, in Ardissono et al. (2003)
intra-group relationships, such as children and the
disabled were contemplated, while McCarthy et al.
(2006), and Jameson (2004) provided mechanisms to
help groups in deciding common attributes and fea-
tures for their holidays. Approaches that deal with
small groups within museums focus on content per-
sonalization and on the possibility to enhance the
group interaction during and after the visit (Kuflik
et al., 2011), and assume a free navigation of each
user within the museum space. On the contrary, out-
door planning of a city tour has to take into account
that the group (not a single tourist) jointly selects the
activities to perform together in order to maximize
the group satisfaction. Here, we describe how to ob-
tain an automatic analysis of group relationships us-
ing the same social network to provide a POI filtering
technique that can work also for groups. In particu-
lar, we are interested in the analysis of the behavior
of small close groups (as a representation of people
that spend vacation time together) and in the defini-
tion of an automatically obtained measure of domi-
nance. This analysis may help an automatic system in
the merge of the different preferences the users may
have, simulating somehow a decision process similar
Figure 1: Map View of the Web Portal.
to a natural interaction.
To show the feasibility of our approach, we con-
ducted a pilot study with real users in a trip planning
activity in the city of Naples in order to gather useful
information on social network vs. face-to-face inter-
actions.
2 A WEB PORTAL FOR SMART
TOURISM
A Touristic Web Portal can be considered a window
on a city for tourists and citizens. It gathers the refer-
ences to different kinds of information about the city:
touristic places, restaurants, accommodations, local
transports (buses, taxi, car sharing, bike sharing, etc.),
events, thematic layers (like the map of movies scenes
filmed in the city or the map of the best dishes) and so
on. Indeed, the main goal of our developed portal is
to provide all the information that the user needs in a
single interface. The user can show all these POI on a
map and she/he can select the POI she/he prefers.
By providing all the necessary information in one
single portal, the user is free to decide her/his pre-
ferred items/activities without the need of consulting
different information sources. However, this kind of
interface introduces the typical information overload
problem: too much information to show and to man-
age. Hence, we introduced two approaches to facili-
tate user navigation inside the Web Portal: the com-
mon possibility of browsing POI through categories
and sub-category, and an automatic filtering based on
the user profile. With the first approach, the user can
filter every kind of POI by selecting a category and
WEBIST2015-11thInternationalConferenceonWebInformationSystemsandTechnologies
456

applying filters (e.g., she/he can show all three stars
hotels), and then save all the POI she/he prefers in
a favorites list. Preferred POI are shown on a prede-
fined layer called “Favorites/Recomm” (see Figure 1).
Simultaneously, by applying a filtering approach, all
the information is automatically ordered and filtered
according to the user profile (see Section 2.1): if the
user do not use categories, not all the POI are shown
(since they may be hundreds), but only those that are
appropriate for that user profile. Hence, it is very im-
portant, for a smart tourist system, to include an auto-
matic user profiling mechanism that, without intrud-
ing the user with questionnaires, learns her/his pref-
erences and uses a Recommendation System to pro-
vide recommendations for the selection of preferred
POI, the creation of a personalized itinerary, or sim-
ply to facilitate the navigation among the information.
Obviously, during the city tour, the tourist is able to
consult, any time, all the information contained on
the portal and her/his preferred ones through her/his
smart-phone or computer. In Figure 1, the map view
of portal is showed.
2.1 User Profiling
Generally speaking, the aim of a Recommendation
System (RS) is to predict the relevance and the impor-
tance of items that the user never evaluated. A RS can
be used both to proactively propose new items to the
user, and to filter irrelevant items on a list, in order to
only show the items considered the more interesting
for the user (e.g., to select the k-best items, as in our
case). In fact, in our system, we use recommendation
both to filter the POI to visualize and in order to help
the user in the creation of a personalized itinerary.
In formal terms, given a user u
i
and a set of m
POI P = {p
1
, . . . , p
m
}, the recommendation system,
for each user i, aims at building a Preference Profile or
a ranking R
i
of the user i over P. Such preference pro-
file is the set R
i
= {r
i,1
, . . . , r
i,m
}, with r
i,x
∈ R, which
represents a partial order over P. Our goal is not to
guess the exact value of r
i, j
the user i would assign to
the item j, but to properly select the k-best items in
the preference profile (the ones with the highest rat-
ing). The set P is finite and constitute all the possible
items to recommend within a spatial region and for a
specific class of objects (e.g., tourist POI, restaurants,
recreational activities and so on), and it does not de-
pend on a specific user.
The most common approach used in RSs to gen-
erate a user preference profile is based on Collabo-
rative Filtering techniques (Ricci et al., 2011). This
approach suggests items to the user (or defines a rat-
ing for an item) by taking into account the prefer-
ences of similar users; this similarity is evaluated by
considering the common items that they rated. How-
ever, this kind of technique suffers from two prob-
lems: cold − start and sparsity. The cold-start prob-
lem concerns the issue that the system, at the begin-
ning, has not yet sufficient information about a user,
because she/he rated too few items; so, it cannot prop-
erly evaluate the similarity between users. The spar-
sity problem regards especially systems where the set
of items is extremely large. In fact, in this case, most
of the users only rated a small subset of the overall.
Many studies dealt with these two problems: for ex-
ample, in Yildirim and Krishnamoorthy (2008) and
Huang and Gong (2008) the Authors propose some
approaches to alleviate the sparsity problem, while in
Sahebi and Cohen (2011) and Rashid et al. (2008) the
Authors suggest methods to solve the cold-start prob-
lem.
In our system, like in Shapira et al. (2013), we
choose to use social networks as external sources to
obtain users’ information and to overcome the above–
mentioned problems. In detail, we use the most pop-
ular social networks: Facebook.com, which is an on-
line social network with 1.317 billion monthly active
users and that stores more than 300 petabytes of user
data. Recent studies, Guy et al. (2009) and Said et al.
(2010), have shown that, by using data drawn from so-
cial networks, it is possible to improve the quality of
a RS. In our system, like in Shapira et al. (2013), we
extract users’ preferences from the contents that they
published, in order to derive their preferences. The
aim of this approach is to examine all cross-domain
information, from a user profile, to obtain, then, a
recommendation in a specific domain (e.g., touristic
preferences). Note that a typical RS approach, with
a social network connection, is to gather useful infor-
mation on a specific user directly from her/his peers.
However, we did not choose this kind of approach
also taking in account that, with the newest version
of Facebook API, we cannot consider the links be-
tween all users’ friends, because it is possible only
to obtain the list of a person’s friends which are also
using the specific application and not of all of them.
Instead, with this technique, we compare user prefer-
ences with all other users of the system and not with
her/his personal friends.
In detail, our method, analyzing user’s likes, tags,
check-in and photos on Facebook.com, collects data
from users’ profile in every possible domains (age,
education level, music, movies, check-in places, etc.)
and uses them to evaluate the similarity between the
current user and other users of the system. To evaluate
such similarity, we do not consider only the specific
items that are liked by user (e.g. the Rolling Stones’
UserandGroupProfilinginTouristicWebPortalsThroughSocialNetworksAnalysis
457
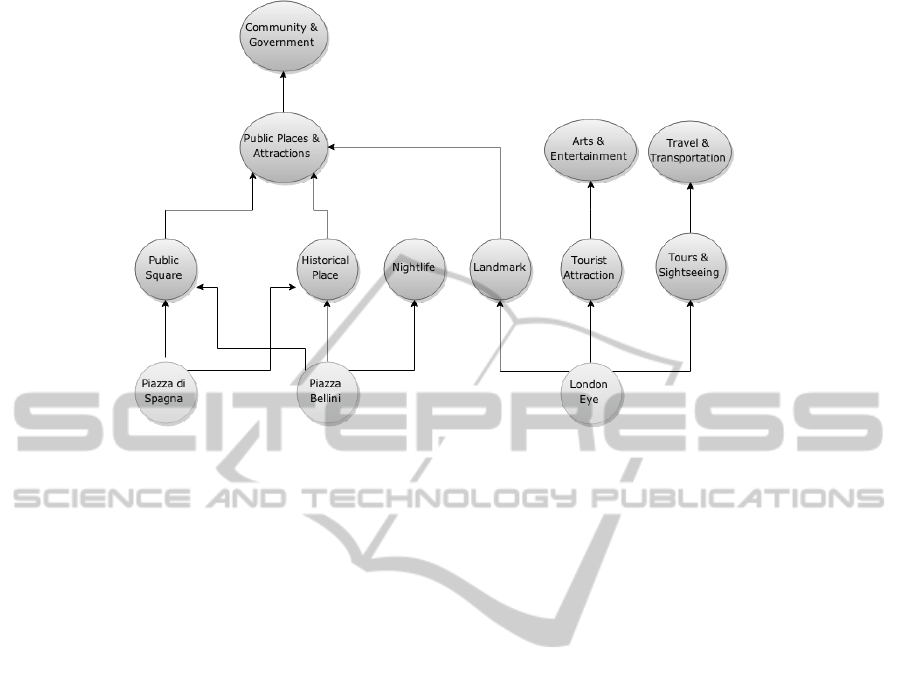
Figure 2: An example of categories organization.
page or a check-in at Colosseum), but we evaluate
their category (e.g. musician, rock band, history mu-
seum, Chinese restaurant, etc.); indeed the rate of a
like on an item is propagated to its parent category
and then to all its hierarchy. In this procedure, like
in Lee and Chung (2011), we use the logarithm to
lessen the rate propagated to the parents. This kind
of approach is essential because of the sparsity of the
possible items, and so, we analyze the user’s generic
cross domain categories preferences to evaluate the
user similarity. To evaluate this kind of similarity, we
use an approach similar to Lee and Chung (2011),
where authors propose a user similarity calculation
based on a location category hierarchy extracted from
the social network Foursquare. In our case, we build
a category hierarchy graph that reproduces the hier-
archy of categories of Facebook items in all kinds
of domains (pages that user likes, locations, artists,
movies, etc.); therefore the obtained graph consists
of two kinds of nodes: specific nodes (that represent
unique and specific items) and category nodes (that
represent the specific categories of items or categories
in a generic level of the hierarchy). An example of
facebook categories organization in showed in Fig-
ure 2. Like in Lee and Chung (2011), we first cal-
culate a score on specific nodes, but whereas in Lee
and Chung (2011) the authors use the number of visit
on a location, in our case a score of a node can repre-
sents both a like on a page and a check-in in a specific
place. Later we propagate the score from the specific
nodes to category nodes using a propagation rate and
then calculate the similarity like in Lee and Chung
(2011).
Finally, the prediction of the preference of items
in our specific domain (cultural sites and other POI of
the city) is obtained using the explicit ratings or saved
itineraries produced on the Web Portal by the most
similar users.
3 GROUP RECOMMENDATION
In the previous section, we described how the pro-
posed system provides recommendations for a sin-
gle user, retrieving information about her/his inter-
ests from the Online Social Network (OSN) Face-
book.com and using them to determine POI that can
be of interest for the user. However, people usually
organize travel in groups, and the group’s members
jointly select the activities to perform and the POI to
visit on the basis of their personal preferences and the
needs of each group’s member. Hence, our system
must provide support to this group decision making
process, by implementing a group recommendation
system.
The problem of providing recommendation to
groups has been widely analyzed in recent years. The
diversity and dynamics of inter-group relationships
make it a very challenging problem (Gartrell et al.,
2010), and it is widely recognized that one of the
main issues to take into account in the design and im-
plementation of these systems is the type of control
over the group decision-making process (Jelassi and
Foroughi, 1989). Hence, Recommendation systems
for groups need to capture both preferences of the
group members but also key factors in the group de-
WEBIST2015-11thInternationalConferenceonWebInformationSystemsandTechnologies
458

cision process (Gartrell et al., 2010). For example, in
some cases, the group’s members may find an agree-
ment following a democratic process, but, in the most
cases, group’s members have different influences on
the others, and there are key persons, a human leader
for example, that have more influence in the final de-
cision. Real small group interactions take into ac-
count intra-group roles and influence hierarchies, and
the implemented system must take into account these
social dynamics.
Generally, there are two possible approaches used
to design a group recommendation system. The first
uses the users’ profiles (one for each of the group’s
member) and it merges them in order to obtain a sin-
gle profile for the whole group. Then, it uses a single
user recommendation system on this profile to find the
recommendations for the group. The second approach
firstly uses a single user recommendation system on
each user’s profile, determining recommendations for
all group’s members, and then it merges these recom-
mendations using some group decision strategy. For
our specific context we need to have the maximum
flexibility in the group formation, and the identity of
the group members has to be dynamically determined
since the actual members of a group can be estab-
lished only according to the activity to perform. For
these motivations, we decide to use the second ap-
proach. In this way, single user’s profiles and rec-
ommendations are built independently from the group
membership. This allows system to dynamically ac-
count for group relationships at the time of provid-
ing the group recommendations because the users’
recommendations are merged only once the group is
formed. Besides, during the process of aggregation of
user’s preferences, we can estimate the importance of
each user with respect to the other group’s members
and determine a sort of dominance value for each user.
This value is then used as weight in the aggregation
process.
In the following sections, the evaluation of such
dominance value is detailed (see Section 3.2), and
subsequently the aggregation functions used by the
system is defined (see Section 3.3).
3.1 Tie Strength and Online Social
Networks
According to social scientists (Marsden and Camp-
bell, 1984; Nelson, 1989; Granovetter, 1973), social
strength, or tie strength, can generally be said to be a
metaphor that quantifies relationships between peo-
ple. Peter et al., addressed the problem of mea-
suring social strength by using multiple dimensions
such as closeness and duration (Marsden and Camp-
bell, 1984). Gilbert and Karahalios (2009) defined
seven dimensions for predicting social strength: in-
tensity, duration, intimacy, reciprocal services, struc-
tural, emotional support, and social distances. These
seven dimensions have been applied for predicting re-
lationship tiers as being either strong or weak, mainly
by using manual efforts.
To understand users’ relationships and roles in-
side a group, the analysis of interactions in OSNs
among the group’s members can be used. In de-
tail, this kind of analysis can be considered a useful
way to obtain (without intruding the users with ques-
tionnaires, but simply observing their communication
habits and frequency) information about these social
relationships and activities among the group of visi-
tors that can be used in helping to take decisions. The
attempt to infer meaningful relationships from social
networks connectivity is often criticized from sociol-
ogy researchers (Wilson et al., 2009); however, anal-
ysis of the interaction graphs in controlled situations
(small and close groups) may provide useful insight.
The analysis of relationship through social net-
works is a complex activity that requires a deep anal-
ysis of the individual profiles and the types of interac-
tion between members of a group. Social Network
Analysis evaluates the relationships and flows be-
tween people, organizations, groups, etc., organized
in graphs. In the most cases, these entities are mapped
into the nodes of a graph in which the edges show re-
lationships. By analyzing these graphs it is possible to
identify the location of actors and extract the various
groupings and roles. Many mathematical techniques,
inherited from graph theory, are available to evaluate
this kinds of networks. The most common approaches
involve a cluster computation, with the identification
of the dominant central cluster and the periphery clus-
ters, and the classification of the different kinds of
nodes (hubs, bridges, isolates, etc.). Several central-
ity measures exist in literature, the most recurring are
those formalized in Freeman (1979), that are degree
centrality, closeness centrality and betweenness cen-
trality. However, the basic definitions of these mea-
sures are only designed for binary network and are
based on unweighted and undirected graphs. Hence,
many social networks analysis approaches assume bi-
nary and symmetric relationships of equal value be-
tween all directly connected users, while, in reality, an
individual has relationships of varying quality (Banks
and Wu, 2009).
In order to provide effective group recommen-
dation on our web portal, we evaluate not only the
strength, but also the “direction” of a specific rela-
tionship, defining a “function” that does not use se-
mantic textual features. Our aim is to use the strength
UserandGroupProfilinginTouristicWebPortalsThroughSocialNetworksAnalysis
459

of such directional ties to define a measure of dom-
inance/popularity for each member of the group that
could be used as a weight of each user in the decision
process. Moreover, social networks analysis may lead
to a misinterpretation on popularity as dominance that
sometimes are high correlated, but sometimes they are
not. It was shown that cohesiveness of a group de-
termines the correlation between these two concepts
(Theodorson, 1957). Hence, the cohesiveness of a
group is a requirement for providing help in the de-
cision process. In a close group, users’ self-needs can
be sacrificed for the wellness of the whole group.
3.2 A Dominance Evaluation
There are a number of attempts to generalize the node
centrality measures to weighted networks. For ex-
ample, Newman (2004) maps a weighted network to
an unweighted multigraph and adapts standard tech-
niques for unweighted graph to these multigraph. Op-
sahl et al. (2010), instead, proposes a generalization
that combines tie weights and number of ties, consid-
ering also the case of direct networks.
Here, to compute the users’ centrality, we use a
variation of the famous PageRank algorithm (Brin and
Page, 1998), used by the Authors to rank web pages,
firstly introduced in Caso and Rossi (2014). We fol-
lowed this choice for creating a simple, but effec-
tive, algorithm, with the aim of evaluating the rank
of a person, interpreted as its indirect rank in a group
of people, and of obtaining a value that can be con-
sidered an index of popularity in a small group of
friends. It should be recalled that the two concepts of
popularity and dominance are correlated in small and
close groups (Theodorson, 1957). A similar approach
was used in Heidemann et al. (2010), where the au-
thors use a modified version of PageRank to define
a new centrality measure. While the original PageR-
ank formula of Brin and Page is based on directed
and unweighted graphs, the version proposed in Hei-
demann et al. (2010) is adapted for the undirected and
weighted graphs. Instead, in this work, we present an-
other variant that uses directed and weighted graphs.
In our opinion, both the degree of activity of a person
and the direction of specific communication activities
are essential to obtain information about the social re-
lationships among members of a group.
Our ranking function is defined as follows:
R(x) =
1 − d
|F|
+ d
∑
i∈F
w(i, x)
w(i)
R(i) (1)
where, |F| is the total number of friends in the
group and d (with 0 ≤ d ≤ 1) is a dampening fac-
tor set to 0.85 (this value is often considered the de-
fault value for PageRank calculations (Langville and
Meyer, 2004)). In the second part of Equation 1, the
user x inherits a portion of popularity from the other
i group’s members. In detail, this proportion is cal-
culated by considering both the i-th friend’s popular-
ity and the weight of the communication activity of
the i-th friend towards the user x (w(i,x)), normalized
with respect to the total communication activity of the
i-th friend with all the members of the group (w(i)).
The rationale of this choice is that the frequency of di-
rected communication (or interaction) from the user i
towards the user x is an index of the strengths of the
directed tie i-x (which can have a different value with
respect to the tie x-i, and, hence, have a different im-
pact on the evaluation of the x’s popularity within the
group).
Such weights are calculated by considering some
of the communication activities between couple of
users on the OSN Facebook.com, collecting a com-
bination of data arising from Gilbert and Karahalios
(2009). Referring to the activity graph of friends’ re-
lationship, w(i, x) evaluate the edges from the user i to
the user x, which represent an activity with i as source
and x as receiver. In detail, regarding the ONS face-
book.com, the considered activities are:
• 1 basic activity derived from the existence of the
friend’s relationship between i and x;
• #F(i, x) is the number of feeds (posts and links)
published on the wall of the user x by the user i;
• #F
c
(i, x) is the number of comments from the user
i on feeds published by the user x;
• #F
l
(i, x) is the number of likes from the user i on
the posts published by the user x;
• #F
t
(i, x) is the number of tags of user x inserted by
i;
• #P
c
(i, x) is the number of comments from the user
i on photos published by the user x;
• #P
l
(i, x) is the number of likes from the user i on
photos published by the user x;
• #P
t
(i, x) is the number of tags of user x inserted by
i on photos.
Hence,
w(i, x) = 1 + #F(i, x) + #F
c
(i, x) +#F
l
(i, x)+ (2)
+#F
t
(i, x) +#P
c
(i, x) +#P
l
(i, x) +#P
t
(i, x)
The obtained w(i, x) value is normalized with
w(i), that can be calculated with the same type of data
of the user i, but with respect to the relationships with
all users of the group and not only with the user x:
WEBIST2015-11thInternationalConferenceonWebInformationSystemsandTechnologies
460

Figure 3: Interface for Group Recommendation.
w(i) =
∑
j∈F
w(i, j) (3)
Note that the friend’s contribution is normalized
with respect to its global activity on the whole group
(as in PageRank). However, PageRank assumed that
there is only a single link between two pages x and i,
hence, web page i contributes equally to the centrality
of all web pages it points to, while, here, we repre-
sent the weight of the directed connection from i to x
determining the level of one-side communication.
Like the classic PageRank, the Equation 1 iterates
until the values will converge.
3.3 A Weighted Aggregation of
Preferences
Figure 3 shows the portal section that support users in
the selection of the group. Initially, when user con-
nects to the portal, her/his profile is used to show, on
the map, POI that can interest her/him. Furthermore
the user can select a set of friends, and the system uses
the Group Recommendation function to suggest POI
for the whole group.
As stated above, the dominance measure, as de-
fined in Equation 3, can be used used as a weight
in the process of merging single user’s recommen-
dations. In this way, we give an importance to the
recommendation of a user proportional to her/his in-
fluence/dominance on the others in the group.
Figure 4 shows the architecture of our recommen-
dation system; single users’ profiles are used to ob-
tain the single recommendations, and the informa-
tion about the interactions on the social network are
used to compute the Popularity (Dominance) rank-
ings. Both these information are used from the Group
Recommendation System to provide the final choices
for the whole group.
Figure 4: System Architecture for Single User and Group
Recommendation.
To evaluate the group r
F
(x) rating for the POI x we
use the following strategy, introduced in Barile et al.
(2014):
r
avg,x
=
1
n
n
∑
i=1
(R(i) · r
i,x
) (4)
where, n is the number of users in the group, R(i)
is the dominance value of user i, calculated as defined
in Equation 1. Hence, Equation 4 is a function that
evaluates the average of all the i users rankings r
i,x
of
the item x, weighted by the i-th dominance value R(i).
The set
avg
= {r
avg,1
, . . . , r
avg,m
}, which is the set
of group’s rankings computed for each item, is then
used to get the final decision: the first k activities
x (with k equals to the number of activities to pro-
pose) with the highest r
avg,x
values are selected for
the recommendation. Moreover, in order to evaluate
our function, we also implemented the standard ver-
sion of a simple averaging function (r
st.avg,x
) on the
same data:
r
st.avg,x
=
1
n
n
∑
i=1
r
i,x
(5)
4 A PILOT STUDY
We conducted a pilot study with groups of real users.
Each group was asked to plan a trip in the city of
Naples in order to gather useful information on social
network relationships vs. face-to-face interactions.
Actors. In this study, we involved 14 groups com-
posed, in the average, of 3.4 people. The number of
the total users that took part in the experimentation
UserandGroupProfilinginTouristicWebPortalsThroughSocialNetworksAnalysis
461

Table 1: Facebook analyzed data.
Total
Average
Feeds Feed Comm Feed Likes Feed Tags Photo Comm Photo Likes Photo Tags
414720 391320 763440 266040 343800 639600 955680
29623 27951 54531 19003 24557 45686 68263
Figure 5: A four people group taking the final decision.
was 46 (26 male and 20 female). The average age
was 27.3 with a graduate education. During the re-
cruitment process, in the half of the groups, all the
members of each group were directly contacted by
us and involved in the experiment; in the other cases,
we asked a single person to create a group and to ex-
plain the rules of the experiments to the other mem-
bers. Hence, in this second case, this specific person
acted as a mediator in the recruitment process. Users
were ranked, within a group, according to their re-
spective dominance values according to Equation 1.
All the analyzed data (feeds, photos, comments, tags
and likes) from f acebook.com are summarized in Ta-
ble 1, where we reported the total number of analyzed
data and the average value for each group.
Procedure. Each person was asked to register on
the website using her/his own credentials; once regis-
tered, they were asked to imagine to plan a one-day
visit to the city. In detail, they were asked to se-
lect from ten items, shown on our website, only three
activities (e.g., places to visit) for the day, and one
restaurant for lunch and one for dinner (from a check
list of eight). Since we do not want the user to be in-
volved in strategic reasoning, we did not ask the users
to express ratings and preferences among the selected
choices. The group was, then, asked to discuss, face-
to-face, in order to obtain a shared and unique deci-
sion for the entire group (which represents the groups’
ground truth r
GT
). Figure 5 shows a group while dis-
cussing the final choices with the support of a per-
sonal computer.
Figure 6: A screen-shot of the results of the experiment with
one group.
Table 2: Cumulative results in the pilot study.
% Similarity
Average
Dominant Average Mediator
61 ± 17 59 ± 11 63 ± 13
Results. Figure 6 shows a summary of the results
of a single experiment; in detail, we reported the
single users’ selections, the analyzed facebook data
number, the selection obtained from the group mem-
bers’ discussion r
GT
, the similarity evaluation be-
tween the user with the higher dominance value (dom-
inant user) and r
GT
, and the similarity between the de-
cision obtained using the weighted average function
and r
GT
. In both cases, the similarity is calculated
simply counting the number of common choices be-
tween the two selections. In detail, in the experiment
reported in Figure 6, we have a 3 people group with
an 80% of similarity with the dominant user, which is
the user with R(i) = 0.42.
Table 2 summarizes the cumulative data of all
groups involved in the experiment. For each group,
the following data are calculated: the similarity per-
centage between the choices of the dominant and
r
GT
(Dominant); the similarity percentage between
the choices of the mediator (if applicable) and r
GT
(Mediator); the similarities average percentage of the
choices of each users in a group and r
GT
(Average).
From the amount of analyzed interactions, with a
very high standard deviation, we can conclude that
the groups’ behaviors on the OSN were very different
and with a good value of cohesion (Average = 59%).
Considering the aggregated data, the average similar-
ity value of the dominant user choices (Dominant) is
WEBIST2015-11thInternationalConferenceonWebInformationSystemsandTechnologies
462

Table 3: Results with and without mediation.
% Sim
Avg
with Med without Med Low STD
53 ± 15 73 ± 10 75 ± 10
Table 4: Similairty results with and withoud dominance
weights.
% Similarity
Average
r
st.avg
r
avg
64 ± 16 74 ± 12
on average 61%, which is comparable with the Aver-
age similarity, and the Mediator similarity (63%) with
the final decision of the Group r
GT
.
Apart from the aggregated data that shows similar
results on the average, what is interesting, from our
point of view, is to compare the behavior of groups
with a mediator with groups without this specific role.
Table 3 summarizes the results of this analysis. We
observed that in the case of a member of the group
acting as mediator the similarity of the group decision
w.r.t. the dominant user was on average 53% (with
Mediator); instead, in the second case, the similarity
with the dominant user was, on average, equal to 73%
(without Mediator). In our opinion these values sup-
port our choice to use a ranking function (as defined in
Equation 1) to differently weight the most dominant
users in the group consensus functions. The p-value,
calculated on these two sets, is 0.0058, which means
that such difference is not due to the case.
Finally, we analyzed the standard deviation of the
dominance values (according to Equation 1) and sub-
divided the groups without a mediator in two sets
(with low and high standard deviation). Surprisingly,
the groups with low standard deviation, which can
also be interpreted as a measure of cohesion and sim-
ilarity in the behaviors of the group members on the
social network, showed a similarity of the dominant
user choices with the group final decision of 75%
(with Low STD). However, what we want to highlight
is that it is not the dominance value per se to be of
importance in the group decision making process (re-
call that such values are normalized in order to sum
to one), but the relative user ordering. Moreover, the
case of users with approximately the same behavior
on the social network (e.g., with similar dominance
values), in accordance with Theodorson (1957), bet-
ter identify close group in which popularity is con-
nected with dominance. Hence, we can infer that, in
case there is not a mediator, the dominance evalua-
tion got a much more important role in the consensus
making, especially in close groups where the popu-
larity index, we evaluated, better identifies a possible
dominant user.
Finally, the similarity of the proposed weighted
version of the average satisfaction function (r
avg
) with
respect to the groups’ ground truth (r
GT
) was eval-
uated. Such similarity is computed as a percentage
of the r
avg
choices that were already selected in the
group final choices r
GT
. We also evaluated the simi-
larity of the groups’ ground truth with respect to the
standard implementation of such function (i.e., r
st.avg
as a typical averaging function on users’ choices).
Aggregated results are reported in Table 4. With re-
spect to their standard implementation, the function
that takes into account social relationships perform
slightly better (74% w.r.t. 64%). The r
avg
consen-
sus function often guesses 4 on 5 activities. The dif-
ference among the obtained results was evaluated as
statistically significant using a t-test (p < .05, t = 3.6,
d f = 13).
5 CONCLUSION AND FUTURE
WORKS
In this paper, we presented our general framework for
a profiling mechanism and a recommendation system
that works both for single users and groups of tourists.
The aim of the proposed system is to filter the avail-
able choices to display on a web portal and to sim-
plify the users’ decision–making process, in a touris-
tic tour planning, by obtaining their preferences and
social roles from the social network facebook.com.
In detail since the interactions of an occasional
user with the touristic web portal can be very few, the
activity of the same user on a social network can be
used to evaluate users similarity on a cross domain
context. The evaluation of the proposed single user
profiling mechanism will be conducted as a future
work, when the official project testing will start and
data of single users will be collected.
Moreover, we were interested in the role of cohe-
sion, dominance and mediation for reaching a consen-
sus in the case of group of users. We showed that it is
possible to derive a simple model of user dominance,
through intra-group ranking, obtained from the anal-
ysis of the interaction on the social network, and such
a role is fundamental in the absence of a mediator. In
detail, we started using this measure of user’s domi-
nance in order to rank the users by their influence and
to weight the ratings provided by them. Our long–
term goal is to use this measure of user’s dominance
in the definition of different and customizable aggre-
gation functions.
Finally, we presented a pilot study where we used
a small number of alternatives for planning only a sin-
gle day in a delimited neighborhood of a city. The
scalability of our results, increasing the number of
UserandGroupProfilinginTouristicWebPortalsThroughSocialNetworksAnalysis
463

choices with more complex real settings, have to be
deeply analyzed, including also the possibility to ex-
press an explicit ranking on the selected choices. Fi-
nally, we limited our groups to people that did not
have any hierarchical relationships among them (e.g.,
they were mainly friends), while also social intra-
group roles have to be taken into account.
ACKNOWLEDGEMENT
The research leading to these results has received
funding from the Italian Ministry of University and
Research and EU under the PON OR.C.HE.S.T.R.A.
project (ORganization of Cultural HEritage for Smart
Tourism and Real-time Accessibility).
REFERENCES
Ardissono, L., Goy, A., Petrone, G., Segnan, M., and
Torasso, P. (2003). Intrigue: Personalized recommen-
dation of tourist attractions for desktop and handset
devices. Applied Artificial Intelligence, 17(8):687–
714.
Banks, L. and Wu, S. (2009). All friends are not created
equal: An interaction intensity based approach to pri-
vacy in online social networks. In International Con-
ference on Computational Science and Engineering.,
volume 4, pages 970–974.
Barile, F., Caso, A., and Rossi, S. (2014). Group rec-
ommendation for smart applications: a multi-agent
view of the problem. In Proceedings of the XV Work-
shop Dagli Oggetti agli Agenti, volume 1260 of CEUR
Workshop Proceedings. CEUR-WS.org.
Brin, S. and Page, L. (1998). The anatomy of a large-scale
hypertextual web search engine. Computer Networks
and {ISDN} Systems, 30(17):107 – 117. Proceedings
of the Seventh International World Wide Web Confer-
ence.
Caso, A. and Rossi, S. (2014). Users ranking in on-
line social networks to support poi selection in small
groups. In Posters, Demos, Late-breaking Results
and Workshop Proceedings of the 22nd Conference on
User Modeling, Adaptation, and Personalization co-
located with the 22nd Conference on User Modeling,
Adaptation, and Personalization (UMAP2014)., vol-
ume 1181 of CEUR Workshop Proceedings. CEUR-
WS.org.
Freeman, L. C. (19781979). Centrality in social networks
conceptual clarification. Social Networks, 1(3):215 –
239.
Gartrell, M., Xing, X., Lv, Q., Beach, A., Han, R., Mishra,
S., and Seada, K. (2010). Enhancing group recom-
mendation by incorporating social relationship inter-
actions. In Proceedings of the 16th ACM International
Conference on Supporting Group Work, GROUP ’10,
pages 97–106. ACM.
Gilbert, E. and Karahalios, K. (2009). Predicting tie
strength with social media. In Proceedings of the
SIGCHI Conference on Human Factors in Comput-
ing Systems, CHI ’09, pages 211–220, New York, NY,
USA. ACM.
Granovetter, M. S. (1973). The strength of weak ties. Amer-
ican journal of sociology, 78(6):1360–1380.
Guy, I., Zwerdling, N., Carmel, D., Ronen, I., Uziel, E.,
Yogev, S., and Ofek-Koifman, S. (2009). Personalized
recommendation of social software items based on so-
cial relations. In Proceedings of the third ACM confer-
ence on Recommender systems, pages 53–60. ACM.
Heidemann, J., Klier, M., and Probst, F. (2010). Identify-
ing key users in online social networks: A pagerank
based approach. In Proc. of the Int. Conf. on Informa-
tion Systems, ICIS 2010, pages 1–22. Association for
Information Systems.
Huang, C.-B. and Gong, S.-J. (2008). Employing rough set
theory to alleviate the sparsity issue in recommender
system. In In International Conference on Machine
Learning and Cybernetics, volume 3, pages 1610–
1614. IEEE.
Jameson, A. (2004). More than the sum of its members:
Challenges for group recommender systems. In Pro-
ceedings of the Working Conference on Advanced Vi-
sual Interfaces, AVI ’04, pages 48–54. ACM.
Jelassi, M. T. and Foroughi, A. (1989). Negotiation support
systems: an overview of design issues and existing
software. Decision Support Systems, 5(2):167 – 181.
Kuflik, T., Stock, O., Zancanaro, M., Gorfinkel, A., Jbara,
S., Kats, S., Sheidin, J., and Kashtan, N. (2011). A vis-
itor’s guide in an active museum: Presentations, com-
munications, and reflection. J. Comput. Cult. Herit.,
3(3):1–25.
Langville, A. N. and Meyer, C. D. (2004). Deeper inside
pagerank. Internet Mathematics, 1:335–380.
Lee, M.-J. and Chung, C.-W. (2011). A user similarity cal-
culation based on the location for social network ser-
vices. In Database Systems for Advanced Applica-
tions, volume 6587 of LNCS, pages 38–52. Springer.
Marsden, P. V. and Campbell, K. E. (1984). Measuring tie
strength. Social forces, 63(2):482–501.
McCarthy, K., McGinty, L., Smyth, B., and Salam, M.
(2006). The needs of the many: A case-based group
recommender system. In Advances in Case-Based
Reasoning, volume 4106 of LNCS, pages 196–210.
Springer.
Nelson, R. E. (1989). The strength of strong ties: So-
cial networks and intergroup conflict in organizations.
Academy of Management Journal, 32(2):377–401.
Newman, M. E. J. (2004). Analysis of weighted networks.
Phys. Rev. E, 70.
Opsahl, T., Agneessens, F., and Skvoretz, J. (2010). Node
centrality in weighted networks: Generalizing degree
and shortest paths. Social Networks, 32(3):245 – 251.
Rashid, A. M., Karypis, G., and Riedl, J. (2008). Learning
preferences of new users in recommender systems: an
information theoretic approach. ACM SIGKDD Ex-
plorations Newsletter, 10(2):90–100.
WEBIST2015-11thInternationalConferenceonWebInformationSystemsandTechnologies
464

Ricci, F., Rokach, L., and Shapira, B. (2011). Introduction
to recommender systems handbook. Springer.
Sahebi, S. and Cohen, W. W. (2011). Community-based
recommendations: a solution to the cold start prob-
lem. In Workshop on Recommender Systems and the
Social Web, RSWEB.
Said, A., De Luca, E. W., and Albayrak, S. (2010). How
social relationships affect user similarities. In Proc. of
the 2010 Workshop on Social Recommender Systems,
pages 1–4.
Shapira, B., Rokach, L., and Freilikhman, S. (2013). Face-
book single and cross domain data for recommenda-
tion systems. User Modeling and User-Adapted Inter-
action, 23(2-3):211–247.
Souffriau, W. and Vansteenwegen, P. (2010). Tourist trip
planning functionalities: Stateoftheart and future. In
Current Trends in Web Engineering, volume 6385 of
LNCS, pages 474–485. Springer Berlin Heidelberg.
Theodorson, G. A. (1957). The relationship between lead-
ership and popularity roles in small groups. American
Sociological Review, 22(1):pp. 58–67.
Wilson, C., Boe, B., Sala, A., Puttaswamy, K. P., and Zhao,
B. Y. (2009). User interactions in social networks and
their implications. In Proceedings of the 4th ACM
European Conference on Computer Systems, EuroSys
’09, pages 205–218. ACM.
Yildirim, H. and Krishnamoorthy, M. S. (2008). A random
walk method for alleviating the sparsity problem in
collaborative filtering. In Proceedings of the 2008
ACM conference on Recommender systems, pages
131–138. ACM.
UserandGroupProfilinginTouristicWebPortalsThroughSocialNetworksAnalysis
465
