
Modeling Wine Preferences from Physicochemical Properties using
Fuzzy Techniques
Àngela Nebot
1
, Francisco Mugica
1
and Antoni Escobet
2
1
Soft Computing Research Group, Computer Science Dept., Universitat Politècnica de Catalunya - BarcelonaTech (UPC),
Jordi Girona Salgado 1-3, Barcelona, Spain
2
Soft Computing Research Group, DIPSE Dept., Universitat Politècnica de Catalunya - BarcelonaTech (UPC),
Campus Manresa, Avinguda de les Bases de Manresa, 61-73, 08240 Manresa, Spain
Keywords: Prediction, Wine Science, Fuzzy Inductive Reasoning (FIR), Genetic Fuzzy Systems, MOGUL.
Abstract: Wine classification is a difficult task since taste is the least understood of the human senses. In this research
we propose to use hybrid fuzzy logic techniques to predict human wine test preferences based on
physicochemical properties from wine analyses. Data obtained from Portuguese white wines are used in this
study. The fuzzy inductive reasoning technique achieved promising results, outperforming not only the
other fuzzy approaches studied but also other data mining techniques previously applied to the same dataset,
such are neural networks, support vector machines and multiple regression. Modeling wine preferences may
be useful not only for marketing purposes but also to improve wine production or support the oenologist
wine tasting evaluations.
1 INTRODUCTION
Data mining (DM) techniques aim at extracting
knowledge from raw data. Several DM algorithms
have been developed, each one with its own
advantages and disadvantages (Witten and Frank,
2005).
DM approaches have been applied to a large
variety of problems, either for classification or
regression. An interesting problem that has captured
the attention of several researches is the prediction
of wine quality (Cortez et al., 2009; Yin and Han,
2003).
Wine industry is investing in new technologies
for wine making and selling processes. A key issue
in this context is wine certification which prevents
the illegal adulteration and assures the wine quality.
Wine certification is often assessed by
physicochemical and sensory tests (Ebeler, 1999).
However, the relationships between the
physicochemical and sensory analysis are still not
fully understood (Legin et al., 2003).
That is the reason why DM techniques can be
very valuable to address this problem. The
development of an accurate, computationally
efficient and understandable prediction model can be
of great utility for the wine industry. On the one
hand, a good wine quality prediction can be very
useful in the certification phase, since currently the
sensory analysis is performed by human tasters,
being clearly a subjective approach. An automatic
predictive system can be integrated into a decision
support system, helping the speed and quality of the
oenologist performance. On the other hand, such a
prediction system can also be useful for training
oenology students or for marketing purposes.
Furthermore, a feature selection process can help
to analyze the impact of the analytical tests. If it is
concluded that several input variables are highly
relevant to predict the wine quality, since in the
production process some variables can be controlled,
this information can be used to improve the wine
quality.
In this paper wine taste preferences are modelled
by DM algorithms. In particular four hybrid fuzzy
techniques are proposed in this research. Three of
them are genetic fuzzy systems (GFS), which are
fuzzy systems that identify its structure and/or
parameters by means of genetic algorithms (GA)
and/or genetic programming (GP). The fourth
algorithm is the fuzzy inductive reasoning (FIR), a
hybridization of fuzzy and machine learning
approaches.
501
Nebot À., Mugica F. and Escobet A..
Modeling Wine Preferences from Physicochemical Properties using Fuzzy Techniques.
DOI: 10.5220/0005551905010507
In Proceedings of the 5th International Conference on Simulation and Modeling Methodologies, Technologies and Applications (SIMULTECH-2015),
pages 501-507
ISBN: 978-989-758-120-5
Copyright
c
2015 SCITEPRESS (Science and Technology Publications, Lda.)

All the methodologies are studied in terms of
prediction accuracy as well as in terms of
computational effort. The results obtained by the
hybrid fuzzy techniques proposed are compared with
other DM techniques applied to the same problem in
previous studies (Cortez, 2009).
Section 2 presents the main concepts of the fuzzy
hybrid methodologies used in this research. In
section 3, the wine dataset available and the model
evaluation criteria used are described in detail. The
results are presented in section 4, where a
comparison with other DM methodologies is
performed. A discussion is also included in this
section in terms of results accuracy and
computational time needed for each approach.
Finally, the conclusions are presented in section 5.
2 METHODS
In this section the hybrid fuzzy methodologies
proposed are introduced. We propose hybrid
approaches instead of traditional fuzzy inference
systems since an optimization process is needed in
order to obtain the best fuzzy rules that represent the
behaviour of the system under study.
2.1 Fuzzy Inductive Reasoning (FIR)
The conceptualization of the FIR methodology
arises of the general system problem solving (GSPS)
approach proposed by Klir (Klir and Elias, 2002).
This methodology of modeling and simulation is
able to obtain good qualitative relations between the
variables that compose the system and to infer future
behavior of that system. It has the ability to describe
systems that cannot easily be described by classical
mathematics or statistics, i.e. systems for which the
underlying physical laws are not well understood.
FIR offers a model-based approach to
predicting either univariate or multi-variate time
series (Nebot et al., 2003; Carvajal and Nebot,
1998). A FIR model is a qualitative, non-
parametric, shallow model based on fuzzy logic.
Visual-FIR is a tool based on the FIR
methodology that offers a new perspective to the
modeling and simulation of complex systems.
Visual-FIR designs process blocks that allow the
treatment of the model identification and prediction
phases of FIR methodology in a compact, efficient
and user friendly manner (Escobet et al., 2008).
FIR methodology has two main processes: a
feature selection process, that allow to develop a
model, and the prediction or simulation process, that
uses the model obtained to infer the future behaviour
of the system.
A FIR model consists of its structure (relevant
variables) and a set of input/output relations (history
behavior) that are defined as if-then rules.
Feature selection in FIR is based on the
maximization of the models' forecasting power
quantified by a Shannon entropy-based quality
measure. The Shannon entropy measure is used to
determine the uncertainty associated with
forecasting a particular output state given any legal
input state. The overall entropy of the FIR model
structure studied, H
s,
is computed as described in
equation 1.
()
s
i
i
HpiH
,
(1)
where p(i) is the probability of that input state to
occur and H
i
is the Shannon entropy relative to the
i
th
input state. Then, a normalized overall entropy H
n
is computed, as defined in equation 2.
max
1
s
n
H
H
H
(2)
H
n
is obviously a real-valued number in the range
between 0.0 and 1.0, where higher values indicate an
improved forecasting power. The model structure
with highest H
n
value generates forecasts with the
smallest amount of uncertainty.
Once the most relevant variables are identified,
they are used to derive the set of input/output
relations from the training data set, defined as a set
of if-then rules. This set of rules contains the
behaviour of the system. Using the k-nearest-
neighbours fuzzy inference algorithm the k rules
with the smallest distance measure are selected and a
distance-weighted average of their fuzzy
membership functions is computed and used to
forecast the fuzzy membership function of the
current state, as described in equation 3.
5
1
new j j
out rel out
j
M
emb w Memb
(3)
The weights
j
rel
w
are based on the distances and
are numbers between 0.0 and 1.0. Their sum is
always equal to 1.0. It is therefore possible to
interpret the relative weights as percentages.
For a more detailed explanation of the fuzzy
inductive reasoning methodology refer to (Escobet
et al., 2008).
SIMULTECH2015-5thInternationalConferenceonSimulationandModelingMethodologies,Technologiesand
Applications
502

2.2 Genetic-Fuzzy Systems
A Genetic Fuzzy System (GFS) is basically a fuzzy
system augmented by a learning process based on
evolutionary computation, which includes genetic
algorithms, genetic programming, and evolutionary
strategies, among other evolutionary algorithms
(Cordon et al., 2001). In this study three different
GFS are analyzed, i.e. MOGUL-TSK-R, MOGUL-
IRLHC-R and GFS-GPG-R.
MOGUL algorithms are based on the iterative
rule learning approach, where each chromosome in
the population represents a single fuzzy rule, but
only the best individual is considered to form part of
the final rule base. Therefore, it is run several times
to obtain the complete knowledge base. The
advantage is that it reduces substantially the search
space, because in each iteration only a fuzzy rule is
searched. A postprocessing stage is needed to force
the cooperation among the fuzzy rules generated in
the first stage.
2.2.1 MOGUL-TSK-R
MOGUL is a Methodology to Obtain Genetic fuzzy
rule-based systems Under the iterative rule Learning
approach. This methodology is composed of some
design guidelines that will allow us to obtain genetic
fuzzy rule base systems (GFRBS) to design different
types of fuzzy rule bases, i.e. descriptive and
approximate Mamdani-type and Sugeno-type.
The MOGUL-TSK-R is a MOGUL approach
base in the Sugeno type of rules (Alcalá et al., 2007).
In the first stage it performs a local identification of
prototypes to obtain a set of initial local semantics-
based Sugeno rules. On the other hand the
cooperation between rules is accomplished in the
second stage by means of a genetic niching-based
selection process to remove redundant rules and a
genetic tuning process to refine the fuzzy
parameters.
2.2.2 MOGUL- IRLHC-R
The MOGUL-IRLHC-R algorithm is also an
iterative rule learning approach that uses the
MOGUL paradigm, but in this case the goal is to
learn constrained approximate Mamdani-type
knowledge bases from examples (Cordón and
Herrera, 2001). It consists of three stages: an
evolutionary generation process, a genetic
multisimplification process and a genetic tuning
process. The first stage generates a set of fuzzy rules
with constrained free semantics covering the training
set in an adequate form. The second stage performs
a selection of rules using a binary coded genetic
algorithm with a genotypic sharing function and a
measure of the fuzzy rule base system performance.
The idea is to remove redundant rules while
maximizing the cooperation among the staying rules.
The third stage performs a tuning based on a real
coded genetic algorithm and the previous
performance measure. It adjusts the membership
functions of each rule in each possible fuzzy rule
base derived from the multisimplification process.
Then, the more accurate fuzzy rule based obtained is
the final output of the MOGUL-IRLHC-R
algorithm.
2.2.3 GFS-GPG-R
The GFS-GPG-R algorithm is a genetic fuzzy
system based on genetic programming grammar
operators (Sánchez et al., 2001). It combines genetic
programming operators with simulated annealing
search to solve symbolic regression problems.
The novelty of this approach is that a simulated
annealing-based method is designed for inducting
the crossover and mutation parameters and structure
of a fuzzy classifier. The adjacency operator in
simulated annealing is replaced with a
macromutation taken from tree-shaped genotype
genetic algorithms. The tree-shaped geneotypes
allow representing rule bases more compactly than
liniar representations.
3 METERIALS
3.1 Wine Data
The wine data used in this study comes from the
north-west region, named Minho, of Portugal, and
this dataset is available from the UCI machine
learning repository (UCI, 2015). It has been
proposed for both, regression and classification, by
Cortez et al. (2009). The white variant from the
mentioned demarcated region is analyzed as a
regression problem in this paper. The data were
collected from May 2004 to February 2007. This
dataset is much larger than others available as
benchmarks in the same domain.
The more common physicochemical tests were
measured and are described in Table 1. These 11
properties are the inputs of the models.
Each one of the 4898 wine samples was
evaluated by a minimum of three sensory assessors,
by means of blind tastes, which graded the wine in
ModelingWinePreferencesfromPhysicochemicalPropertiesusingFuzzyTechniques
503

a scale that ranges from 0 to 10, that matches to
very bad to excellent quality, respectively. The
final score is given by the median of these
evaluations, which corresponds to the output
variable. This target variable denotes a typical
normal shape distribution, with minimum and
maximum values of 3 and 9 for the white wine.
Table 1: The physicochemical data (input variables), and
its corresponding statistics. The units are: FA: g(tartaric
acid)/dm
3
; VA: g(acetic acid)/dm
3
; CA: g/dm
3
; RS: g/dm
3
;
CH: g(sodium chloride)/dm
3
; FSD: mg/dm
3
; TSD: mg/dm
3
;
DE: g/dm
3
; SU: g(potassium sulphate)/dm
3
; AL: %vol.
Attribute White wine
Min Max Mean
Fixed acidity (FA) 3.8 14.2 6.9
Volatile acidity (VA) 0.1 1.1 0.3
Citric acid (CA) 0 1.7 0.3
Residual sugar (RS) 0.6 65.8 6.4
Chlorides (CH) 0.01 0.35 0.05
Free sulfur dioxide (FSD) 2 289 35
Total sulfur dioxide (TSD) 9 440 138
Density (DE)
0.987 1.039 0.994
pH 2.7 3.8 3.1
Sulphates (SU) 0.2 1.1 0.5
Alcohol (AL) 8 14.2 10.4
3.2 Model Evaluation
In order to test the generalization performance of the
fuzzy approaches studied in this research we use
cross validation, in this case 5-fold cross validation
(5-CV). The model parameters are derived using the
training subset and errors are computed using the
testing subset. For statistical confidence, the training
and testing processes are repeated 20 times with the
whole dataset randomly permuted in each run prior
to splitting in training and testing subsets.
The regression performance is commonly
measured by an error metric, such as the Mean
Absolute Deviation (MAD), described in equation
4.
∑|
|
/N
(4)
where ŷ
i
is the predicted output, y
i
the system output
and N the number of samples. Notice that the order
of the preferences is relevant, since a model that
predicts 5 when the real grade is 4 is better than a
model that predicts 6.
The regression error characteristic (REC) curve
is used very often to compare regression models,
with the ideal model presenting an area of 1.0. The
curve plots the absolute error tolerance T, versus the
percentage of points correctly predicted (accuracy)
within the tolerance.
The selection of the MAD and REC measures for
evaluation purposes allows us to compare the hybrid
fuzzy modeling methodologies presented in this
paper with the ones presented in (Cortez et al.,
2009), i.e. multilayer perceptron neural network,
support vector machine and multiple regression.
4 EXPERIMENTAL RESULTS
AND DISCUSSION
The Visual-FIR tool (Escobet et al., 2008) has been
used in this research to perform all the experiments
related to the FIR methodology. Visual-FIR is
developed under the matlab environment and
provides a GUI that allows the user to go through all
the processes of FIR methodology (refer to section
2.1) in a friendly manner and easy parameter
change.
On the other hand, the KEEL (Knowledge
Extraction based on Evolutionary Learning)
environment (Alcalá-Fdez et al., 2009, KEEL,
2005), has been used to perform all the experiments
related to GFS approaches. KEEL is an open source
Java software tool that can be used for a large
number of different knowledge data discovery tasks
and provides a simple GUI based on data flow to
design experiments.
All the experiments reported in this work were
conducted in a windows environment, with an Intel
dual core processor.
As explained before, to evaluate the selected
models, 20 runs have been preformed of the 5-fold
cross-validation, obtaining a total of 100
experiments for each model studied.
The first step in order to obtain the FIR models is
to discretize the data, i.e. to convert quantitative
values into fuzzy data. To this end, it becomes
necessary to define three parameters during the
discretization process, the number of classes (also
called granularity) chosen for each input and output
variable, the shape of their membership functions
and the discretization algorithm.
In this research it has been decided to discretize
all the input variables into two classes. The output
variable is discretized into seven classes, one for
each possible wine quality score, i.e. from 3 to 9.
A discretization of the input variables with more
than two classes can lead to a curse of
dimensionality problem. However, it was found that
two classes are enough for these variables to obtain
decent models.
A triangular shape has been used to represent the
membership functions associated to each class for all
SIMULTECH2015-5thInternationalConferenceonSimulationandModelingMethodologies,Technologiesand
Applications
504
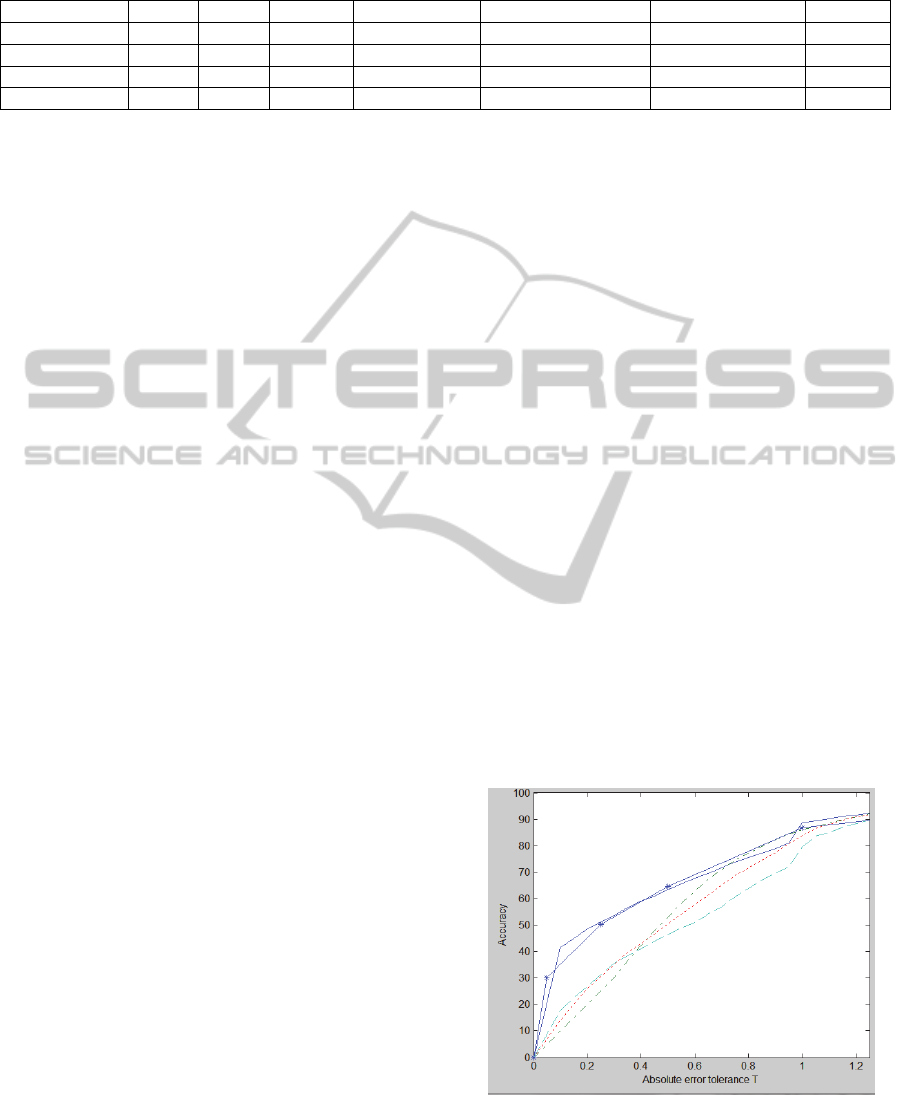
Table 2: The wine modeling results: MAD and Accuracy for three different tolerances. The values of MR, NN and SVM
columns are extracted from (Cortez et al., 2009).
MR NN SVM GFS-GPG-R MOGUL-IRLHC-R MOGUL-TSK-R FIR
MAD
0.59 0.58 0.45 0.63 0.58 0.56
0.44
Accuracy
T=0.25
25.6% 26.5% 50.3% 31.3% 30.6% 25.1%
51.2%
Accuracy
T=0.50
51.7% 52.6%
64.6%
46.3% 50.4% 53.0% 63.3%
Accuracy
T=1.00
84.3% 84.7% 86.8% 79.4% 83.8% 86.0%
88.7%
the variables involved in this study.
Depending on the algorithm chosen the
distribution of the membership functions in the
variable space may vary and this has a direct impact
to the reasoning process, and, therefore, to the model
predictions.
In this research, FIR uses the equal frequency
partition (EFP) algorithm for the discretization of the
input variables. The EFP algorithm distributes the
membership functions of a variable in such a way
that all the classes contain the same number of data
points.
Once the data has been discretized, FIR
methodology performs a feature selection process
where the more relevant causal relations between the
input variables and the output variable are identified.
To this end, we used the model structure
identification process of the fuzzy inductive
reasoning methodology that performs a feature
selection based on the entropy reduction measure as
described in section 2.1.
FIR founds that the features that have highest
relevant causal relation with the wine quality are:
alcohol, fixed acidity, free sulfur dioxide, residual
sugar and volatile acidity. Citric acid and sulphates
are also variables that have causal relation with the
wine quality but not with the same strength than the
previous ones. It can also be concluded that the total
sulfur dioxide is not a relevant variable to predict the
wine quality, presumably because it has redundant
information since the free sulfur dioxide is one of
the selected causal variables.
With respect the GFS algorithms studied, the
parameters by default are used (KEEL, 2005).
The results of all the experiments performed for
each tested configuration are summarized in Table 2.
Two metrics are presented, the MAD and the
classification accuracy for three different tolerances,
i.e. T=0.25, T=0.5 and T=1.0. In this domain a
tolerance of T = 1.0 is accepted as a good quality
control process.
The results obtained by Cortez et al. (2009) using
multiple regression (MR), multilayer perceptron
neural network (NN) and support vector machines
(SVM) are also included in the table for comparison
purposes.
The best results are shown in bold in Table 2.
For almost all the metrics, the FIR methodology is
the best choice. FIR obtains the lowest MAD error
and the highest accuracy for tolerances T = 0.25 and
T = 1.0. The SVM is the methodology that has the
second best results. It obtains, as FIR, a MAD error
lower than 0.5, the best T = 0.5 accuracy value and
better accuracy values for T = 0.25 and T = 1.0 than
the rest of the algorithms studied.
The two MOGUL algorithms perform in general
terms equally well than the MR and NN approaches.
The GFS-GPG-R is the fuzzy approach with poorest
results, however it has better accuracy for the 0.25
tolerance.
Figure 1 presents the REC curves of the 4 fuzzy
approaches studied in this research and the SVM.
It is clearly seen in Figure 1 that the differences
between the two best models, i.e. FIR and SVM, and
the rest of them are higher for small tolerances. For
T values lower than 0.4, the FIR and SVM
accuracies are almost two times better when
compared to the other fuzzy methods. For higher
tolerance values the accuracies become closer.
In terms of computational time effort, the
MOGUL algorithms are the most expensive,
followed by the SVM. FIR is the methodology that
obtains best results and uses less computational time
to obtain the system model and perform the
Figure 1: Average test set REC curves: FIR - solid line;
SVM - solid with star line; MOGUL-TSK-R - dashed with
dot line; MOGUL-IRLHC-R - doted line; GFS-GPG-R -
dashed line.
ModelingWinePreferencesfromPhysicochemicalPropertiesusingFuzzyTechniques
505

prediction. The execution time differences between
the methodologies analyzed, as expected, are really
big since the MOGUL approach performs a three
level optimization. While FIR needs around 10
minutes to perform a complete 5-CV prediction,
GFS-GPG-R about half an hour, SVM almost 2
hours and the MOGUL approaches need about 24
hours.
Encouraging results are achieved with the FIR
model providing the best performance,
outperforming the rest of the hybrid fuzzy
approaches studied. Moreover, the FIR results are
slightly better than the best ones obtained previously
for the same problem by Cortez et al. (2009), when
using SVM. An important advantage of FIR
methodology with respect SVMs is its reduced
computational time. FIR models are synthesized
rather than trained, allowing a quick modelling and
prediction computation. The difference in
computational time between FIR and SVM is
considerable, as stated before.
5 CONCLUSION
This work aims at the prediction of wine preferences
from physicochemical properties tests that are
available at the wine quality certification step. A
large dataset is accessible which contains white wine
samples from the northwest region of Portugal.
Four powerful hybrid fuzzy techniques that
perform data mining are studied in this research. In
the one hand the Fuzzy Inductive Reasoning (FIR)
methodology that is a non-parametric inductive
technique based on fuzzy logic and machine learning
approaches. On the other hand 3 different Genetic
Fuzzy Systems (GFS) that perform fuzzy rule
learning i.e. GFS-GPG-R, MOGUL-TSK-R and
MOGUL-IRLHC-R.
The GFS are much more computational
expensive than FIR since perform different
optimization levels using evolutionary algorithms.
On the other hand, FIR performs feature
selection during the modeling process, concluding
that the features that have highest relevant causal
relation with the wine quality are: alcohol, fixed
acidity, free sulfur dioxide, residual sugar and
volatile acidity. Citric acid and sulphates are also
variables that have causal relation with the wine
quality but not with the same strength than the
previous ones.
FIR, using the previously mentioned variables,
achieves the best performances, outperforming not
only the hybrid fuzzy techniques studied in this
article, but also other data mining methodologies
reported in other studies (Cortez et a., 2009), such
are Neural Networks (NN), Multiple Regression
(MR) and Support Vector Machines (SVM).
The results obtained using the SVM have very
similar error and accuracy metrics than the FIR
results. However, FIR has a great advantage over
SVM with respect the computational time.
As mentioned in all the studies that deal with
wine quality prediction, the results are really
relevant for different aspects of the wine industry.
On the one hand a good prediction can be very
useful in the certification phase. On the other hand,
such a prediction system can also be useful for
training oenology students or for marketing
purposes.
REFERENCES
Alcalá, R, Alcalá-Fdez. J., Casillas, J., Cordón, O.,
Herrera, F., 2007. Local identification of prototypes
for genetic learning of accurate TSK fuzzy rule-based
systems. International Journal of Intelligent Systems,
22, 909-941.
Alcalá-Fdez, J., Sánchez, L., García, S., del Jesus, M.J.,
Ventura, S., Garrell, J.M., Otero, J., Romero, C.,
Bacardit, J., Rivas, V.M., Fernández, J.C., Herrera, F.,
2009. KEEL: A Software Tool to Assess Evolutionary
Algorithms to Data Mining Problems. Soft Computing,
13:3, 307-318.
Carvajal, R., Nebot, A., 1998. Growth Model for White
Shrimp in Semi-intensive Farming using Inductive
Reasoning Methodology. Computers and Electronics
in Agriculture 19, 187-210.
Cordon, O., Herrera, F., 2001. Hybridizing genetic
algorithms with sharing scheme and evolution
strategies for designing approximate fuzzy rule-based
systems. Fuzzy sets and systems, 118, 235-255.
Cordon, O., Herrera, F., Hoffmann, F., Magdalena, L.,
2001. Genetic Fuzzy Systems. Evolutionary Tuning
and Learning of Fuzzy Knowledge Bases. Vol. 19 of
Advances in Fuzzy Systems - Applications and
Theory. World Scientific.
Cortez, P., Cerdeira, A., Almeida, F., Matos, T., Reis, J.,
2009. Modeling wine preferences by data mining from
physicochemical properties. In Decision Support
Systems, Elsevier, 47(4), 547-553.
Ebeler, S., 1999. Flavor Chemistry: Thirty Years of
Progress, Klumer Academic Publishers, 409-422.
Escobet, A., Nebot., A., Cellier, F.E., 2008. Visual-FIR: A
tool for model identification and prediction of
dynamical complex systems. Simulation Modelling
Practice and Theory 16, 76-92.
Keel Platform,2005. http://sci2s.ugr.es/keel/developpment.
php.
Klir, G., Elias, D., 2002. Architecture of Systems Problem
Solving, Plenum Press. New York, 2
nd
edition.
SIMULTECH2015-5thInternationalConferenceonSimulationandModelingMethodologies,Technologiesand
Applications
506

Legin, A., Rudnitskaya, A., Lvova, L., Vlasov, Y., Di
Natale, C., D'Amico, A., 2003. Evaluation of Italian
wine by the electronic tongue: recognition,
quantitative analysis and correlation with human
sensory perception. Analytica Chimica Acta, 484(1), 7
May 2003, 33-44.
Nebot, A., Mugica, F., Cellier, F., Vallverdú, M., 2003.
Modeling and Simulation of the Central Nervous
System Control with Generic Fuzzy Models.
Simulation 79(11), 648-669.
Sánchez, L., Couso, I., Corrales, J.A., 2001. Combining
GP Operators with SA Search to Evolve Fuzzy Rule
Based Classifiers. Information Sciences, 136(1-4),
175-191.
UCI, 2015. http://archive.ics.uci.edu/ml/
Witten, I.H., Frank, E., 2005. Data Mining: Practical
Machine Learning Tools and Techniques with Java
Implementations. Morgan Kaufmann. Sant Francisco,
CA, 2nd Edition.
Yin, X., Han, J., 2003. CPAR: Classification based on
Predictive Association Rules. SDM , 3, 369-376.
ModelingWinePreferencesfromPhysicochemicalPropertiesusingFuzzyTechniques
507
