Big Graph-based Data Visualization Experiences
The WordNet Case Study
Enrico G. Caldarola
1,2
, Antonio Picariello
1
and Antonio M. Rinaldi
1,3
1
Department of Electrical Engineering and Information Technologies, University of Naples Federico II, Napoli, Italy
2
Institute of Industrial Technologies and Automation, National Research Council, Bari, Italy
3
IKNOS-LAB Intelligent and Knowledge Systems, University of Naples Federico II, LUPT 80134, Napoli, Italy
Keywords:
Graph Database, Big Data, NoSQL, Data visualization, WordNet, Neo4J.
Abstract:
In the Big Data era, the visualization of large data sets is becoming an increasingly relevant task due to the
great impact that data have from a human perspective. Since visualization is the closer phase to the users
within the data life cycle’s phases, there is no doubt that an effective, efficient and impressive representation of
the analyzed data may result as important as the analytic process itself. This paper presents an experience for
importing, querying and visualizing graph database and in particular, we describe as a case study the WordNet
database using Neo4J and Cytoscape. We will describe each step in this study focusing on the used strategies
for overcoming the different problems mainly due to the intricate nature of the case study. Finally, an attempt
to define some criteria to simplify the large-scale visualization of WordNet will be made, providing some
examples and considerations which have arisen.
1 INTRODUCTION
Nowadays Data or Information Visualization have be-
come an interesting and wide research field. If the
main goal of Data Visualization is to communicate
information clearly and efficiently to users, involv-
ing the creation and study of the visual representation
of data – i.e., “information that has been abstracted
in some schematic form, including attributes or vari-
ables for the units of information” (Friendly and De-
nis, 2001) – the InformationVisualization main task is
the study of (interactive) visual representations of ab-
stract data to reinforce human cognition. The abstract
data may include both numerical and non-numerical
data, such as text and geographic information. Ac-
cording to (Munzner, 2008), it is possible to distin-
guish Information Visualization (InfoVis), when the
spatial representation is chosen, from Scientific Visu-
alization (SciVis) when the spatial representation is
given due to the intrinsic spatial layout of data (e.g.,
a flow simulation in 3D space). The study presented
in this work belongs to the first category because the
data we represent do not correspond to physical enti-
ties and has no pre-defined spatialization (such as, for
example, in the case of maps or geographic informa-
tive systems). The field of information visualization
has emerged “from research in human-computer in-
teraction, computer science, graphics, visual design,
psychology, and business methods. It is increasingly
applied as a critical component in scientific research,
digital libraries, data mining, financial data analy-
sis, market studies, manufacturing production con-
trol, and drug discovery” (Bederson and Shneider-
man, 2003). Furthermore, the challenges that the Big
Data imperative (Caldarola et al., 2015; Caldarola
et al., 2014) imposes to data management severely
impact on data visualization. The “bigness” of large
data sets and their complexity in term of heterogene-
ity contribute to complicate the representation of data,
making the drawing algorithms quite complex: just to
make an example, let us consider the popular social
network Facebook, in which the nodes represent peo-
ple and the links represent interpersonal connections;
we note that nodes may be accompanied by informa-
tion such as age, gender, and identity, and links may
also have different types, such as colleague relation-
ships, classmate relationships, and family relation-
ships. The effective representation of all the informa-
tion at the same time is really challenging. The most
common solution is to use visual cues, such as color,
shape, or transparency to encode different attributes
(Rinaldi, 2012). At the same time, the availability of
large data coming from human activities, exploration
and experiments, together with the investigations of
104
Caldarola, E., Picariello, A. and Rinaldi, A..
Big Graph-based Data Visualization Experiences - The WordNet Case Study.
In Proceedings of the 7th International Joint Conference on Knowledge Discovery, Knowledge Engineering and Knowledge Management (IC3K 2015) - Volume 1: KDIR, pages 104-115
ISBN: 978-989-758-158-8
Copyright
c
2015 by SCITEPRESS – Science and Technology Publications, Lda. All rights reserved
new and efficiently ways of visualizing them, open
new perspectives from which to view the world we
live in and to make business. The Infographics be-
come Infonomic, a composite term between the term
Information and Economics that wield information as
a real asset, a real opportunity to make business and to
discoverthe world. Various techniques have been pro-
posed for graph visualization for the last two decades
and they will be presented in the next section. As
far as we can say here, the principled representation
methodology we agree on is the Visual Information
Seeking Mantra presented by Scheiderman in (Beder-
son and Shneiderman, 2003). It can be summarized as
follows: “overview first, zoom and filter, then details-
on-demand”.
The reminder of the paper is organized as follows.
After a literature review on the Graph Visualization
techniques and methodologies, contained in section
2, a description of the proposed WordNet meta-model
is provided in section 3. Afterward, starting from a
description of the approach used for the WordNet im-
porting procedure within Neo4j, in section 4, the at-
tempts made in querying and visualizing WordNet are
described in section 5 and 6. Finally, section 7 draws
the conclusion summarizing the major findings and
outlining future investigations
2 RELATED WORKS
Since the study conducted in this paper consists in
the visual representation of WordNet inside the Neo4j
graph DB, this section focuses mainly on a literature
review in Graph Visualization, referring to other well-
known works in the literature for a complete review
of the techniques and theories in Information Visual-
ization (Spence, 2001; Mazza, 2009; Fayyad et al.,
2002; Ware, 2012). Graphs are traditional and pow-
erful tools that visually represent sets of data and the
relations among them. In the most common sense of
the term, a graph is an ordered pair G=(V,E) com-
prising a set V of vertices or nodes together with a
set E of edges or lines, which are 2-element subsets
of V (i.e., an edge is related with two vertices, and
the relation is represented as an unordered pair of the
vertices with respect to the particular edge). Graph
visualization usually refers to representation of in-
terconnected nodes arranged in space and navigation
through a visual representation to help users under-
stand the global or local original data structures (Cui
and Qu, 2007). Graphs are represented visually by
drawing a dot or circle for every vertex, and drawing
an arc between two vertices if they are connected by
an edge. If the graph is directed, the direction is in-
dicated by drawing an arrow. The pioneering work
of W. T. Tutte (Tutte, 1963) was very influential in
the subject of graph drawing, in particular he intro-
duced the use of linear algebraic methods to obtain
graph drawings. The basic graph layout problem is
very simple: given a set of nodes with a set of edges,
it only needs to calculate the positions of the nodes
and draw each edge as curve. Despite the simplicity
of the problem, to make graphical layouts understand-
able and useful is very hard. Basically there are gen-
erally accepted aesthetic rules (Purchase, 1997; Pur-
chase et al., 1996), which include: distribute nodes
and edges evenly, avoid edge crossing, display iso-
morphic substructures in the same manner, minimize
the bends along the edges. However, since it is quite
impossible to meet all rules at the same time, some
of them conflict with each other or they are very com-
putationally expensive, practical graphical layouts are
usually the results of compromise among the aesthet-
ics.
Below is a brief overview of graph layouts and vi-
sualization techniques grouped by categories:
• Node-link layouts.
– Tree Layout. It uses links between nodes to
indicate the parent-child relationships. A very
satisfactory solution for node-link layout comes
from Reingold et al. (Reingold and Tilford,
1981). Their classical algorithm is simple, fast,
predictable, and produces aesthetically pleas-
ing trees on the plane. However, it makes use
of screen space in a very inefficient way. In or-
der to overcome this limitation, some compact
tree layout algorithms have been developed to
obtain more dense tree, while keeping the clas-
sical tree looks (Beaudoin et al., 1996). Eades
(Huang et al., 2007) proposes another node-
link layout called radial layout that recursively
positions children of a sub-tree into a circular
wedge shape according to their depths in the
tree. Generally, radial views, including its vari-
ations (Wills, 1997), share a common charac-
teristic: the focus node is always placed at the
center of the layout, and the other nodes radi-
ate outward on separated circles. Balloon lay-
out (Carriere and Kazman, 1995) is similar to
radial layout and are formed where siblings of
sub-trees are placed in circles around their fa-
ther node. This can be obtained by projecting
cone tree onto the plane.
– Tree Plus Layout. Since large graphs are much
more difficult to handle than trees, tree vi-
sualization is often used to help users under-
stand graph structures. A straightforward way
to visualize graphs is to directly layout span-
Big Graph-based Data Visualization Experiences - The WordNet Case Study
105
ning trees for them. Munzner (Munzner, 1997)
finds a particular set of graphs called quasi-
hierarchical graphs, which are very suitable
to be visualized as minimum spanning trees.
However, for most graphs, all links are impor-
tant. It could be very hard to choose a represen-
tative spanning tree. Arbitrary spanning trees
can also possibly deliver misleading informa-
tion.
– Spring Layout. This layout, also known as
Force-Directed layout, is another popular strat-
egy for general graph layouts. In spring lay-
out, graphs are modeled as physical systems
of rings or springs. The attractive idea about
spring layout is that the physical analogy can
be very naturally extended to include additional
aesthetic information by adjusting the forces
between nodes. As one of the first few prac-
tical algorithms for drawing general graphs,
spring layout is proposed by Eades in 1984
(Eades, 1984). Since then, his method is revis-
ited and improved in different ways (Fruchter-
man and Reingold, 1991; Gansner and North,
1998). Mathematically, Spring layout is based
on a cost (energy) function, which maps differ-
ent layouts of the same graph to different non-
negative numbers. Through approaching the
minimum energy, the layout results reaches bet-
ter and better aesthetically pleasing results. The
main differences between different spring ap-
proaches are in the choice of energy functions
and the methods for their minimization.
• Space Division Layout. In this case, the parent-
child relationship is indicated by attaching child
node(s) to the parent node. Since the parent-child
and sibling relationships are both expressed by ad-
jacency, The layout should have a clear orienta-
tion cue to differentiate these two relationships
• Space Nested Layout. Nested layouts, such
as Treemaps (Johnson and Shneiderman, 1991),
draw the hierarchical structure in the nested way.
They place child nodes within their parent node
• 3D Layout. In this case, the extra dimension can
give more space and it would be easier to display
large structures. Moreover, Due to the general hu-
man familiarity with 3D in the real world, there
are some attempts to map hierarchical data to 3D
objects we are familiar with
• Matrix Layout. Graphs can be presented by their
connectivity matrixes. Each row and each column
corresponds to a node. The glyph at the interac-
tion of (i, j) encodes the edge from node i to node
j. Edge attributes are encoded as visual charac-
teristics of the glyphs. such as color, shape, and
size. The major benefit of adjacency matrices is
the scalability
Specifically regarding the visualization of Word-
Net, there are not many works in the literature. In
(Kamps and Marx, 2002), the authors makes an at-
tempt to visualize the WordNet structure from the
vantage point of a particular word in the database, this
in order to overcome the down-side of the large cov-
erage of WordNet, i.e., the difficulty to get a good
overview of particular parts of the lexical database.
An attempt to apply design paradigms to generate vi-
sualizations which maximize the usability and util-
ity of WordNet is made in (Collins, 2006), whereas,
in (Collins, 2007) a radial, space-filling layout of
hyponymy (IS-A relation) is presented with interac-
tive techniques of zoom, filter, and details-on-demand
for the task of document visualization, exploiting
the WordNet lexical database. Finally, regarding the
comparison between Neo4J Cypher language perfor-
mances against the traditional SQL-based technolo-
gies, an interesting experience has been described
in (Holzschuher and Peinl, 2013) where the authors
compare Neo4j back-end different alternativesto each
other and to the JPA-based sample back-end running
on MySQL.
3 WordNet CASE STUDY
The case study presented in this paper consists in the
reification of the WordNet database inside the Neo4J
GraphDB (Webber, 2012; Robinson et al., 2013).
WordNet (Fellbaum, 1998; Miller, 1995) is a large
lexical database of English. Nouns, verbs, adjec-
tives and adverbs are grouped into sets of cognitive
synonyms (synsets), each expressing a distinct con-
cept. Synsets are interlinked by means of conceptual-
semantic and lexical relations.
In this context we have defined and implemented a
meta-model for the WordNet reification using a con-
ceptualization as much as possible close to the way
in which the concepts are organized and expressed
in human language (Rinaldi, 2008; Rinaldi, 2014).
We consider concepts and words as nodes in Neo4J,
whereas semantic, linguistic and semantic-linguistic
relations become Noeo4J links between nodes. For
example, the hyponymy property can relate two con-
cept nodes (nouns to nouns or verbs to verbs); on the
other hand a semantic property links concept nodes
to concepts and a syntactic one relates word nodes
to word nodes. Concept and word nodes are consid-
ered with DatatypeProperties, which relate individu-
als with a predefined data type. Each word is related
KDIR 2015 - 7th International Conference on Knowledge Discovery and Information Retrieval
106

to the represented concept by the ObjectProperty has-
Concept while a concept is related to words that rep-
resent it using the ObjectProperty hasWord. These are
the only properties able to relate words with concepts
and vice versa; all the other properties relate words
to words and concepts to concepts. Concepts, words
and properties are arranged in a class hierarchy, re-
sulting from the syntactic category for concepts and
words and from the semantic or lexical type for the
properties.
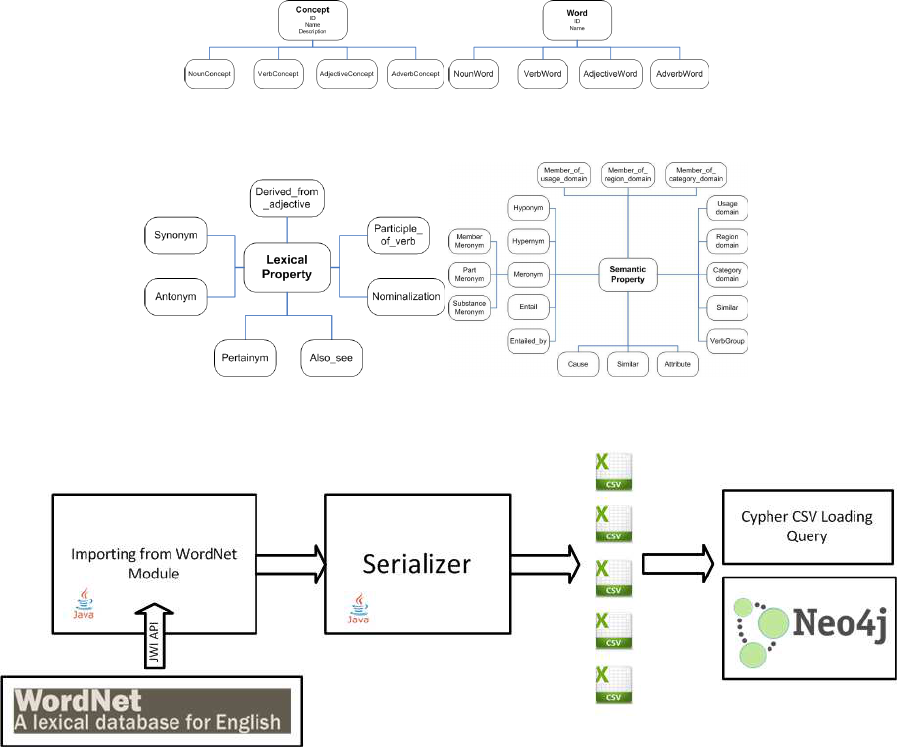
Figures 1(a) and 1(b) show that the two main
classes are: Concept, in which all the objects have
defined as individuals and Word which represents all
the terms in the ontology.
The subclasses have been derived from the related
categories. There are some union classes useful to
define properties domain and codomain. We define
some attributes for Concept and Word respectively:
Concept hasName that represents the concept name;
Description that gives a short description of concept.
On the other hand Word has Name as attribute that
is the word name. All elements have an ID within
the WordNet offset number or a user defined ID. The
semantic and lexical properties are arranged in a hi-
erarchy (see figure 2(a) and 2(b)). In table 1 some of
the considered properties and their domain and range
of definition are shown.
Table 1: Properties.
Property Domain Range
hasWord Concept Word
hasConcept Word Concept
hypernym NounsAnd NounsAnd
VerbsConcept VerbsConcept
holonym NounConcept NounConcept
entailment VerbWord VerbWord
similar AdjectiveConcept AdjectiveConcept
The use of domain and codomain reduces the
property range application. For example, the hy-
ponymy property is defined on the sets of nouns and
verbs; if it is applied on the set of nouns, it has the
set of nouns as range, otherwise, if it is applied to the
set of verbs, it has the set of verbs as range. In table
2 there are some of defined constraints and we spec-
ify on which classes they have been applied w.r.t. the
considered properties; the table shows the matching
range too.
Table 2: Model constraints.
Costraint Class Property Constraint range
AllValuesFrom NounConcept hyponym NounConcept
AllValuesFrom AdjectiveConcept attribute NounConcept
AllValuesFrom NounWord synonym NounWord
AllValuesFrom AdverbWord synonym AdverbWord
AllValuesFrom VerbWord also
see VerbWord
Sometimes the existence of a property between
two or more individuals entails the existence of other
properties. For example, being the concept dog a hy-
ponym of animal, we can assert that animal is a hy-
pernymy of dog. We represent this characteristics in
OWL, by means of property features shown in table
3.
Table 3: Property features.
Property Features
hasWord inverse of hasConcept
hasConcept inverse of hasWord
hyponym inverse of hypernym; transitivity
hypernym inverse of hyponym; transitivity
cause transitivity
verbGroup symmetry and transitivity
4 IMPORTING WordNet INTO
Neo4J
The importing process of WordNet database within
Neo4J graphDB (Webber, 2012) has been imple-
mented according to the scheme shown in figure 3.
The process involves three phases and three compo-
nents: the importing from WordNet module, the seri-
alizer module and the importing within Neo4J mod-
ule. The first phase has been implemented using a
Java-based script that access the WordNet database
through JWI (MIT Java Wordnet Interface) API (Fin-
layson, 2013; Finlayson, 2014) and passes all the
information related to synsets, words, semantic re-
lations and lexical relations to the serializer mod-
ule, producingappropriate serialized data, followinga
proper schema that will be described in the following.
The last component, which is related to the third
phase of the process, is responsible for import-
ing the previously serialized information into Neo4J
database. The importing from WordNet takes place
via five different sub-operations which respectively
retrieve: the information related to synsets, the se-
mantic relations among synsets, the words, the lexical
relations among words and finally the links between
the semantic and the lexical world, i.e., how a word is
related to its concepts (or its meaning) and viceversa.
The intentional schema of each serialized data is
shown as follow:
1. The synset file contains the following fields:
(a) Id: the univoque indentifier for the synset;
(b) SID: the Synset ID as reported in the WordNet
database;
(c) POS: the synset’s part of speech;
(d) Gloss: the synset’s gloss which express its
meaning.
2. The semantic relations file contains the following
fields:
(a) Prop: the semantic relation linking the source
and the destination synsets;
Big Graph-based Data Visualization Experiences - The WordNet Case Study
107
(a) Concept (b) Word
Figure 1: Concept and Word.
(a) Lexical Properties (b) Semantic Properties
Figure 2: Linguistic properties.
Figure 3: High-level view of the WordNet importing architecture.
(b) Src: the source synset;
(c) Dest: the destination synset;
3. The words file contains the following fields:
(a) Id: the univoque indentifier for the word;
(b) WID: the Word ID as reported in the WordNet
database;
(c) POS: the word’s part of speech;
(d) Lemma: lexical represenntation of the word;
(e) SID: the synset Id whose the word is related.
4. The lexical relations file contains the following
fields:
(a) Prop: the lexical relation linking the source and
the destination words;
(b) Src: the source word;
(c) Dest: the destination word;
5. The lexical-semantic relations file contains the
following fields:
(a) Word Id: the word id of the word that is linked
to the synset on the right via the hasConcept
relation;
(b) Synset Id: the synset id of the synset that is
linked to the word on the left via the hasWord
relation;;
In order to import all the information contained in
the serialized data and translate them into a graph data
structure, the meta-model described in the previous
section has been used: each synset and word has been
converted into a node of the graph with label respec-
tively: Concept and Word. Each semantic relation has
become an edge between two concept nodes with the
type property expressing the specific semantic rela-
tion holding between the concepts. Each lexical re-
lation has been converted into an edge between two
word nodes with a type property expressing the spe-
cific lexical relation between the word nodes. Finally,
the word nodes have been connected to their related
KDIR 2015 - 7th International Conference on Knowledge Discovery and Information Retrieval
108
concept nodes through the hasConcept relation.
The Cypher query code used to import all the se-
rialized information stored into csv lines is shown as
follows:
USING PERIODIC COMMIT 1000
LOAD CSV WITH HEADERS FROM
"PATH_TO_THE_FIRST_FILE" AS csvLine
CREATE (c: Concept {
id: toInt(csvLine.id),
sid: csvLine.SID, POS:
csvLine.POS,
gloss: csvLine.gloss })
CREATE CONSTRAINT ON (c: Concept)
ASSERT c.id IS UNIQUE
USING PERIODIC COMMIT 1000
LOAD CSV WITH HEADERS FROM
"PATH_TO_THE_SECOND_FILE" AS csvLine
MATCH (src:Concept { id: toInt(csvLine.Src)}),
(dest:Concept { id: toInt(csvLine.Dest)})
CREATE (src)-[:semantic_property
{ type: csvLine.Prop }]->(dest)
USING PERIODIC COMMIT 1000
LOAD CSV WITH HEADERS FROM
"PATH_TO_THE_THIRD_FILE" AS csvLine
CREATE (w: Word {
id: toInt(csvLine.id),
wid: csvLine.WID,
POS: csvLine.POS,
lemma: csvLine.lemma,
sid: toInt(csvLine.SID) })
CREATE CONSTRAINT ON (w: Word)
ASSERT w.id IS UNIQUE
USING PERIODIC COMMIT 1000
LOAD CSV WITH HEADERS FROM
"PATH_TO_THE_FOURTH_FILE" AS csvLine
MATCH (src:Word { id: toInt(csvLine.Src)}),
(dest:Word { id: toInt(csvLine.Dest)})
CREATE (src)-[:lexical_property
{ type: csvLine.Prop }]->(dest)
USING PERIODIC COMMIT 1000
LOAD CSV WITH HEADERS FROM
"PATH_TO_THE_FIFTH_FILE" AS csvLine
MATCH (src:Word { id: toInt(csvLine.Word)}),
(dest:Concept { id: toInt(csvLine.SID)})
CREATE (src)-[:hasConcept]->(dest)
Having identified each synset and word with a
unique and sequential integer, it has been possible for
Neo4J to efficiently create nodes and arcs from csv
lines. Furthermore, since the csv file contains a signif-
icant number of rows (approaching hundreds of thou-
sands) USING PERIODIC COMMIT can be used to
instruct Neo4j to perform a commit after a number of
rows. This reduces the memory overhead of the trans-
action state. Table 4 shows the time performance in
importing all the csv file on a laptop computer with an
Intel Core i7-4800MQ processor at 2.70 GHz (64-bit)
and 8 GB RAM:
Table 4: Neo4J query execution times for each importing
query.
Query no. [ms]
Q1 13015
Q2 23779
Q3 25787
Q4 17358
Q5 36907
5 QUERYING THE WordNet
GRAPH
The first attempt to visualize the graph-based version
of the WordNet database within Neo4j has been car-
ried out using the Neo4j built-in web visualizer. Al-
though it is a power and flexible tool allowing the user
to easily customize the view according to her prefer-
ences, it suffers a lot when the number of elements
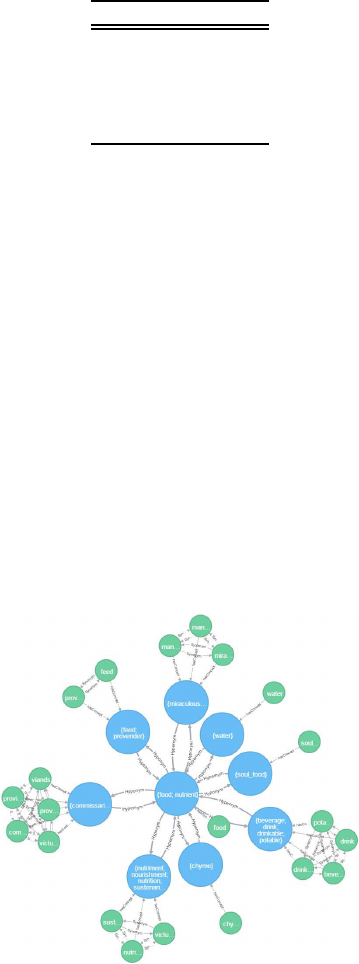
to be visualized approaches few hundreds. Figure
4 shows the first result obtained with a simple cus-
tomization involving the usage of two different colors
for the two type of nodes, namely, the green for the
Word node and the blue for the Concept (or Synset)
node. Semantic relations have been represented with
an edge thicker than the one used for the lexical rela-
tions or for the hasConcept relations.
Figure 4: First view of Neo4j WordNet graph excerpt.
Big Graph-based Data Visualization Experiences - The WordNet Case Study
109
Table 5: Cypher and SQL-based query version.
Cypher Version and SQL Version
MATCH ( w src : Word {lemma : ’ p o l i t i c s ’ }) −[ r : hasConcept]−>(c : Concept ) − [
*
..N]−>(d : Concept )<−[s : hasConcept ]−( w dst : Word
) r e tu rn w
src , c , d , w dst
SELECT Word . lemma AS src
lemma , Word . hasConcept AS s r c c o nc e p t , SemanticRelation . t y p e AS P r op er t y 1 , Se m anticRelation .
ds t AS I n t e r m e d i a t e
Conce p t 1 , . . . , SemanticRe l a t i o n . type AS Property N , Seman t i cRelation . ds t AS
Intermediate
Conce p t N , Word . lemma AS dst lemma
FROM Word JOIN Concept ON Word . conceptID = Concept . SID JOIN SemanticRe l a t i o n ON SemanticRe l a t i o n . s rc = Concept . SID JOIN
SemanticRe l a t i o n ON SemanticRe l a t i o n . d s t = SemanticRel a t i o n . src . . . JOIN S em anticRelation ON SemanticRelation . d s t
= SemanticRelation . sr c
WHERE word . wid = (SELECT Word . wid FROM Word WHERE Word . lemma = ” p o l i t i c s ” )
MATCH (n : Concept { words : ’{ p o l i t i cs } ’ }) −[ r : se man tic p rop e rt y
*
. .N { typ e : ’Hyponym ’}] −(m: Concept ) RETURN COUNT( r )
SELECT SemanticRelation . sr c AS Source , COUNT(
*
)
FROM Se m a n t i cRelation R e lat i on
1 JOIN SemanticRel a t i o n R e lat i on 2 ON R e lat i on 1 . dst = R e lat i on 2 . s r c . . . . JOIN
SemanticRe l a t i o n Relation
N
ON Relation
N −1. d s t = Relation N . s r c
WHERE Source . words = ’ p o l i t i c s ’ AND Re l at i on
1 . t y p e = ’Hyponym ’ . . . AND Relation N . ty p e = ’Hyponym ’
MATCH (w: Word { lemma : ” food ” } ) ,( v : Word { lemma : ” lunch ” } ) ,
p = s h o r t es t P a t h ( (w) −[
*
]−(v ) )
RETURN p
(No e qu i va l e n t )
Each Concept node is labeled with the lexical
chain of the synonyms related to such concept. A
set edges ends to the synset node and comes from
all the words belonging to the synset. These ones
also are connected one with each other through the
synonymy lexical relation. The concept nodes, in
blue, are mainly connected through the hypernym-
hyponym semantic relations. The greatest value of
importing WordNet database into a Neo4j graph, it
is not related to the graph visualization capabili-
ties of the web visualizer, but, mainly, to the power
of the Cypher query language, a declarative graph
query language that allows for expressive and efficient
querying and updating of the graph store. Since very
complicated database queries can easily be expressed
through Cypher, this allows the user to focus on the
data model domain instead of getting lost in database
access. Most of the keywords like WHERE and OR-
DER BY are inspired by SQL, while pattern match-
ing borrows expression approaches from SPARQL
(Van Bruggen, 2014).
In the attempt to extract some useful information
from the WordNet implementation in Neo4j, we have
run few queries and have compared them to an equiv-
alent version expressed in SQL languages. Table 5
reports a comparison of the Cypher-based and SQL-
based version of each query. It is not a quantita-
tive comparison but just a qualitative one that clearly
shows how complex (or in in some circumstances im-
possible at all) is to translate a query from the graph
query language into the relational-based SQL lan-
guage.
The objective of the first query is to get all concept
nodes between the source and the target synset, where
the source concept is fixed and has a lemma equal
to politics, whereas the target node can be any node
of the network. The only constraint is that between
the first and the last synset there may be N (depth
level) relations (semantic relations in this case) and
N-1 intermediate nodes. The Neo4j web-based tool
provides two ways of visualizing results: the table-
based and the graph-based. By analysing the query
structure in the two columns, it appears quite clear
that a graph-based query language is most suitable in
order to select sub-graphs, as in this case. In fact,
it comes very natural to select a bunch of nodes and
relations just by using patterns and pattern-matching,
expressed in an intuitiveand iconic syntax, to describe
the shape of the data you are looking for (Holzschuher
and Peinl, 2013). On the contrary, the SQL-based ver-
sion requires more and more intricate combination of
JOIN clauses to link synsets from the SemanticRela-
tion and Concept tables. Each JOIN clause involves
a cartesian product between the SemanticRelation ta-
ble, which contains 283.836 rows, and itself with an
order that increases with the degree of separation be-
KDIR 2015 - 7th International Conference on Knowledge Discovery and Information Retrieval
110
tween the source and the target node (N). The second
query in table, uses the COUNT aggregation func-
tion both in the Cypher and SQL-based version. It
gets the number of the Hyponym relations holding be-
tween the politics source concept and any other con-
cept that is at most N hops from the source. Accord-
ing to (Mathur and Dalal, 2015), aggregation opera-
tors make worse the performances of the SQL-based
query especially when N increases (N<6) with re-
spect to the equivalent queries in Cypher. Also in this
case, the SQL-based query require N JOIN clauses
which corresponds to an equal number of cartesian
products. Finally, the last query gets the shortest
path between the food and lunch concepts. While the
Cypher language offers utility functions like shortest-
Path() or AllShortestPath() making very easy to re-
spond to such queries, the SQL language do not has
similar ready-to-use functions. Furthermore, a graph-
based data structure allows users to use Traversal API
to specify desired movements through a graph in a
programmatic way.
Figure 5: Second view of Neo4j WordNet graph excerpt.
6 LARGE-SCALE
REPRESENTATION OF WordNet
GRAPH
The proposed representation of WordNet, within
Neo4j, approaches very closely the Big Data chal-
lenges. In particular, the volume dimension must
be taken into consideration here: this version of the
WordNet graph, in fact, includes near to 2 millions
different relations linking more than 3 hundred thou-
sand nodes with each other. With these big num-
bers, the manipulation, the querying and the visual-
ization of the graph become quite challenging. Be-
fore describing the attempts made in this direction,
it is important to note that the visualization of the
entire structure of WordNet in terms of all synsets,
words, semantic and lexical relations in a way that
is elegant and human friendly at the same time, is a
chimera, due to the performance issues of the visu-
alization tools, in particular when sophisticated draw-
ing algorithms are used, and to the strongly connected
nature of information to be represented, which often
results in a messy and dense structure of nodes and
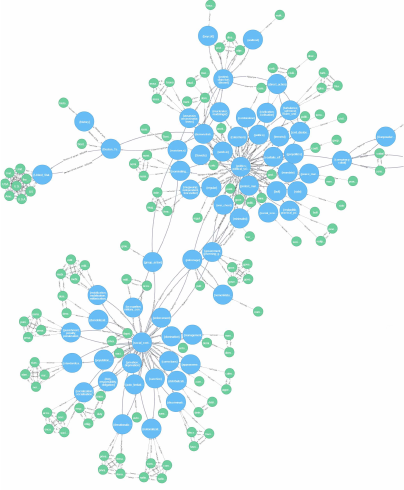
edges. Figure 6 shows a representation of near 15.000
nodes and 30.000 relations of WordNet using the Cy-
toscape v. 3 graph visualization tool (Mathur and
Dalal, 2015). The image has been obtained by limit-
ing to 30.000 relations a simple cypher query that gets
some data from the Neo4j implementation of Word-
Net. The Neo4j running instance has been accessed
via the cyNeo4j plugin, that converts the query results
into Cytoscape table format. Afterward, starting from
the query tables, a view has been created by defining
a custom style and the default layout. This latter is the
Force-directed graph drawing algorithm that draws
graphs in an aesthetically pleasing way by position-
ing the nodes of a graph in two-dimensional or three-
dimensional space, so that all the edges are of more or
less equal length and there are as few crossing edges
as possible (Kobourov, 2012). The resulting figure is
more considerable for global analysis than for infor-
mation that you can retrieve from it. Nevertheless,
thanks to the force-directed algorithm, it is possible
to observe agglomerates of nodes and edges which
correspond to specific semantic categories. The fig-
ure also shows a zoomed area selection where it is
possible to visualize and read the synset labels be-
longing to the selected semantic zone. Figure 6 shows
only synsets and their semantic relations; an attempt
to add also the lexical relations and the Word nodes
results in an even more confused tangle of points and
arcs. Thus, it is necessary to simplify the representa-
tion of the network by following some functional and
esthetic criteria. In this regards, we have selected two
simple criteria:
1. the efficiency of the visualization; i.e., avoid the
information redundancy and the proliferation of
useless signs and graphics as much as possible;
2. the effectiveness of the visualization; i.e., grant
that the graphical representation of the network
covers the whole informativecontent of the Word-
Net graph-based implementation.
Big Graph-based Data Visualization Experiences - The WordNet Case Study
111
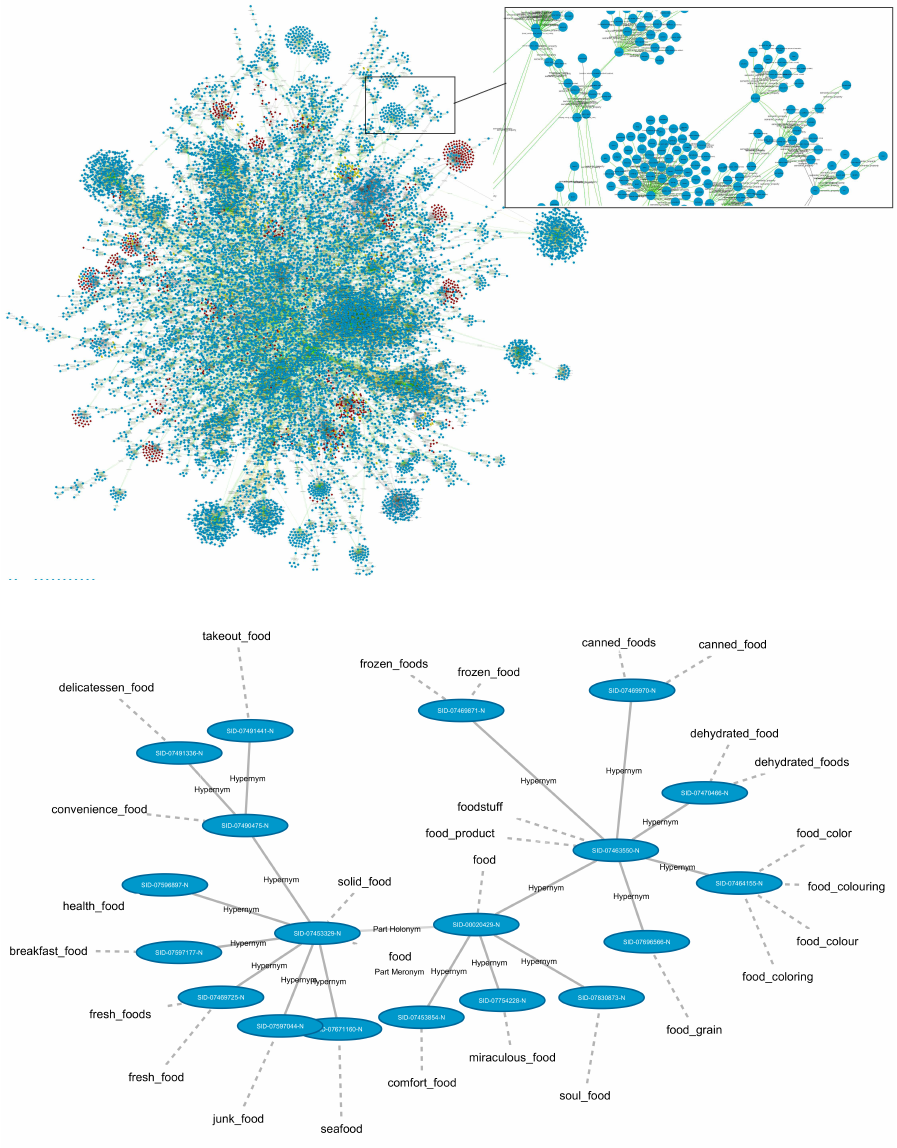
Figure 6: WordNet graph excerpt with 30000 edges and about 15000 nodes.
Figure 7: First layout of WordNet graph excerpt.
3. the clearness of visualization, i.e., use light colors,
such as gray, light blue, dark green, etc. with a
proper level of brightness and with an appreciable
contrast.
KDIR 2015 - 7th International Conference on Knowledge Discovery and Information Retrieval
112
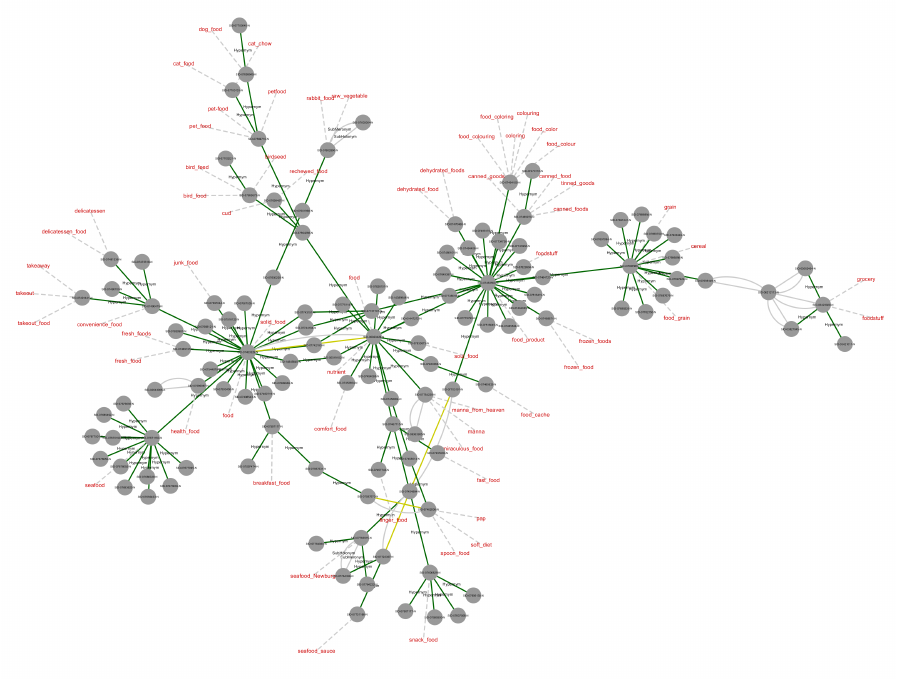
Figure 8: Second layout of WordNet graph excerpt.
Along the efficiency criteria, we decided to visu-
alize only Words labels, avoiding to show again the
lexical chain of words representing the correspond-
ing concept into the synset nodes. These ones only
show the synset ID as retrieved from the WordNet
database inside the stretched blue oval. Furthermore,
since for each Hyponym relation between synsets cor-
responds an Hypernym relation, we decided to show
only one of the two, namely the Hypernym, in order to
increase the clearness of the representation. The same
approach has been adopted for the other pairs of anti-
nomical relations like Meronym-Holonym. This ap-
proach also satisfies the effectiveness criteria, in fact,
even if there is not an explicit representation of the
Hyponym relations, these ones can be inferred from
the corresponding Hypernym ones. Each synset is
linked to the corresponding lemmas through the has-
Concept relation which has been represented with a
dashed line with a light gray color without an explicit
label. This improves the efficiency of the visualiza-
tion and the effectiveness, since no informative con-
tents is sacrificed for clearness. Figure 7 shows an ex-
cerpt of the WordNet representation using the previ-
ously described style and layout. It appears evidently
clearer than the representation in figure 4 (also with
respect to the zoomed selected area), also adding the
words nodes and the hasConcept relations. Figure 7
makes some changes compared to the figure 8, mainly
regarding the shape of the synset and words nodes, its
color and try to distinguish semantic relation by using
different colors.
7 CONCLUSIONS
In this paper we have described an experience of im-
porting, exploring and visualizing WordNet into a
graphDB. To achieve this objective we have faced dif-
ferent issues involving Big Data challenges through
all the phases of graph management. The import pro-
cedure has been accomplished using he Cypher im-
port functions; queries running has also resulted quite
simple by exploiting the potentiality of the Cypher
language (such as, its iconicity, the pattern-matching
mechanism and the built-in functions to traverse the
graph), with respect to the equivalent queries in SQL
language. Eventually, the visualization task has re-
Big Graph-based Data Visualization Experiences - The WordNet Case Study
113
sulted more challenging, due to the intricate nature
of the WodrNet graph and its ”‘Big”’ dimensions in
terms of nodes and edges, particularly, when it is re-
quested a large-scale visualization. Thus, if we want
to simplify the visualization of WordNet, a redefini-
tion of the custom style and also the layout manager is
needed. In this regard, we have introduced three cri-
teria to simplify the view, with respect to efficiency,
effectiveness and clearness and have adopted them in
order to obtain two different representation of Word-
Net, which results more clear at first glance.
Starting from the consideration emerged in this
work, at least two different directions could be taken
for future investigations or researches. From the one
hand, it worth to deepen the comparison between
Cypher and SQL languages also through a perfor-
mance analysis, in order to appreciate the efficiency
of the language, in addition to the immediacy of the
first language; on the other hand, an improved charac-
terization of the criteria to simplify the view could be
investigated, and validated by usability tests in which
the user can express a consensus whether the repre-
sentation is friendly or not, and the information in-
side WordNet is easily accessible or not. Finally, also
the choice of the layout manager requires more at-
tention: ranging from the simple grid layout to the
elegant force-directed layout, it is important to under-
stand what is the layout that best suits the nature of
the data itself.
REFERENCES
Beaudoin, L., Parent, M.-A., and Vroomen, L. C. (1996).
Cheops: A compact explorer for complex hierarchies.
In Visualization’96. Proceedings., pages 87–92. IEEE.
Bederson, B. B. and Shneiderman, B. (2003). The craft
of information visualization: readings and reflections.
Morgan Kaufmann.
Caldarola, E. G., Picariello, A., and Castelluccia, D. (2015).
Modern enterprises in the bubble: Why big data mat-
ters. ACM SIGSOFT Software Engineering Notes,
40(1):1–4.
Caldarola, E. G., Sacco, M., and Terkaj, W. (2014). Big
data: The current wave front of the tsunami. ACS Ap-
plied Computer Science, 10(4):7–18.
Carriere, J. and Kazman, R. (1995). Research report. inter-
acting with huge hierarchies: beyond cone trees. In
Information Visualization, 1995. Proceedings., pages
74–81. IEEE.
Collins, C. (2006). Wordnet explorer: applying visualiza-
tion principles to lexical semantics. Computational
Linguistics Group, Department of Computer Science,
University of Toronto, Toronto, Ontario, Canada.
Collins, C. (2007). Docuburst: Radial space-filling visual-
ization of document content. Knowledge Media De-
sign Institute, University of Toronto, Technical Report
KMDI-TR-2007-1.
Cui, W. and Qu, H. (2007). A survey on graph visualization.
PhD Qualifying Exam (PQE) Report, Computer Sci-
ence Department, Hong Kong University of Science
and Technology, Kowloon, Hong Kong.
Eades, P. (1984). A heuristics for graph drawing. Congres-
sus numerantium, 42:146–160.
Fayyad, U. M., Wierse, A., and Grinstein, G. G. (2002). In-
formation visualization in data mining and knowledge
discovery. Morgan Kaufmann.
Fellbaum, C. (1998). Wordnet. The Encyclopedia of Ap-
plied Linguistics.
Finlayson, M. A. (2013). MIT Java Wordnet Interface (JWI)
User’s Guide, Version 2.2.x.
Finlayson, M. A. (2014). Java libraries for accessing the
princeton wordnet: Comparison and evaluation. Pro-
ceedings of the 7th Global Wordnet Conference, Tartu,
Estonia.
Friendly, M. and Denis, D. J. (2001). Milestones
in the history of thematic cartography, statis-
tical graphics, and data visualization. URL
http://www.datavis.ca/milestones.
Fruchterman, T. M. and Reingold, E. M. (1991). Graph
drawing by force-directed placement. Softw., Pract.
Exper., 21(11):1129–1164.
Gansner, E. R. and North, S. C. (1998). Improved force-
directed layouts. In Graph Drawing, pages 364–373.
Springer.
Holzschuher, F. and Peinl, R. (2013). Performance of graph
query languages: comparison of cypher, gremlin and
native access in neo4j. In Proceedings of the Joint
EDBT/ICDT 2013 Workshops, pages 195–204. ACM.
Huang, W., Hong, S.-H., and Eades, P. (2007). Effects
of sociogram drawing conventions and edge crossings
in social network visualization. J. Graph Algorithms
Appl., 11(2):397–429.
Johnson, B. and Shneiderman, B. (1991). Tree-maps: A
space-filling approach to the visualization of hierar-
chical information structures. In Visualization, 1991.
Visualization’91, Proceedings., IEEE Conference on,
pages 284–291. IEEE.
Kamps, J. and Marx, M. (2002). Visualizing wordnet struc-
ture. Proc. of the 1st International Conference on
Global WordNet, pages 182–186.
Kobourov, S. G. (2012). Spring embedders and force
directed graph drawing algorithms. arXiv preprint
arXiv:1201.3011.
Mathur, A. and Dalal, D. (2015). APIARY: A Case for
Neo4J? Equal Experts Labs.
Mazza, R. (2009). Introduction to information visualiza-
tion. Springer Science & Business Media.
Miller, G. A. (1995). Wordnet: a lexical database for en-
glish. Communications of the ACM, 38(11):39–41.
Munzner, T. (1997). H3: Laying out large directed graphs
in 3d hyperbolic space. In Information Visualization,
1997. Proceedings., IEEE Symposium on, pages 2–10.
IEEE.
KDIR 2015 - 7th International Conference on Knowledge Discovery and Information Retrieval
114
Munzner, T. (2008). Process and pitfalls in writing infor-
mation visualization research papers. In Information
visualization, pages 134–153. Springer.
Purchase, H. (1997). Which aesthetic has the greatest effect
on human understanding? In Graph Drawing, pages
248–261. Springer.
Purchase, H. C., Cohen, R. F., and James, M. (1996). Val-
idating graph drawing aesthetics. In Graph Drawing,
pages 435–446. Springer.
Reingold, E. M. and Tilford, J. S. (1981). Tidier drawings
of trees. Software Engineering, IEEE Transactions on,
(2):223–228.
Rinaldi, A. M. (2008). A content-based approach for doc-
ument representation and retrieval. In Proceedings of
the eighth ACM symposium on Document engineer-
ing, pages 106–109. ACM.
Rinaldi, A. M. (2012). Improving tag clouds with ontolo-
gies and semantics. In Database and Expert Systems
Applications (DEXA), 2012 23rd International Work-
shop on, pages 139–143. IEEE.
Rinaldi, A. M. (2014). A multimedia ontology model based
on linguistic properties and audio-visual features. In-
formation Sciences, 277:234–246.
Robinson, I., Webber, J., and Eifrem, E. (2013). Graph
databases. ” O’Reilly Media, Inc.”.
Spence, R. (2001). Information visualization, volume 1.
Springer.
Tutte, W. T. (1963). How to draw a graph. Proc. London
Math. Soc, 13(3):743–768.
Van Bruggen, R. (2014). Learning Neo4j. Packt Publishing
Ltd.
Ware, C. (2012). Information visualization: perception for
design. Elsevier.
Webber, J. (2012). A programmatic introduction to neo4j.
In Proceedings of the 3rd annual conference on Sys-
tems, Programming, and Applications: Software for
Humanity, pages 217–218. ACM.
Wills, G. J. (1997). Nicheworks-interactive visualization of
very large graphs. In Graph Drawing, pages 403–414.
Springer.
Big Graph-based Data Visualization Experiences - The WordNet Case Study
115
