
Quantitative Estimation of Long-living Fluorescent Molecules from
Temporal Fluorescence Intensity Data Corrupted by Nonzero-mean
Noise
Sofia Startceva, Jerome G. Chandraseelan, Ari Visa and Andre S. Ribeiro
Department of Signal Processing, Tampere University of Technology, Tampere, Finland
Keywords: Fluorescence-tagged RNA Quantification, Single-molecule Time-lapse Microscopy, Biosignal Processing.
Abstract: We present a new quantitative method of estimation of fluorescent molecule numbers from time-lapse,
single-cell, fluorescence microscopy data. Its main aim is to eradicate backward propagation of noise, which
is present in previous methods. The method is first validated using Monte Carlo simulations. These tests
show that when the time-lapse data are corrupted with negative noise, the method obtains significantly more
precise results than current techniques. The applicability of the method is demonstrated on novel time-lapse,
single-cell measurements of fluorescently tagged ribonucleic acid (RNA) molecules. Interestingly, we find
that the intervals inferred by the new method have the same mean but reduced variability when compared to
the previously existing method, which, in accordance to human observers, is a more accurate estimation.
1 INTRODUCTION
Gene expression is a complex, multi-step process
(McClure, 1985; Lutz and Bujard, 1997; DeHaseth
et al., 1998; Yarchuk et al., 1992; Wen et al., 2008;
Zhang et al., 2014). In addition, the underlying steps
of this process are stochastic in nature, generating a
variability in RNA and protein numbers that mostly
explains the phenotypic diversity of monoclonal cell
populations (McAdams and Arkin, 1997; Elowitz et
al., 2002; Rao et al., 2002; Raser and O’Shea, 2005).
To study this process, specialised techniques in
molecular biology (Golding and Cox, 2004; Yu et
al., 2006), microscopy (Rutter et al., 1998;
Chowdhury et al., 2012), image analysis
(Chowdhury et al. 2013; Häkkinen et al., 2013),
computational biology (Zhu et al., 2007) and signal
processing (Häkkinen and Ribeiro, 2014) were
developed.
Methods of signal processing should consider the
characteristics of the underlying processes. For
example, in the RNA tracking technique based on
MS2-GFP tagging, the MS2-GFP proteins
(composed of the bacteriophage MS2 coat protein
fused to the GFPmut3 protein (Golding et al., 2005))
bind to multiple MS2 binding sites of the target
RNA soon after its production, and once formed,
those RNA-MS2-GFP complexes remain in a cell
for the duration of the experiment (Golding and Cox,
2004; Muthukrishnan et al., 2012). Thus, in this
case, when estimating the numbers of target RNAs,
any signal reduction can be classified as noise.
Since complexes can co-localize, the number of
target RNAs in each cell is estimated from the total
fluorescence of the complexes at a given moment
(Golding and Cox, 2004; Kandhavelu et al., 2012;
Häkkinen and Ribeiro, 2014). However, the signal
can be disrupted (i.e. subject to nonzero-mean
noise), which hampers an exact determination of
fluorescent molecules’ numbers. That is, though the
number of RNA-MS2-GFP complexes in a cell is
considered as a monotonic non-decreasing function
during the experiment (Muthukrishnan et al., 2012),
the total fluorescence intensity of the tagged RNA
molecules can decrease, transiently or permanently,
in the course of an experiment. These decreases are
usually caused by the RNA complexes moving away
from the focal plane, or as a result of
photobleaching. While the latter corrupts the data
permanently, the former are isolated events in single
cell time series and usually cause a steep, transient
decrease in the fluorescence intensity of tagged
RNA molecules.
Here, we present a new quantitative method of
estimation of fluorescent molecule numbers from
single-cell fluorescent intensity data obtained by
Startceva S., Chandraseelan J., Visa A. and Ribeiro A.
Quantitative Estimation of Long-living Fluorescent Molecules from Temporal Fluorescence Intensity Data Corrupted by Nonzero-mean Noise.
DOI: 10.5220/0005605900170024
In Proceedings of the 9th International Joint Conference on Biomedical Engineering Systems and Technologies (BIOSIGNALS 2016), pages 17-24
ISBN: 978-989-758-170-0
Copyright
c
2016 by SCITEPRESS – Science and Technology Publications, Lda. All rights reserved
17

time-lapse microscopy. The method aims to
eliminate backward noise propagation, caused by
molecules ‘moving out of focus’, which currently is
one of the main sources of noise in the estimation of
the numbers of fluorescent molecules from time-
lapse, live cell images.
2 METHODS
The technique of RNA detection by MS2-GFP
tagging allows observing individual RNA molecules
in live cells, soon after they are transcribed (Golding
et al., 2005). In order to extract information from the
images in an automated fashion, it is necessary to
detect the tagged RNA molecules, which appear as
bright spots in the image. Then, the intensity of the
spots is extracted and summed, so as to obtain the
“total RNA intensity signal” in a cell, at a given
point in time.
This RNA intensity signal from non-degradable
fluorescent tagged RNA molecules contains noise
accumulated through each step of signal registration
(microscope settings, image registration and image
processing). From observation of the data
(Muthukrishnan et al., 2012; Kandhavelu et al.,
2012; Häkkinen et al., 2014), we assume that the
signal behaves as a monotonic non-decreasing
function corrupted with three types of noise:
1. Consistent, normally distributed independent
noise (probability of occurrence
= 1), with zero
mean and given standard deviation, which is
introduced by imprecisions of the microscope and
detector (Chowdhury et al., 2012; Waters, 2009).
2. Negative noise, which in our measurements
corresponds to fluorescent molecules moving out of
focus and remaining there for a certain amount of
time. Probabilities
of going out of focus and
of returning to focus depends, e.g., on the type
of fluorescent molecule, temperature, etc.
3. Inconsistent positive noise (low probability of
occurrence,
<0.01), caused, for instance, by
false-positive detection of fluorescent molecules.
These events are independent from each other, so the
probability of occurring n times is
, which is
negligible for ≥3. Note that, the limit value of p
3
is set by empirical observations that these events are
rare.
2.1 Previous Computational Methods
In (Häkkinen and Ribeiro, 2014), a method was
proposed for estimating RNA numbers and
production intervals from temporal data of tagged
RNAs fluorescence intensity in individual cells. This
method, here denominated as a ‘reference method’,
has three steps. First, a monotonically increasing
curve is fitted to the time series, and temporal
information on related samples is extracted. Second,
the intensity of a single fluorescent molecule, or a
‘jump size’, is estimated from the information
obtained at the first step. In the third and final step, a
quantized curve is fit to the time series, given the
parameters, enforcing the quantization to the fit.
From this, the RNA numbers are extracted.
The third step in (Häkkinen and Ribeiro, 2014)
goes as follows. Given the jump size, time series are
fitted quantitatively, and the fit obtained is an
estimation of the number of fluorescent molecules.
For the fits performed throughout the method,
one can use least squares (LSQ) or least absolute
deviations (LD) fitting. The LD was found to be
more robust to signal disruptions.
In order to exploit the characteristics of the
empirical data, this method assumes that all
fluorescent molecules have the same intensity and
that, once formed, they do not degrade before the
end of the measurements (experimental evidence for
this assumption is provided in (Muthukrishnan et al.,
2012)). The first assumption is equivalent to
assuming that the jump size is a constant. The
second assumption corresponds to forbidding non-
monotonic behaviour of quantitative estimation of
the molecules over time.
This method fits full time series to a curve in one
step, which aids in eliminating a consistent zero-
mean noise, but also allows a backward propagation
of any inconsistent disruption of the signal. Hence,
although this method fully addresses the problems of
the first and the third types of noise described in the
Methods section, the problem of the second type of
noise is addressed only to a limited extent (a
fluorescent molecule is detectable only if it is in
focus for at least more than 50% of the time series
length).
2.2 Experimental Methods
2.2.1 Cells, Plasmids, Chemicals and Media
For live, single cell, time-lapse measurements of the
RNA production times, the MS2d-GFP tagging
system was used. Fluorescent RNA-MS2d-GFP
complexes were observed in Escherichia coli DH5α-
PRO strain (generously provided by Ido Golding,
University of Illinois, IL). The strain contains a
single copy plasmid (coding for the RNA with 96
MS2d binding sites under the control of the
BIOSIGNALS 2016 - 9th International Conference on Bio-inspired Systems and Signal Processing
18

promoter P
lac
) and a high-copy reporter plasmid
coding for MS2d-GFP under the control of the
promoter P
LtetO-1
(Golding and Cox, 2004).
For growth media, we used the following
composition per 100 ml: 1.5 g tryptone, 0.75 g yeast
extract and 1 g NaCl (pH of 7.0). Media components
were purchased from LabM (UK), while antibiotics,
Isopropyl b-D-1-thiogalactopyranoside (IPTG),
arabinose, and anhydrotetracycline (aTc) are from
Sigma-Aldrich (USA).
2.2.2 Cell Growth and Microscopy
Cells from the DH5α-PRO strain, containing the
target and the reporter plasmids, were grown
overnight, diluted into fresh media to an OD
600
of
0.1 (measured with an Ultraspec 10 cell density
meter), and allowed to grow to an OD
600
of ~0.3. For
the reporter plasmid induction, aTc (100 ng/ml) was
added 1 h before the start of the measurements. For
the target plasmid, IPTG (1mM) was added 10 min
before the start of the measurements. Cells were
pelleted and resuspended into fresh medium. A few
µl of the cells were placed between a coverslip and
an agarose gel pad (2%), containing the respective
inducers, in a thermal imaging chamber (FCS2,
Bioptechs), heated to 37
o
C. The cells were
visualized using a Nikon Eclipse (Ti-E, Nikon,
Japan) inverted microscope with a C2+ confocal
laser-scanning system using a 100x Apo TIRF
objective. Images were acquired using the Nikon
Nis-Elements software. GFP fluorescence was
measured using a 488 nm argon ion laser (Melles-
Griot) and 514/30 nm emission filter. Phase contrast
images were acquired with an external phase
contrast system and a Nikon DS-Fi2 camera.
Fluorescence images were acquired every 1 min for
2 hours. Phase-contrast images were acquired every
5 min.
2.2.3 Image Analysis
Figure 1. Panel A and B exemplify phase contrast and
confocal images, correspondingly, of the same cells. Panel
C shows masks of those cells and their fluorescent spots.
Cells were detected from phase contrast images as in
(Gupta et al., 2014). First, the images were
temporally aligned using cross-correlation. Next, an
automatic segmentation of the cells was obtained
with MAMLE (Chowdhury et al., 2013). The results
were corrected manually. Cell lineages were
constructed by CellAging (Häkkinen et al., 2013).
Alignment of the phase contrast images with the
confocal images was done by manually selecting 5-7
landmarks in both images, and using thin-plate
spline interpolation for the registration transform.
After the registration, the cell masks were adjusted
to the borders of corresponding cells from the
confocal images based on the fluorescent intensity.
Finally, fluorescent spots and their intensities were
detected from confocal images using a Gaussian
surface-fitting algorithm from (Häkkinen et al.,
2014). Examples of original images and obtained
masks are shown in Figure 1.
3 RESULTS
3.1 Algorithm
Our algorithm for the quantitative estimation of
fluorescent molecules from the data is described in
Figure 2.
3.1.1 Initial Parameters
To obtain the intensity of one fluorescent molecule,
, we combine the first two steps of the ‘reference
method’ in their original form with visual inspection
of the time series of fluorescence intensity. Other
methodologies could be used instead.
To account for positive noise (type 3 noise), the
‘trusted interval’, , is introduced. If an increase in
intensity persists for frames, then we assume that
this increase is not due to noise. Otherwise, the
assumption that it is positive noise cannot be
rejected.
The choice of the value of is based on the
standard deviation σ of a consistent noise (type 1).
The optimum value of rises with the increase of σ
(Figure 4). Also, we found by inspection that, to be
resistant to the type 3 noise, should not be smaller
than 5 data points.
The parameter is introduced to account for
deviations in the mean of type 1 noise. The
exploration of the parameter space of the fit
(Figure 4) shows that, for a signal without a
consistent non-zero mean noise, ≈ 0.25 is an
optimal value. However, the optimal increases up
to 0.4 in the case of fitting a signal with σ=2.
Quantitative Estimation of Long-living Fluorescent Molecules from Temporal Fluorescence Intensity Data Corrupted by Nonzero-mean
Noise
19
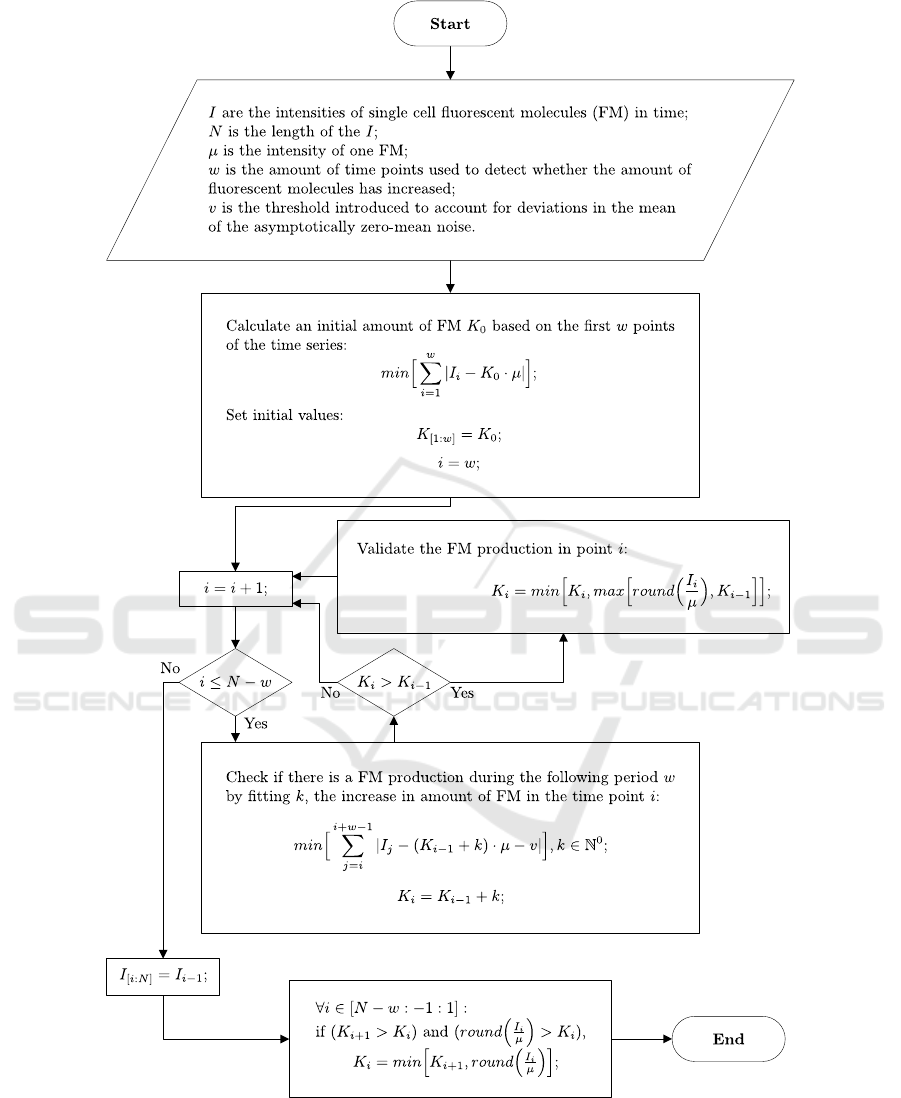
Figure 2: Algorithm used for the quantization of fluorescent molecules.
3.1.2 Computational Procedure
The procedure of the algorithm can be represented
as a set of interval-fitting events. Each interval has
length , the values of each fit at each time point are
a constant proportional to , the fit is performed
using least absolute deviations and, the coefficient of
proportion of the best fit is an initial estimate of
BIOSIGNALS 2016 - 9th International Conference on Bio-inspired Systems and Signal Processing
20
the amount of fluorescent molecules. Given this,
first, we estimate the amount of fluorescent
molecules in the first time points. For each
following data point
, where <≤−, the
fit is performed. If
>
, then the estimated
amount of fluorescent molecules at time point
is
the maximum value of the estimated amount
(
⁄)
at
, and the estimated amount
at
.
Since it is not possible to determine whether any
increase in the signal at the time points [ − +
1: ] is caused by noise or by the production of
fluorescent molecules, no estimation is performed on
this interval.
Finally, the obtained time series of estimated
amounts of fluorescent molecules are checked at
each time point (from to 1). If
(
>
)
and
((
/) >
) are true,
is set to
(
, (
/)). We note that the
production events at these moments were not
detected during the fitting procedure because of the
local disruptions of the signal in subsequent
moments.
3.2 Analysis of in Silico Data
Monte Carlo simulations were performed using a
model of transcription that assumes that RNA
molecules are produced in exponentially distributed
intervals (with mean interval of 15 min
(Muthukrishnan et al., 2012)). The sampling
frequency ƒ used is 10 sec
-1
and 1 min
-1
, for
comparison.
The obtained time series are then corrupted by
adding zero-mean independent and normally
distributed noise. To introduce significant, transient
disruptions of the signal (i.e. to model RNA-MS2d-
GFP complexes going out of focus), we set the RNA
signal to zero at random moments, for a randomly
selected duration. For that, we set the probability
that an RNA goes out of focus to
=60 min
-1
and the probability of the zeroed RNA to be fully
recovered to
=20 min
-1
.
In Figure 3 we exemplify the outcome of
simulating the model for 120 min.
We use this model’s ground truth data to test the
accuracy of the RNA numbers estimation by our
method. To quantify the accuracy, we define it to be
the proportion of time moments where the RNA
numbers in a cell were correctly detected (Häkkinen
and Ribeiro 2014).
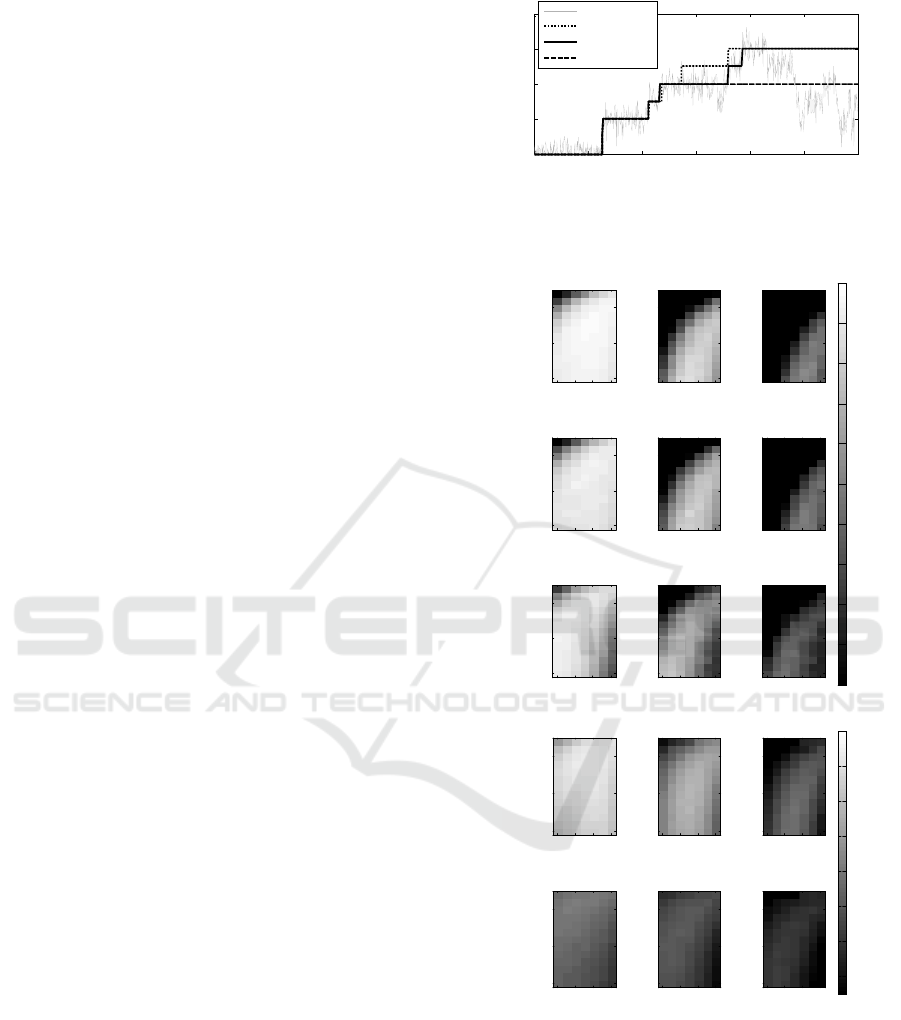
First, the parameter space of the proposed model
was investigated in order to detect a combination of
values of and that maximize the accuracy.
Figure 3: Simulated data. ƒ=10sec
-1
. = 0.5. p
=
60min
-1
and p
=20min
-1
, = 8, = 0.25.
Figure 4: Mean accuracy along the parameter space of
and for = 0.5, = 1, and = 2. In panel A, ƒ=
10sec
-1
and in panel B, ƒ=1min
-1
. In both panels, from a-
c: p
=0 min
-1
and p
=0min
-1
; from d-f: p
=
60min
-1
and p
=20min
-1
; from g-i: 25% time series
points were randomly selected and set to zero. In all sub-
panels of panel A and in sub-panels a-c of panel B, each
accuracy value is a mean of 1000 simulations. In sub
panels d-f of panel B, each accuracy value is a mean of
2500 simulations.
0 20 40 60 80 100 120
0
2
4
6
8
time (min)
Intensity (RNAs)
Intensity
RNA
w = 8, v = 0.25
Reference LD
σ
= 0.5
v
w
a
A
0 0.2 0.4 0.6
5
10
15
σ
= 1
v
w
b
0 0.2 0.4 0.6
5
10
15
σ
= 2
v
w
c
0 0.2 0.4 0.6
5
10
15
σ
= 0.5
v
w
d
0 0.2 0.4 0.6
5
10
15
σ
= 1
v
w
e
0 0.2 0.4 0.6
5
10
15
σ
= 2
v
w
f
0 0.2 0.4 0.6
5
10
15
σ
= 0.5
v
w
g
0 0.2 0.4 0.6
5
10
15
σ
= 1
v
w
h
0 0.2 0.4 0.6
5
10
15
σ
= 2
v
w
i
0 0.2 0.4 0.6
5
10
15
0.5
0.55
0.6
0.65
0.7
0.75
0.8
0.85
0.9
0.95
1
σ
= 0.5
v
w
a
B
0 0.2 0.4 0.6
5
10
15
σ
= 1
v
w
b
0 0.2 0.4 0.6
5
10
15
σ
= 2
v
w
c
0 0.2 0.4 0.6
5
10
15
σ
= 0.5
v
w
d
0 0.2 0.4 0.6
5
10
15
σ
= 1
v
w
e
0 0.2 0.4 0.6
5
10
15
σ
= 2
v
w
f
0 0.2 0.4 0.6
5
10
15
0.3
0.4
0.5
0.6
0.7
0.8
0.9
1
Quantitative Estimation of Long-living Fluorescent Molecules from Temporal Fluorescence Intensity Data Corrupted by Nonzero-mean
Noise
21

For that, we performed a set of at least 1000
simulations for each combination of values of , in
the range [0, 0.6], and w, in the range [3, 15] for
= 0.5, 1, 2 for each of the following sets of
parameter values: a) p
=0 min
-1
, p
=0 min
-
1
(ƒ=10 sec
-1
and ƒ=1 min
-1
); b) p
=60 min
-
1
, p
=20 min
-1
(ƒ=10 sec
-1
and ƒ=1 min
-1
);
and c) 25% time series points randomly selected and
set to zero (ƒ=10 sec
-1
). Results are shown in
Figure 4.
From Figure 4, depends on the variation of
of the consistent noise (namely, as it increases
monotonically with increasing ), whereas
depends on the mean consistent noise (which
becomes negative due to zeroing 25% of the time
moments). Also, the optimal trusted interval
suffered only a slight reduction with a sixfold
decrease of the sampling frequency,
ƒ.
In addition, we found that for = 0, 0.5, 1,
1.5, 2 and ƒ=10 sec
-1
, we obtain
=
5, 7, 13, 13, 13, respectively. Meanwhile, for ƒ=1
min
-1
, we obtain
= 5, 5, 10, 10, 12,
respectively. Finally, we found that the optimal ≈
0.25.
Figure 5: Mean accuracy of the counting of fluorescent
molecules using a given method (Opt, Avg, or Ref) with a
given noise model (1, 2, or 3) from STD of zero-mean
noise. Panel A: ƒ=10sec
-1
; panel B: ƒ=1min
-1
. Opt is
the proposed method with =
; Avg is the proposed
method with = 10(panel A) and = 8(panel B); Ref
is the reference method. In case 1, p
=0min
-1
and
p
=0min
-1
. In case 2, p
=60min
-1
and p
=
20min
-1
. In case 3, 25% of the data points are randomly
selected and set to zero. Each accuracy value is a mean of
10000 simulations (using = 0.2in case 3 and =
0.25otherwise).
Next, we analysed the simulated data with and
without going-out-of-focus events using the
proposed method and the LD version of the
reference method, and compared their accuracies.
In particular, we measured the accuracy of our
method for = 0, 0.5, 1, 1.5, 2, along with an
optimal (‘Opt’ method) as well as with a mean w
(‘Avg’ method), in order to study the impact of this
parameter as a function of . An estimated optimal
was chosen separately for data with zero-mean noise
and for data with negative-mean noise. Also, we
measured the accuracy of the reference method
(‘Ref’) on the same data, for comparison.
From Figure 5, in general, the proposed method
has higher precision when analysing data with out-
of-focus events (i.e. is more robust to type 2 noise).
For =0.5, its accuracy is improved from 49.1% to
67.6% for ƒ=10 sec
-1
, and from 47.7% to 60.1%
for ƒ=1 min
-1
. However, our method is less robust
to type 1 noise, which is expected because the data is
processed piecewise.
Also from Figure 5, note how the precision is
lowered for mean versus optimal . This
difference in precision increases with increasing .
Finally, we made use of the in silico data to
assess the timing of the proposed algorithm. For this,
we measured the time required to analyse 10000
simulated time series with ƒ=1 min
-1
, = 1,
=60 min
-1
,
=20 min
-1
, and length of
120 min. For w=4, 8, 16 the duration was 16 s, 12 s,
and 10 s respectively (processor Intel Core i5-2400,
3.10GHz), while v does not have a noticeable impact
on the time length of this process.
3.3 Analysis of Empirical Data
We next applied our method to empirical data,
obtained as described in the methods section. This
data was processed using our method and the
reference method, for comparison (Table 1). The
fluorescent RNA complexes have a non-negligible
tendency to go out of focus, which makes it possible
to demonstrate the usefulness of the proposed
method.
Table 1: Comparative analysis of the mean and variability
of the intervals between consecutive RNA production
events obtained by our method (w=8, v = 0.25) and the
reference method. The data was collected from 178 cells.
Method No.
intervals
Mean
interval
Interval
CV
2
Our method 158 1047 1.15
Ref. method 153 1018 1.43
From the Table 1, the two methods differ in
performance. Namely, while the two methods infer
similar mean intervals between transcription events
(the new method detected 3% more intervals), the
BIOSIGNALS 2016 - 9th International Conference on Bio-inspired Systems and Signal Processing
22

CV
2
of those intervals duration is significantly
smaller when using the new method (19.6%
smaller). Inspection of the data by two expert human
observers indicated that the new method’s detection
process was the more accurate one (see example
Figure 6).
Figure 6: Example intensity series and estimated RNA
numbers with the proposed method (=8, = 0.25),
and with the reference method (LD version).
4 CONCLUSIONS
Here we proposed a new method for the quantitative
estimation of fluorescent molecules from temporal
intensity microscopy data. This method was
developed to handle transient, nonzero-mean noise
in the data, i.e. it aims to cope with temporary
absences of fluorescent molecules from the focal
plane in time-lapse microscopy measurements. This
is particularly important in studies requiring a
consistent tracking of tagged molecules, such as
studies of, e.g., chemotaxis mechanisms which rely
on chemoreceptor clusters (Sourjik and Berg, 2004;
Wadhams and Armitage, 2004; Parkinson et al.,
2005; Kentner and Sourjik, 2006) and protein
aggregates’ accumulation, which is associated with
cellular aging processes (Maisonneuve et al., 2008;
Tyedmers et al., 2010; Winkler et al., 2010; Lindner
et al., 2008; Gupta et al., 2014; Lloyd-Price et al.,
2012).
We validated our method by tests on in silico
data. Next, we applied it to empirical data to show
that its results can differ from those of the previous
method. By inspection, we found, as expected, that
the reason why the results of the two methods differ
is the enhanced robustness of our method to
‘negative’, inconsistent noise. Another reason is its
weaker robustness to consistent, type 1 noise.
The causes of the two main differences are that,
in the new method: i) previous values of a tagged
RNA intensity confine the next ones into boundaries
defined by the known properties of the signal. The
main benefit of this is that it restricts backward
propagation of inconsistent noise, which results in
more precise results when p
>0; ii) the
stepwise analysis of the signal hampers the removal
of consistent zero-mean noise.
We expect our method to be of use to a broad
range of time-lapse microscopy measurements
making use of fluorescence molecules in live cells,
particular when the phenomenon of moving out of
the focus plane is common for those molecules.
ACKNOWLEDGEMENTS
Work supported by TUT’s Graduate School (SS)
and Academy of Finland (257603, ASR). The
funders had no role in study design, data collection
and analysis, decision to publish, or preparation of
the manuscript.
REFERENCES
Chowdhury, S. et al., 2012. An interacting multiple model
filter-based autofocus strategy for confocal time-lapse
microscopy. J.Microscopy, 245, pp.265–75.
Chowdhury, S. et al., 2013. Cell segmentation by multi-
resolution analysis and maximum likelihood
estimation (MAMLE). BMC Bioinformatics, 14 (Suppl
10), p.S8.
DeHaseth, P.L., Zupancic, M.L. and Record, M.T., 1998.
RNA polymerase-promoter interactions: The comings
and goings of RNA polymerase. J Bacteriology,
180(12), pp.3019–25.
Elowitz, M.B. et al., 2002. Stochastic gene expression in a
single cell. Science, 297(5584), pp.1183–6.
Golding, I. et al., 2005. Real-time kinetics of gene activity
in individual bacteria. Cell, 123(6), pp.1025–36.
Golding, I. and Cox, E.C., 2004. RNA dynamics in live
Escherichia coli cells. Proc. of the National Academy
of Sciences of the USA, 101(31), pp.11310–5.
Gupta, A., Lloyd-Price, J., Neeli-Venkata, R., et al., 2014.
In Vivo Kinetics of Segregation and Polar Retention
of MS2-GFP-RNA Complexes in Escherichia coli.
Biophysical J., 106(9), pp.1928–37.
Gupta, A., Lloyd-Price, J., Oliveira, S.M.D., et al., 2014.
Robustness of the division symmetry in Escherichia
coli and functional consequences of symmetry
breaking. Physical Biology, 11(6), p.066005.
Häkkinen, A. and Ribeiro, A.S., 2014. Estimation of GFP-
tagged RNA numbers from temporal fluorescence
intensity data. Bioinformatics, 31(1), pp.69–75.
Häkkinen, A. et al., 2013. CellAging: A tool to study
segregation and partitioning in division in cell lineages
of Escherichia coli. Bioinformatics, 29(13), pp.1708–9.
Häkkinen, A. et al., 2014. Estimation of fluorescence-
tagged RNA numbers from spot intensities.
Bioinformatics, 30(8), pp.1146–53.
Kandhavelu, M. et al., 2012. Single-molecule dynamics of
transcription of the lar promoter. Physical Biology,
9(2), p.026004.
0 20 40 60 80 100 120
0
2
4
6
time
(
min
)
Intensity (RNAs)
Intensity
w = 8, v = 0.25
Reference LD
Quantitative Estimation of Long-living Fluorescent Molecules from Temporal Fluorescence Intensity Data Corrupted by Nonzero-mean
Noise
23

Kentner, D. and Sourjik, V., 2006. Spatial organization of
the bacterial chemotaxis system. Current Opinion in
Microbiology, 9(6), pp.619–24.
Lindner, A.B. et al., 2008. Asymmetric segregation of
protein aggregates is associated with cellular aging
and rejuvenation. Proc. of the National Academy of
Sciences of the USA, 105(8), pp.3076–81.
Lloyd-Price, J. et al., 2012. Asymmetric disposal of
individual protein aggregates in Escherichia coli, one
aggregate at a time. J.Bacteriology, 194(7), pp.1747–
52.
Lutz, R. and Bujard, H., 1997. Independent and tight
regulation of transcriptional units in Escherichia coli
via the LacR/O, the TetR/O and AraC/I1-I2 regulatory
elements. Nucleic Acids Research, 25(6), pp.1203–10.
Maisonneuve, E., Ezraty, B. and Dukan, S., 2008. Protein
aggregates: An aging factor involved in cell death.
J.Bacteriology, 190(18), pp.6070–5.
McAdams, H.H. and Arkin, A., 1997. Stochastic
mechanisms in gene expression. Proc. of the National
Academy of Sciences of the USA, 94(3), pp.814–9.
McClure, W.R., 1985. Mechanism and control of
transcription initiation in prokaryotes. Ann. Rev. of
Biochemistry, 54, pp.171–204.
Muthukrishnan, A.-B. et al., 2012. Dynamics of
transcription driven by the tetA promoter, one event at
a time, in live Escherichia coli cells. Nucleic Acids
Research, 40(17), pp.8472–83.
Parkinson, J.S., Ames, P. and Studdert, C.A., 2005.
Collaborative signaling by bacterial chemoreceptors.
Current opinion in microbiology, 8(2), pp.116–21.
Rao, C. V, Wolf, D.M. and Arkin, A.P., 2002. Control,
exploitation and tolerance of intracellular noise.
Nature, 420(6912), pp.231–7.
Raser, J.M. and O’Shea, E.K., 2005. Noise in gene
expression: origins, consequences, and control.
Science, 309(5743), pp.2010–3.
Rutter, G.A. et al., 1998. Real-time imaging of gene
expression in single living cells. Chemistry and
biology, 5(11), pp.R285–90.
Sourjik, V. and Berg, H.C., 2004. Functional interactions
between receptors in bacterial chemotaxis. Nature,
428(March), pp.1–4.
Tyedmers, J., Mogk, A. and Bukau, B., 2010. Cellular
strategies for controlling protein aggregation. Nature
rev. Mol. cell biology, 11(11), pp.777–88.
Wadhams, G.H. and Armitage, J.P., 2004. Making sense
of it all: bacterial chemotaxis. Nature rev. Mol. Cell
Biology., 5(12), pp.1024–37.
Waters, J.C., 2009. Accuracy and precision in quantitative
fluorescence microscopy. J.Cell Biology, 185(7),
pp.1135–48.
Wen, J.-D. et al., 2008. Following translation by single
ribosomes one codon at a time. Nature, 452(7187),
pp.598–603.
Winkler, J. et al., 2010. Quantitative and spatio-temporal
features of protein aggregation in Escherichia coli and
consequences on protein quality control and cellular
ageing. The EMBO J., 29(5), pp.910–23.
Yarchuk, O., Guillerez, J. and Dreyfus, M., 1992.
Interdependence of Translation, Transcription
Degradation in the ZacZ Gene and mRNA.
J.Molecular Biology, pp.581–96.
Yu, J. et al., 2006. Probing gene expression in live cells,
one protein molecule at a time. Science, 311(5767),
pp.1600–03.
Zhang, Z. et al., 2014. Single-molecule tracking of the
transcription cycle by sub-second RNA detection.
eLife, 2014(3), pp.1–20.
Zhu, R. et al., 2007. Studying genetic regulatory networks
at the molecular level: Delayed reaction stochastic
models. J. Theoretical Biology, 246(4), pp.725–45.
BIOSIGNALS 2016 - 9th International Conference on Bio-inspired Systems and Signal Processing
24
