
ABLE: An Automated Bacterial Load Estimator for the
Urinoculture Screening
Paolo Andreini, Simone Bonechi, Monica Bianchini, Andrea Garzelli and Alessandro Mecocci
Department of Information Engineering and Mathematics, University of Siena, Via Roma 56, Siena, Italy
Keywords:
Image Classification, Automatic Urinoculture Screening, Urinary Tract Infections.
Abstract:
Urinary Tract Infections (UTIs) are very common in women, babies and the elderly. The most frequent cause
is a bacterium, called Escherichia Coli, which usually lives in the digestive system and in the bowel. Infections
can target the urethra, bladder or kidneys. Traditional analysis methods, based on human experts’ evaluation,
are typically used to diagnose UTIs, an error prone and lengthy process, whereas an early treatment of common
pathologies is fundamental to prevent the infection spreading to kidneys. This paper presents an image based
Automated Bacterial Load Estimator (ABLE) system for the urinoculture screening, that provides quick and
traceable results for UTIs. Infections are accurately detected and the bacterial load is evaluated through image
processing techniques. First, digital color images of the Petri dishes are automatically captured, and cleaned
from noisily elements due to laboratory procedures, then specific spatial clustering algorithms are applied to
isolate the colonies from the culture ground and, finally, an accurate evaluation of the infection severity is
performed. A dataset of 499 urine samples has been used during the experiments and the obtained results are
fully discussed. The ABLE system speeds up the analysis, grants repeatable results, contributes to the process
standardization, and guarantees a significant cost reduction.
1 INTRODUCTION
Urinary Tract Infections (UTIs), together with those
of the respiratory tract, are of great clinical relevance
for the high frequency with which they are found in
common medical practice and because of the com-
plications arising therefrom. UTIs can target the ure-
thra, bladder or kidneys and they are mainly caused by
Gram–negative microorganisms, with a high preva-
lence of Escherichia Coli (E. Coli, 70%) — which
usually lives in the digestive system and in the bowel
—, even if clinical cases frequently occur where com-
plicated infections are caused by Gram–positive or
multi–resistant germs, on which the common antimi-
crobial agents are inevitably ineffective, leading to
therapeutic failures.
The urinoculture is a screening test in the case
of hospitalized patients and pregnant women. In the
standard protocol, the urine sample is seeded on a
Petri dish that holds a culture substrate, used to arti-
ficially recreate the environment required for the bac-
terial growth, and incubated at 37
◦
C overnight. After
the incubation, each dish must be examined by a hu-
man expert, adding some more time to the medical
report output. This common situation significantly
departs from the needs of clinicians to have results
in quick time, to set a targeted therapy, avoiding the
use of broad–spectrum antibiotics and improving the
patient management
1
. Moreover, traditional analysis
methods suffer from further problems, such as pos-
sible errors arising in the visual determination of the
bacterial load — due to the skills and the expertise of
the individualoperator —, anddifficulties in the trace-
ability of samples and results (Ballabio et al., 2010).
Recently, significant improvementsin biology and
medicine applications and decision support systems
(Berlin et al., 2006) have been obtained by using hy-
brid methods, based on a combination of advanced
image processing techniques (Deserno, 2011; Belazzi
et al., 2011), artificial intelligence tools (Agah, 2014;
Heckerling et al., 2007; Bianchini et al., 2013), ma-
chine learning (Bandinelli et al., 2012), expert sys-
tems, fuzzy logic (Torres and Nieto, 2006), genetic al-
gorithms, and Bayesian modelling (Dey et al., 2010).
In particular, the development of automated tools for
results assessment (screening systems) has attracted
increasing research interest during the last decade, be-
cause of their higher repeatability, accuracy, reduced
staff time (that are the main limiting factors of man-
ual screening), and lower costs (Bourbeau and Lede-
1
Rapid reporting is crucial, especially when pediatric
patients are involved, since, in this case, the infection symp-
toms are not always specific, while it is urgent to decide if
an antibiotic therapy is necessary or not and when to start it.
Andreini, P., Bonechi, S., Bianchini, M., Garzelli, A. and Mecocci, A.
ABLE: An Automated Bacterial Load Estimator for the Urinoculture Screening.
DOI: 10.5220/0005687005730580
In Proceedings of the 5th International Conference on Pattern Recognition Applications and Methods (ICPRAM 2016), pages 573-580
ISBN: 978-989-758-173-1
Copyright
c
2016 by SCITEPRESS – Science and Technology Publications, Lda. All rights reserved
573
boer, 2013). Automated urinalysis devices improve
the capacity of the laboratory to screen more samples,
producing results in less time than by manual screen-
ing. Moreover, the redeployment and lower grading of
staff with the increased turnover and speed of urine
screening, gave economic advantages of automated
screening over manual screening (NHS Purchasing
and Supply Agency, 2011).
Even if some interesting research has been carried
out in recent years for the urinoculture screening (An-
dreini et al., 2015), tracing the state–of–the–art in im-
age processing/AI solutions to the automatic analy-
sis of Petri dishes is difficult, since published results
are often related to subtle variations of the core prob-
lem (that ranges from the classification of the infec-
tion type to the evaluation of its severity), pertinent
to various domains (from food and beverage safety
to environmental control and specific clinical analy-
ses (Ogawa et al., 2012; Clarke et al., 2010; Brugger
et al., 2012; Wang, 2011; Chen and Zhang, 2009)),
and based on different datasets.
In this paper, we propose a tool called ABLE (Au-
tomatic Bacterial Load Estimator), that provides a de-
cision support system for biologists. The system auto-
matically gets dish images from a color camera and,
through a suitable preprocessing phase, removes the
non relevant elements, due to laboratory procedures
(such as labels and written text). Then, ABLE im-
plements spatial clustering techniques to isolate the
colonies from the culture ground, even in presence of
ground disuniformities. Thereafter, using the infor-
mation obtained thanks to the background removal,
the system identifies the infected plates, also estab-
lishing their bacterial load. Finally, ABLE is capable
to reveal the presence of multiple infections grown on
the same dish, to alarm the analyst for contamination.
The ABLE system allows a substantial speedup of
the whole procedure, besides avoiding the continu-
ous transition between sterile and external environ-
ments. The final outcomes are directly stored along
with the related analysis records (the image, the type
of infection — unique or multiple —, and the colony
count). Data used during experiments have been pro-
vided by DIESSE Ricerche Srl, Siena. Preliminary
experiments show very promising results.
The paper is organized as follows. In Section
2, the procedure adopted to remove the noisily ele-
ments from images is described. Section 3 presents
the background subtraction system and the method
used to decide if a sample is infected or not, to eval-
uate the bacterial load; the procedure for establish-
ing the number of different infections contemporary
grown on the same plate is also illustrated. Finally,
Section 4 collects experimental results, whereas con-
clusions are drawn in Section 5.
2 PREPROCESSING
In general, the plate–handling process requires some
ancillary data that are added on the plate after the
urinoculture seeding procedure (for instance, a writ-
ten text with the manufacturer name, a label for pa-
tients traceability, etc.). The plates, used in this
work, contain written text on the background for the
type of culture ground (Agar chromID CPS) and the
bioMérieux trademark. Moreover, a label is pasted
underneath with the patient name and a bar code (see
Fig. 1). These elements negatively affect the clas-
sification process and must be removed. They have
a fixed shape and dimension, but their position can
change from image to image.
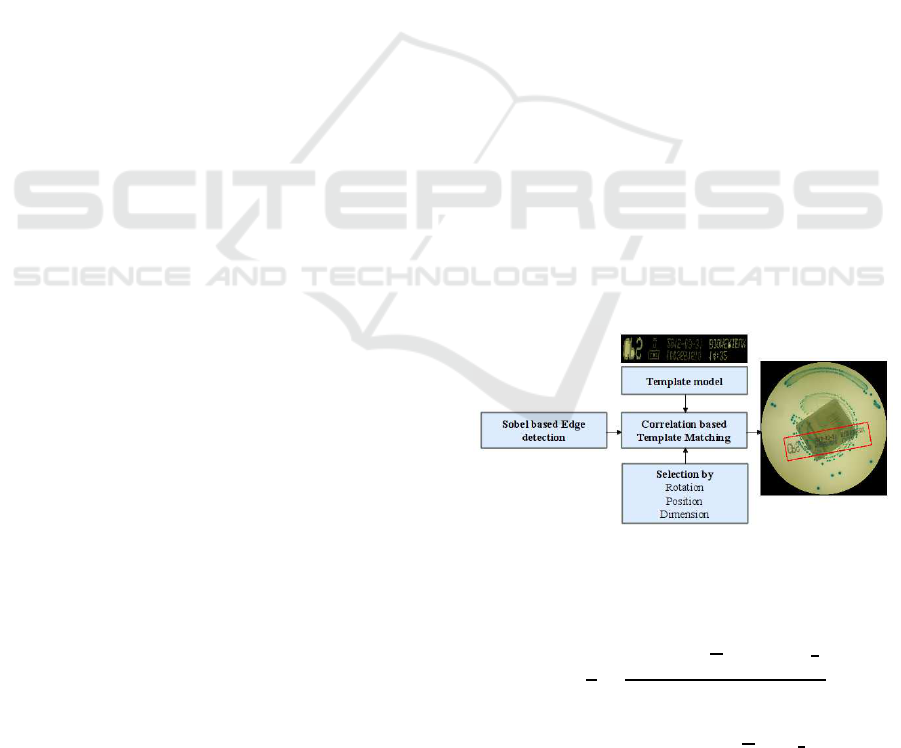
2.1 Written Text Removal
To remove the text, a first problem to be solved is its
precise localization inside the image. We have used a
template matching approach, based on a sample of the
written text manually extracted from an almost empty
plate (see Fig. 1). Being the text fixed, the manual op-
eration needs to be performed only once, at the very
beginning of the preprocessing phase (thereafter it is
stored in the system). Gradient variations (based on
Sobel filtering (Gonzalez and Woods, 2008) proce-
dure) were evaluated to guarantee independence from
light alterations.
Figure 1: Written text removal scheme.
Normalized Cross Correlation (NCC) (Ahuja and
Tuli, 2013) has been used to detect the text position:
R(x,y) =
1
n
∑
x,y
f (x, y) −
f
(t (x, y) − t)
σ
f
σ
t
where n is the number of pixels in t(x,y) (the tem-
plate) and in f(x,y) (the image),
f, σ
f
, t and σ
t
are,
respectively, the average and the standard deviation of
f and t. While the text appearance is fixed (and can be
stored), its rotation is not, and must be compensated.
ICPRAM 2016 - International Conference on Pattern Recognition Applications and Methods
574
To this end, different rotated versions of the acquired
template are applied to the image and the best match is
selected. To speed up the process, the template search
area is limited to a subpart of the whole image. In
fact, the text printing process grants some tolerance
limits to the positional variability (e.g., the distance
between the text position and the image center cannot
exceed a certain threshold).
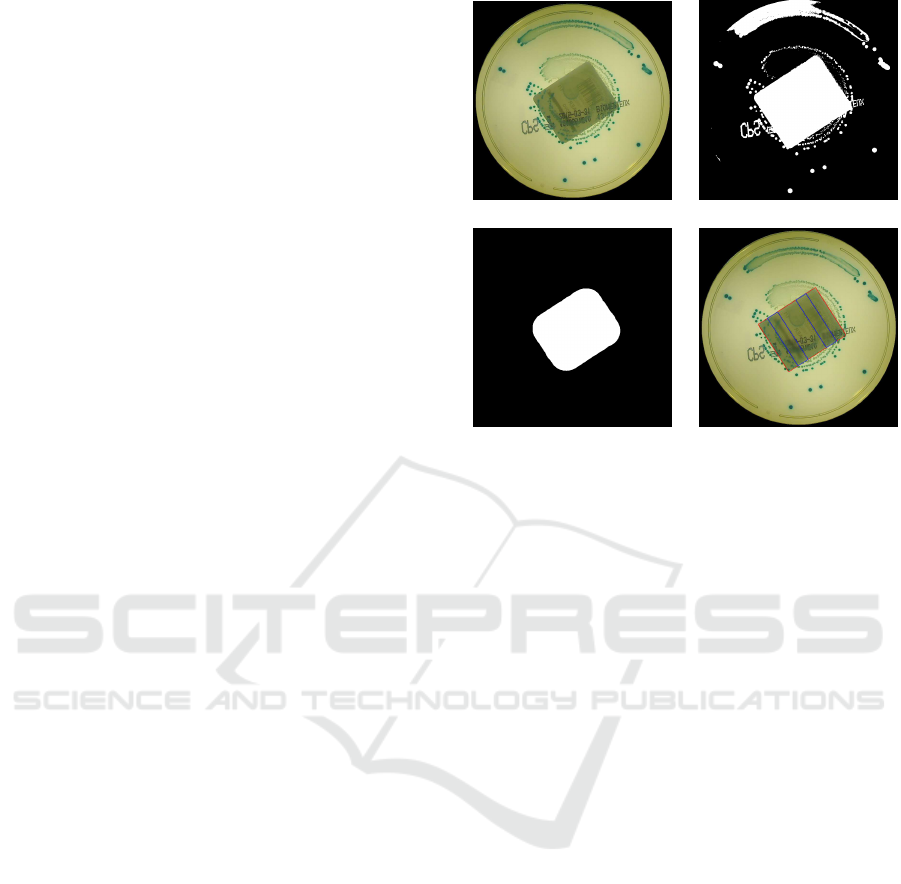
2.2 Label Removal
The next preprocessing step aims at removing the area
occupied by the label, attached under the plate. The
image acquisition device uses back lighting, so that
the light passes through the semi–transparent culture
ground and the label, and the latter absorbs the most
of the light. As a result, the label area is always darker
than the surroundings. To segregate the label, we
use an adaptive threshold obtained by applying the
Otsu’s method (Otsu, 1979) to the image luminance
(Fig. 2 (b)). The binary mask gained after thresh-
olding contains the darkest regions in the plate (some
colonies and the label). A morphological opening is
then used to regularize the mask shape, based on a
circular structuring element, with a diameter slightly
smaller than the shortest label side. In this way, bac-
terial colonies and other artifacts, smaller than the la-
bel, are removed (Fig. 2 (c)). Finally, the minimum
perimeter rectangle of the largest connected compo-
nent is computed, recoveringthe label position. Pixels
belonging to this rectangle are disregarded during fur-
ther processing steps. Moreover, the patients’ name
is blurred by applying a severe smoothing on some
fixed positions relative to the detected label, in order
to work without worrying about privacy issues (Fig. 2
(d)).
3 INFECTED PLATE DETECTION
The main requirement for ABLE has been that of cor-
rectly identifying positive samples. In general, the
number of negative samples is greater than that of
positive samples (more than 60% are negative results)
(Broerm et al., 2011). Moreover, negative samples
have small clinical relevance since, generally, they do
not need further examination. So, for a biological
laboratory, a highly accurate classification into pos-
itive and negative cases represents a large workload
reduction. Usually, a plate can be considered posi-
tive if the number of microorganisms per milliliter of
urine exceeds 10
5
. Our dataset samples were seeded
using a bioMérieux Previ Isola automated agar plate
inoculation system. This device starts from a fixed
(a) (b)
(c) (d)
Figure 2: In (a), the original image; in (b), the mask ob-
tained with Otsu thresholding; in (c), the result of morpho-
logical opening; in (d), the red rectangle shows the label,
and the blue rectangles show those parts that were blurred.
point and circularly spreads the urine sample over the
whole plate: more serious is the infection, the greater
is the angle between the starting point and the last
colony grown on the plate. If the angle is wider than
180 degrees, then the sample is considered to be posi-
tive (Rice and Baruch, 2009). To identify the spread–
angle, the bacterial colonies must be segregated from
the culture ground.
3.1 Color Space Analysis
Since a chromogenic medium is used as the ground
seed, the pixel color is one of the most important
feature to distinguish the bacterial colonies from the
background. Therefore, preliminarily, the distribu-
tion of background colors has been analyzed in four
different color spaces (i.e., RGB, HSV, CIE–Lab, and
YCrCb). A supervised training procedure has been
adopted, during which a human expert selected about
80 different regions belonging to the background
and to the foreground. The same sample regions,
extracted from a subset which was not employed in
the testing phase, have been used also for training the
Gaussian mixture models (see Sections 3.2 and 3.4).
The chromatic components of the pixels belonging
to such regions are accumulated to represent the
typical background and foreground chromatic values.
The Dunn’s Index (DI) has been used to give a
quantitative rank (based on the Centroid Linkage
distance and the Centroid Diameter dispersion):
ABLE: An Automated Bacterial Load Estimator for the Urinoculture Screening
575
DI(X) =
min
1≤i≤ j≤k
d(C
i
,C
j
)
max
1≤s≤k
{∆(C
s
)}
d(C
i
,C
j
) ,
1
|C
i
|+|C
j
|
∑
~c∈C
i
d(~c, µ
j
) +
∑
~c∈C
j
d(~c, µ
i
)
µ
i
,
1
|C
i
|
∑
~c∈C
i
~c
∆(C
i
) ,
∑
~c∈C
i
d(~c,µ
i
)
|C
i
|
!
where X represents the color space where DI is
calculated, ~c is the chromatic vector of each pixel, k
is the number of clusters, d(C
i
,C
j
) is a dissimilarity
function between two clusters C
i
and C
j
, ∆(C
i
) is the
mean distance of all the points from the mean, and µ
i
is the mean of cluster i. DI is higher in the CIE–Lab
space, which indicates a better clustering ability com-
pared with the other color spaces. The same conclu-
sion can be achieved by visually analyzing the color
distribution in the four different spaces (Fig. 3).
(a) (b)
(c) (d)
Figure 3: Typical foreground elements are represented with
their own colors, whereas the typical background color is
plotted in blue. The scatter plots in (a), (b), (c) and (d)
represent, respectively, the color distribution in the HSV,
CIE–Lab, RGB and YCrCb color spaces.
3.2 Background Subtraction
Although the acquisition device uses a controlled illu-
mination system, the effect of agar dishomogeneities,
and of light disturbances from the external environ-
ment, produces relevant brightness variations in the
background. Therefore, only the (a, b) chromatic
components of the CIE–Lab color space have been
used for detecting colonies, in order to gain a robust
representation with respect to lighting changes, shad-
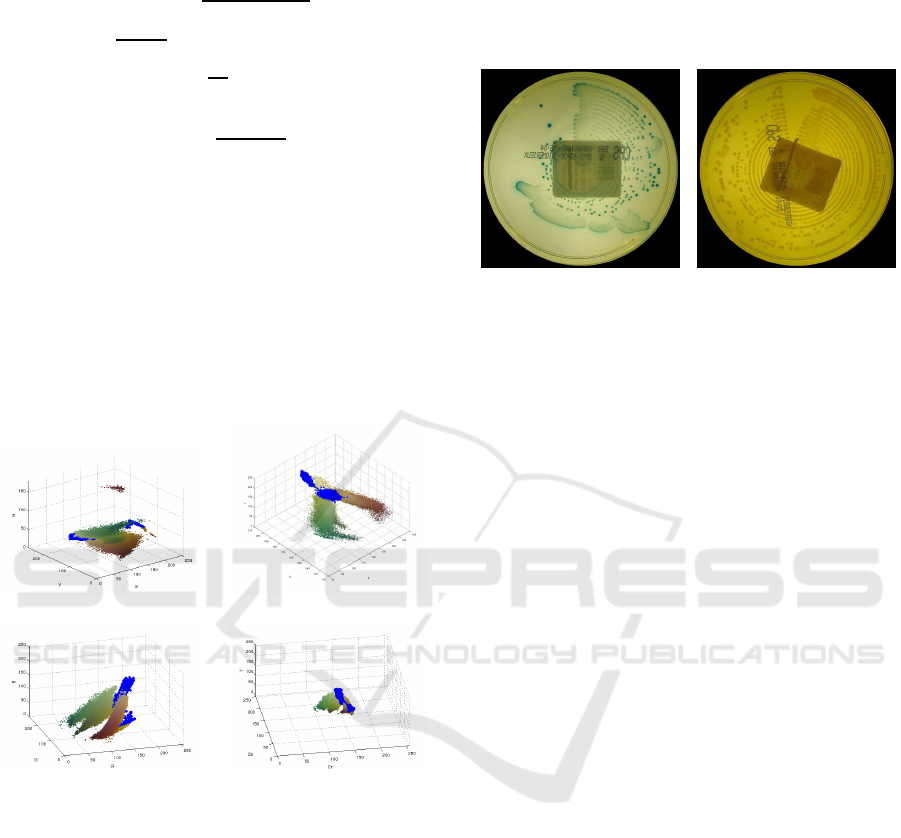
ows and local variations. Moreover, the presence of
some particular type of infections (Proteus Mirabilis)
significantly changes the culture ground appearance
(see Fig. 4). Consequently, the background clearly
shows two different clusters in the CIE–Lab color
space (as evidenced by the two blue areas in Fig. 3).
(a) (b)
Figure 4: In (a), the typical background color and, in (b), the
background appearance changed by the Proteus Mirabilis
infection.
By analyzing the background color samples by
means of the Mardia and Henze–Zirkler normality
tests (Mardia, 1970; Henze and Zirkler, 1990), it has
become evident that a simple Gaussian model is un-
suitable for modeling the two background clusters
(see the contour lines of the background distributions
in Fig. 5). This explains why a Gaussian mixture
model (GMM) has been adopted to describe the cor-
responding multimodal density functions:
p(θ) =
K
∑
i=1
Φ
i
N(µ
i
,Σ
i
)
where θ = (~µ,
~
Σ) collects the mixtures parameters,
whereas the i–th vector component is characterized
by a normal distribution with weight Φ
i
, means µ
i
and covariance matrix Σ
i
. The number of mixture
components has been empirically chosen by observ-
ing the data contour lines, while the Expectation–
Maximization (EM) algorithm has been used to es-
timate the mixture parameters. In Fig. 5, the contour
lines estimated by the model are compared with those
obtained using the original data. A similar approach
has been also applied to the infection detection prob-
lem, as explained in Section 3.4.
The background subtraction procedure is shown
in Fig. 6; a Mean–Shift segmentation algorithm is
used to compensate for local background dishomo-
geneities. For each segment, the (a,b) modal values
are compared with the Gaussian mixture models and,
if the posterior probability of the background is the
greatest one, the correspondingsegment is considered
to be part of the culture ground. Some specific type of
infections cannot be classified by using chromatic in-
formation only, because their color is very similar to
the background. In this case, spatial features (i.e., ob-
tained with edge detection techniques) must be used
ICPRAM 2016 - International Conference on Pattern Recognition Applications and Methods
576
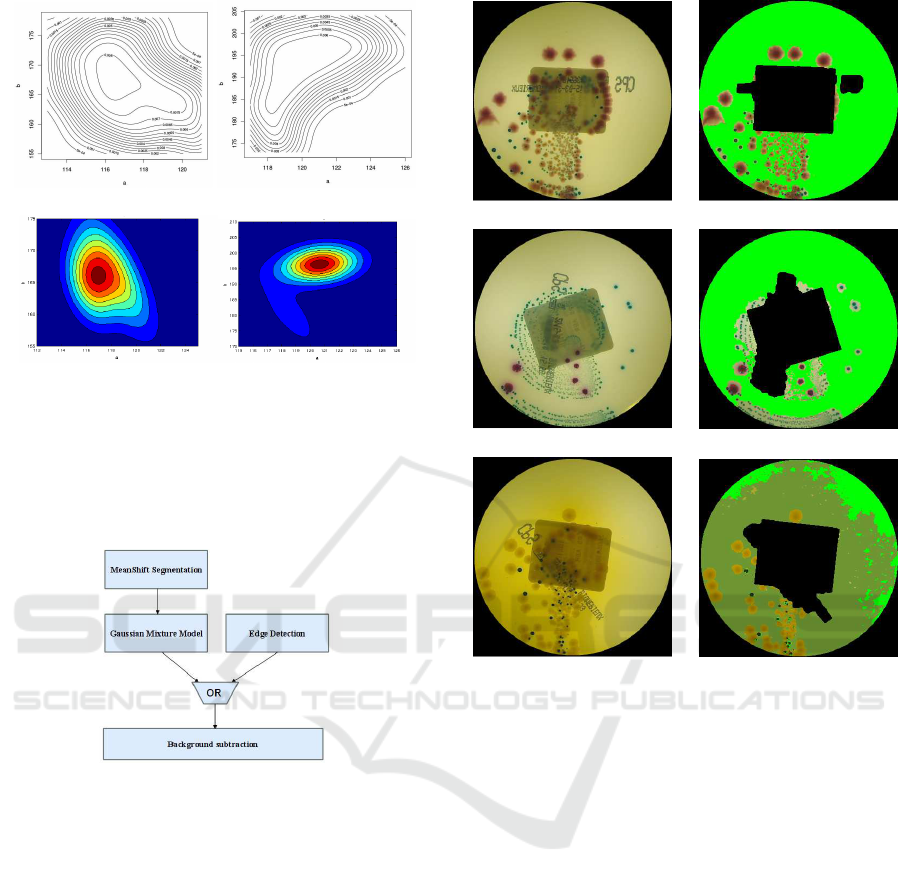
(a) (b)
(c) (d)
Figure 5: In (a) and (b), the contour lines of the two back-
ground models; in (c) and (d), the contour lines estimated
by the mixture model.
to obtain a suitable segmentation performance. In Fig.
7, some results are reported.
Figure 6: Background subtraction scheme.
3.3 Infection Severity Estimation
The angle between the inoculation starting point and
the last colony found on the plate gives an indication
of the infection severity. The plate image is divided
into 64 equiangular sectors. For each sector, the fore-
ground concentration is computed (number of fore-
ground pixels divided by the total number of pixels
in the sector). The sector with the maximum con-
centration is considered as that containing the inoc-
ulation starting point. From the starting sector, the
image is analyzed counter–clockwise (opposite to the
seeding direction) sector by sector, until a not empty
sector is found. This last sector is considered as the
colony proliferation end point. The angle between the
starting point and the end point, in the clockwise di-
rection, is used as a measure of the infection spread–
angle over the plate. If the angle is wider than 180 de-
grees, the sample is considered as positive (infected).
(a) (b)
(c) (d)
(e) (f)
Figure 7: In (a), (c), and (e), some original images; in (b),
(d), and (f), the background subtraction results; the two
background classes are respectively colored in green and
dark green.
Unfortunately, our experiments clearly show that the
spread–angle is not accurate enough to predict the in-
fection severity. In fact, even if a colony spreads over
the whole plate, some sectors within the spread–angle
can be actually empty. To compensate this error, we
simply subtract the angular contribution of the empty
sectors from the estimate of the spread–angle. The
algorithm is sketched in Fig. 8.
Moreover, further analyses have been carried out
on the positive samples only, with the aim of distin-
guishing among severely infected plates (≥ 10
6
) and
moderately infected plates (≥ 10
5
). To this aim, we
estimate, one sector after the other, the ratio between
the infected area and the sector area.
3.4 Detection of Multiple Infections
Biological laboratories daily examine a huge number
of Petri plates. When a sample contains more than
two infection strains, the plate needs further, specific,
ABLE: An Automated Bacterial Load Estimator for the Urinoculture Screening
577
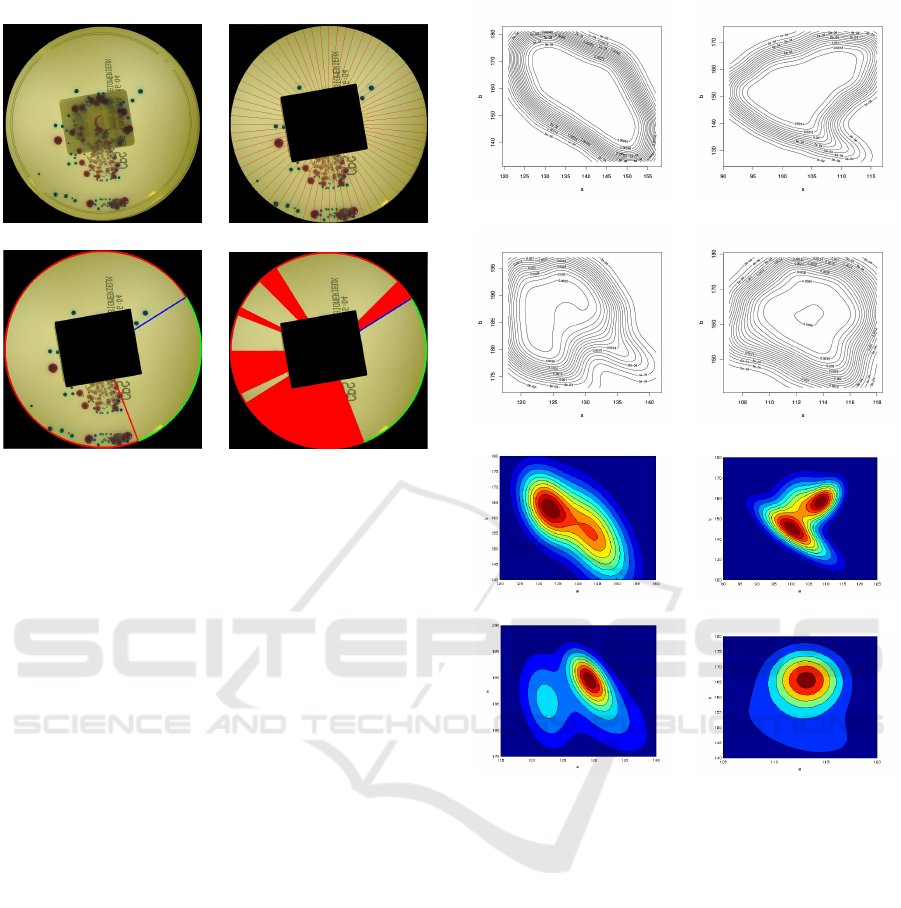
(a) (b)
(c) (d)
Figure 8: The original image (a) is divided in 64 sectors (b);
in (c), the spread–angle is estimated and, in (d), only the not
empty sectors (in red) are considered.
analysis. Therefore, it is important to quickly detect
the presence of multiple infected plates where every
type of infection is significantly present. Our pro-
posed algorithm aims at detecting the following in-
fection classes: E. Coli, Enterococcus Faecalis, KES
group, Proteus, Pseudomonas Aeruginosa, and Mor-
ganella. The last three classes are not well repre-
sented within the dataset and, therefore, since they
all produce yellow colonies, we decided to group
them together in a "yellow infection" pseudo–class.
When more than two classes are contemporary de-
tected on the same plate, the sample has to be con-
sidered as "contaminated". To this end, the CIE–Lab
(a,b) values of the four classes (E. Coli, Enterococ-
cus Faecalis, KES group, yellow class) have been
extracted, using some foreground samples collected
during the initial color space analysis phase. As for
the background subtraction module, only the chro-
matic components have been used. Again, the Mardia
and Henze–Zirkler normality tests indicate that sim-
ple Gaussian models are unsuitable. The contour lines
of each distribution are shown in Fig. 9.
As for the background subtraction module, a
Gaussian mixture model (GMM) has been used to de-
scribe the various probability density functions. After
the background subtraction, a Mean–Shift segmenta-
tion algorithm was applied in order to compensate for
local dishomogeneities. For each segment, the (a,b)
modal values are compared with the Gaussian mix-
ture models of all the classes, and the maximum pos-
terior probability gives the classifier output. It has
(a) (b)
(c) (d)
(e) (f)
(g) (h)
Figure 9: In (a), (b), (c) and (d), the contour lines, and in (e),
(f), (g) and (h), the lines estimated with the mixture model
respectively for E. Coli, E. Faecalis, the "yellow class", and
KES.
been noted that, sometimes, there are halo–regions
surrounding colonies. These halo–regions actually
belong to the background but, in some cases, the pres-
ence of groups of nearby colonies changes the back-
groundappearance, producingsome errors in the clas-
sification output. Moreover, when different types of
infections, with different colors, overlap on the same
plate, their color changes in the melding region, and
this also leads to incorrect classifications. Since the
unpredictable colors produced in these regions do not
belong to any previously defined model, the posterior
probability in those areas is likely to be low. To im-
prove the performance in such situations, low values
of the posterior probability are used to identify the
uncertainty areas on the plate (see Fig. 10). The ac-
tual number of infections is determined with respect
ICPRAM 2016 - International Conference on Pattern Recognition Applications and Methods
578
to only those regions with a well–defined color.
(a) (b)
Figure 10: In (a), the original image; in (b), in gray, the
uncertainty region, in green, the background, in red, blue,
dark blue and yellow the various infections.
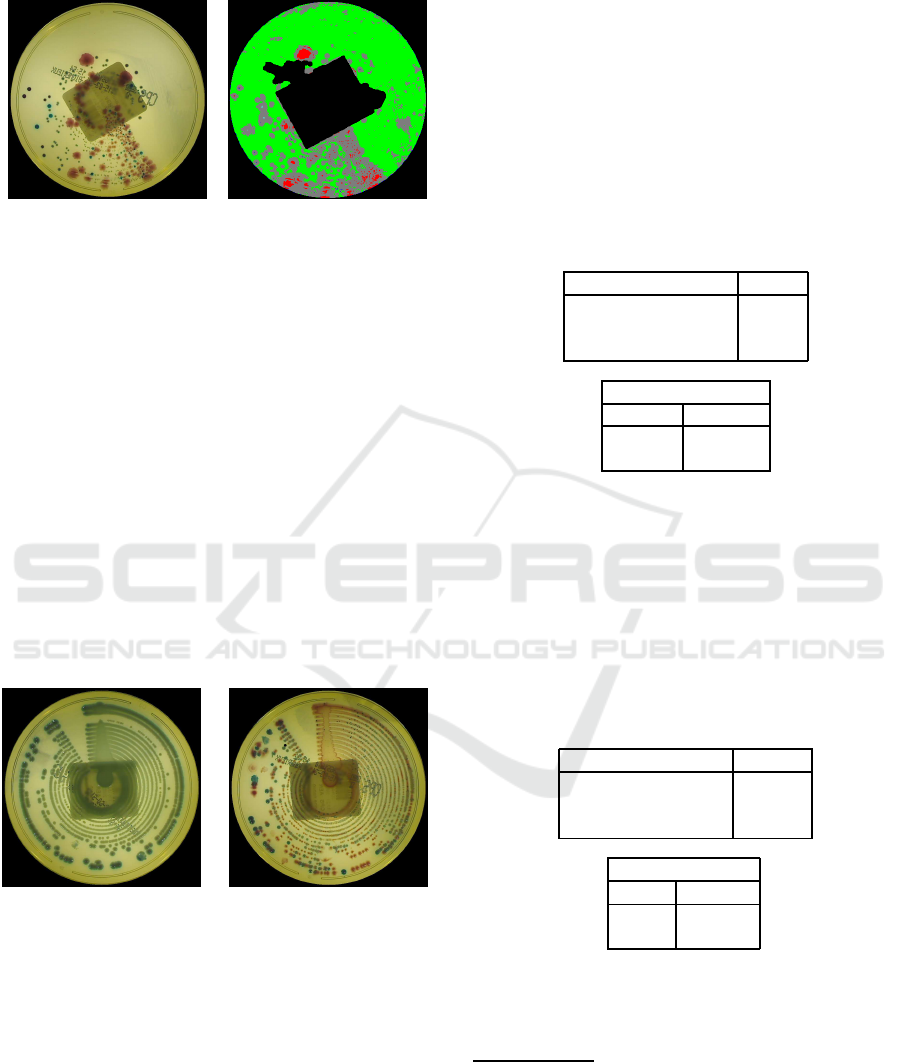
4 RESULTS
The preprocessing algorithms have been tested on
the whole data set comprised of 499 images. Over-
all, written texts have been correctly identified in the
86,78% of the images (433/499). However, it must
be noted that the actual performance depends on the
level of clutter in each plate. In the case of infected
plates, a relevant part of the visual area is covered by
the infection and the text is only partially visible (see
Fig. 11). As a result, in infected images, the correct
text detection rate is 75,45% (160/212), whereas in
non infected images it is 95,12% (273/287).
Figure 11: Two examples of highly infected plates, where
the written text is significantly occluded.
It is worth noting, from a practical point of view,
the text detection is not important for highly infected
plates, because the infection severity mainly depends
on how much the colony is spread on the plate, and
the eventual few undetected text pixels do not influ-
ence the automatic classification results. The label re-
moval algorithm also shows very good results: 100%
of the whole dataset of 499 images has been correctly
processed.
After the preprocessing phase, the system performs
the infection severity estimation. The performance
obtained by applying the procedure described in Sec-
tion 3.3 to our dataset (accuracy and confusion ma-
trix
2
) are reported in Table 1. As we can see, 22 im-
ages were incorrectly classified. However, it is impor-
tant to note that these images are all false positive, so
that we obtain a sensitivity of 100%. In fact, in our
dataset, a positive sample is never confused with a
negative one (false negative). This is a very desirable
result, since a false positive "only" requires a further
analysis by the human expert, whereas a false nega-
tive could lead to ignore the infection and to expose
the patient to possible risks.
Table 1: Accuracy and confusion matrix obtained by ABLE.
Number of images 499
Correctly classified 477
Incorrectly classified 22
Accuracy 95,4%
Confusion Matrix
Positive Negative
212 22
0 265
For the 212 positive samples in our dataset — to be
distinguished between severely infected (≥ 10
6
) and
moderately infected (≥ 10
5
) — the obtained results
are shown in Table 2. Although the classification ac-
curacy was not astonishing, we can assert that, in al-
most all the cases in which ABLE fails, also the judg-
ments of the human experts (three biologists, in this
case) are mostly discordant.
Table 2: Classification accuracy for infected plates (≥ 10
6
vs. ≥ 10
5
), and confusion matrix, obtained by ABLE.
Number of images 212
Correctly classified 176
Incorrectly classified 36
Accuracy 83,01%
Confusion Matrix
≥ 10
5
≥ 10
6
57 8
28 119
Even if the experimental results are actually very
promising, they are devised on a small set of data,
whereas the ABLE system must be experienced in
2
A confusion matrix allows the visualization of the per-
formance of a supervised learning classifier. Each column
represents the instances in the predicted class, while each
row represents the instances in the actual class. Its name
stems from the fact that it clearly shows if the system is
confusing two classes (i.e. commonly mislabeling one as
another).
ABLE: An Automated Bacterial Load Estimator for the Urinoculture Screening
579

the daily practice of an analysis laboratory. To this
aim, currently, ABLE is being extensively (and suc-
cessfully) tested in DIESSE research laboratories, in
order to compare its responses with those of a team of
expert biologists, who are expected to evidence pos-
sible weaknesses to be solved before its final release.
5 CONCLUSIONS
Urinary tract infections can be caused by diverse mi-
crobes, including fungi, viruses, and bacteria. Bacte-
ria are actually the most common cause of UTIs. Nor-
mally, bacteria that enter the urinary tract are rapidly
removed by the body before they cause symptoms.
However, sometimes bacteria overcome the bodys’
natural defenses and, actually, roughly 150 millions
of infections occur annually worldwide. In this pa-
per, an automatic tool, called ABLE, to detect UTIs
and to establish their severity, was described. The
system shows a good accuracy in finding typical mi-
croorganisms present in humans, and gives no false
negatives. Moreover, it is capable to reveal contami-
nated plates (where multiple infections are present on
the same dish). Preliminary promising experimental
results have been reported by DIESSE biologists, who
are testing ABLE in their laboratories.
REFERENCES
Agah, A., editor (2014). Artificial Intelligence in Health-
care. CRC Press.
Ahuja, K. and Tuli, P. (2013). Object recognition by
template matching using correlations and phase an-
gle method. International Journal of Advanced Re-
search in Computer and Communication Engineering,
2(3):1368–1373.
Andreini, P., Bonechi, S., Bianchini, M., Mecocci, A., and
Di Massa, V. (2015). Automatic image classification
for the urinoculture screening. In Smart Innovation,
Systems and Technologies, volume Intelligent Deci-
sion Technologies, 39, pages 31–42.
Ballabio, C., Venturi, N., Scala, M. R., Mocarelli, P., and
Brambilla, P. (2010). Evaluation of an automated
method for urinoculture screening. Microbiologia Me-
dica, 5(3):178–180.
Bandinelli, N., Bianchini, M., and Scarselli, F. (2012).
Learning long–term dependencies using layered graph
neural networks. In Proceedings of IJCNN–WCCI
2012, pages 1–8.
Belazzi, R., Diomidous, M., Sarkar, I. N., Takabayashi, K.,
Ziegler, A., McCray, A. T., and Sim, I. (2011). Data
analysis and data mining: Current issues in biomedi-
cal informatics support systems. Methods Inf. Med.,
50(6):536–544.
Berlin, A., Sorani, M., and Sim, I. (2006). A taxonomic de-
scription of computer–based clinical decision support
systems. J. Biomedical Informatics, 39:657–667.
Bianchini, M., Maggini, M., and Jain, L. C., editors (2013).
Handbook on Neural Information Processing, volume
Intelligent Systems Reference Library, 49. Springer.
Bourbeau, P. P. and Ledeboer, N. A. (2013). Automation in
clinical microbiology. Journal of Clinical Microbiol-
ogy, 51(6):1658–1665.
Broerm, M. A., Bahçeci, S., Vader, H. L., and Arents, N. L.
(2011). Screening for urinary tract infections with the
sysmex uf–1000i, urine flow cytometer. Journal of
Clinical Microbiology, 49:1025–1029.
Brugger, S. D., Baumberger, C., Jost, M., Jenni, W., Brug-
ger, U., and Múhlemann, K. (2012). Automated
counting of bacterial colony forming units on Agar
plates. PLoS ONE, 7(3):e33695.
Chen, W.-B. and Zhang, C. (2009). An automated bacterial
colony counting and classification system. Inf. Syst.
Front., 11(4):349–368.
Clarke, M. L., Burton, R. L., Hill, A. N., Litorja, M.,
Nahm, M. H., and Hwang, J. (2010). Low–cost, high–
throughput, automated counting of bacterial colonies.
Cytometry Part A, 77(8):790–797.
Deserno, T. M., editor (2011). Biomedical Image Process-
ing. Springer–Verlag, New York.
Dey, D. K., Ghosh, S., and Mallick, B. K. (2010). Bayesian
Modeling in Bioinformatics. CRC Press.
Gonzalez, R. and Woods, R. (2008). Digital Image Process-
ing. Addison Wesley.
Heckerling, P. S., Canaris, G. J., Flach, S. D., Tape, T. G.,
Wigton, R. S., and Gerber, B. S. (2007). Predictors
of urinary tract infection based on artificial neural net-
works and genetic algorithms. Int. J. Med. Inform.,
76(4):289–296.
Henze, N. and Zirkler, B. (1990). A class of invari-
ant consistent tests for multivariate normality. Com-
munications in Statistics – Theory and Methods,
19(10):3595–3617.
Mardia, K. V. (1970). Measures of multivariate skew-
ness and kurtosis with applications. Biometrika,
57(3):519–530.
NHS Purchasing and Supply Agency (2011). Automated
urine screening systems.
Ogawa, H., Nasu, S., Takeshige, M., Funabashi, H., Saito,
M., and Matsuoka, H. (2012). Noise–free accurate
count of microbial colonies by time–lapse shadow im-
age analysis. Journal of Microbiological Methods,
91(43):420–428.
Otsu, N. (1979). A threshold selection method from gray–
level histograms. IEEE Trans. Sys. Man Cyber., 9:62–
66.
Rice, F. and Baruch, A. (2009). Evaluation of BioMérieuxs
PREVI Isola, an automated microbiology specimen
processor: Improving efficiency and quality of results.
Torres, A. and Nieto, J. J. (2006). Fuzzy logic in medicine
and bioinformatics. J. of Biomedicine and Biotechnol-
ogy, (91908).
Wang, W. (2011). Colony image acquisition system
and segmentation algorithms. Optical Engineering,
50(12):123001–123010.
ICPRAM 2016 - International Conference on Pattern Recognition Applications and Methods
580
