
Evaluating Twitter Influence Ranking with System Theory
Georgios Drakopoulos, Andreas Kanavos and Athanasios Tsakalidis
Computer Engineering and Informatics Department, University of Patras, Patras 26500, Greece
Keywords:
Functional Metrics, Structural Metrics, Graph Databases, Higher Order Data, Influence Ranking, Neo4j.
Abstract:
A considerable part of social network analysis literature is dedicated to determining which individuals are to be
considered as influential in particular social settings. Most established algorithms, such as Freeman and Katz-
Bonacich centrality metrics, place emphasis on various structural properties of the social graph. Although
this makes centrality metrics generic enough to be applied in virtually any setting, they are oblivious to the
functionality of the underlying social network. This paper examines five social influence metrics designed
especially for Twitter and their implementation in a Java client retrieving network information from a Neo4j
server. Additionally, a sceheme is proposed for evaluating the performance of an influence ranking based on
estimating the exponent of a Zipf model fitted to the ranking score.
1 INTRODUCTION
Social media constitute a mainstay of the connected
age. Recently, Twitter has emerged among them as
one of the most popular microblogging platforms,
where on a daily basis a vast amount of information,
including tweets and hashtags, is posted by the users
of the platform to the public or to selected circles of
their contacts.
Their advent made feasible the application of
both traditional and innovative social network anal-
ysis methods in previously prohibitive magnitude
for cornerstone problems such as social coher-
ence, social graph clustering, expansion potential,
or information flow (Russell, 2013)(Leskovec et al.,
2014)(Leskovec, 2011). Currently, social influence
ranking has been recognized as an important research
topic. Existing influence metrics rely heavily on
structural properties of the social graph, such as the
number of shortest paths through a given vertex. Al-
though these structural metrics are well defined and
can be applied to literally every social graph, they ig-
nore the array of functions each social network per-
forms.
Graph databases such as Neo4j provide produc-
tion grade front- or back-end social graph storage.
Moreover, they offer graph analytics such as link
prediction, shortest paths, clustering coefficient, and
minimum spanning trees, bolstering the potential
of graph tools such as NetworkX, machine learn-
ing frameworks such as Graphlab, and distribiuted
processing systems such as Spark (Robinson et al.,
2013)(Onofrio Panzarino, 2014).
The primary contribution of this work is three-
fold. Five Tweeter-specific metrics capturing essen-
tial online behavior characteristics have been devel-
oped. Additionally, a methodology for evaluating in-
fluence metrics based on concepts from system the-
ory is proposed. Finally, the aforementioned metrics
have been implemented in Java over Neo4j through
the Cypher API.
The rest of this paper is structured as follows. Sec-
tion 2 summarizes the influence ranking literature.
Implementation aspects are described in section 3.
Twitter-specific functional metrics are outlined in sec-
tion 4. Section 5 discusses the experimental results
and the metric evaluation methodology, while section
6 explores future research directions.
Table 1: Symbols used in this paper.
Symbol Meaning
4
= Equality by definition
{
x
1
, . . . , x
n
}
Set containing elements x
1
, . . . , x
n
|
S
|
Cardinality of set S
τ
S
1
,S
2
Tanimoto coefficient of sets S
1
and S
2
t
k
k-th Twitter user (used as shorthand)
µ Twitter user influence metric
µ
k
Influence score of t
k
assigned by µ
µ
1
µ
2
Metric µ
1
outperforms µ
2
µ
1
µ
2
Metric µ
1
is at least as good as µ
2
Drakopoulos, G., Kanavos, A. and Tsakalidis, A.
Evaluating Twitter Influence Ranking with System Theory.
In Proceedings of the 12th International Conference on Web Information Systems and Technologies (WEBIST 2016) - Volume 1, pages 113-120
ISBN: 978-989-758-186-1
Copyright
c
2016 by SCITEPRESS – Science and Technology Publications, Lda. All rights reserved
113
2 RELATED WORK
Social network analysis scientific literature abounds
with influence rankings or metrics (Kempe et al.,
2003). Although ranking classification is not always
clear, distinct metric design methodologies can be
broadly classified to structural and functional, while
the former can be further subdivided to combinato-
rial and spectral. Structural metrics are more versatile
than functional ones, since the former are network-
independent. On the contrary, the latter are network-
specific but they tend to reveal more information
about the underlying network.
Combinatorial rankings compute the influence
score based on basic graph properties. Prominent
metrics of this category are the degree metric, namely
the neighborhood size of a given vertex, and the
Newman-Girvan centrality, a function of the graph
shortest paths (Leskovec et al., 2014). Combinato-
rial rankings may as well be expressed in the linear
algebra domain through the graph adjacency matrix.
One such example is the Katz centrality (Katz, 1953).
Spectral rankings derive the influence score di-
rectly or indirectly through the spectral decomposi-
tion of the graph adjacency matrix. Eigenvalues and
eigenvectors play an important role in metrics such as
PageRank (Leskovec et al., 2014) or eigenvector cen-
trality (Drakopoulos et al., 2015).
On the contrary, functional metrics are associ-
ated with particular aspects of a given social net-
work performs. TwitterRank (Weng et al., 2010) and
TunkRank (TunkRank, 2015) are two PageRank ex-
tensions which take into account user similarity and
retweet probability respectively. In (Bakshy et al.,
2011) the most influential users are also the most cost-
effective ones, where the cost is defined in terms of
overall communication complexity. In (Mehta et al.,
2012) influence is expressed in terms of a sophisti-
cated metric incorporating structural and functional
elements. In (Pal and Counts, 2011) the problem of
finding the most influential authors for a given topic in
Twitter are selected from a Gaussian Mixture Model.
A similar problem in Yahoo! Answers was addressed
in (Bouguessa et al., 2008), where ranking is done as
a mixture of gamma distributions.
Finally, authors in (Rogers and Beal, 1957) move
along a different reasoning beyond the structural and
functional divisive line, presenting influence in terms
of an intuition stemming from the current technolog-
ical evolution, which eventually led to the successful
spread of online social media. Quoting (Cha et al.,
2010), influence is
“[. . . ] the ability of a person to influence the
thoughts or actions of others.”
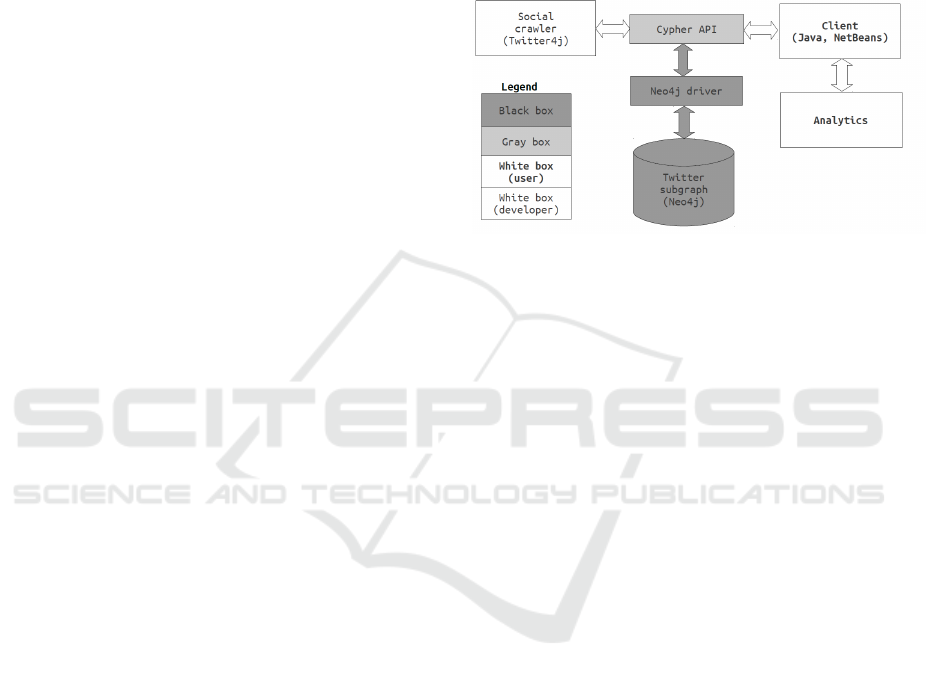
3 SYSTEM ARCHITECTURE
Figure 1 illustrates the components of the system de-
veloped to address the needs of this work as well as
the information flow between them. The three main
functions are to retrieve the social graph through the
social media crawler, to store it in the Neo4j server,
and to query this graph through its Java client.
Figure 1: System architecture.
The social crawler, described in (Kafeza et al.,
2014), has been programmed in Twitter4j to collect
im JSON format data such as tweets, retweets, and
hashtags. It communicates with the Neo4j server
through the Cypher API, a Java interface extended by
Neo4j to Java clients, in order to populate the graph
database. The crawler is inaccessible from the client.
The Neo4j version is 2.2.5, the latest available version
at the beginning of system development. It commu-
nicates both with the Twitter crawler and the client.
The expressive power of Cypher, its declarative query
language, reduces relatively complex graph queries to
simple patterns modifiable dynamically by the Java
client. Since only the API is visible by the client, it is
listed as a grey box, while the graph database proper
as a black box. On the end user side, the client has
been developed in Java using the libraries available in
NetBeans for interfacing with Neo4j.
The need for new database approaches, besides
the relational one, was highlighted with the advent
of Web 2.0, which is dominated by high velocity,
unstructured or semistructured and high order data.
Neo4j, a NoSQL graph database, stores data physi-
cally as a graph.
Property 1. Neo4j is schemaless (Robinson et al.,
2013).
This is a fundamental NoSQL characteristic which
yields design flexibility but also imposes additional
design and administration burdens.
Property 2. The relational ACID operational re-
quirements have been replaced by the three BASE
requirements (Robinson et al., 2013)(Onofrio Pan-
zarino, 2014).
WEBIST 2016 - 12th International Conference on Web Information Systems and Technologies
114

The BASE set is less strict than the ACID
one, providing implementation flexibility and ease of
maintenance at the expense of data consistency. De-
spite the latter, a NoSQL database can be in practice
successfully tailored to the local operational demands.
Property 3. The property graph model is the primary
conceptual data model supported by Neo4j and of-
fered to a high level user typically through the Cypher
querying language (Drakopoulos et al., 2015)(Kon-
topoulos and Drakopoulos, 2014).
Property 4. Neo4j fully supports for both vertices
and edges the CRUD set of operations, namely
Create, Read, Update, and Delete.
Neo4j supports Cypher, a declarative, ASCII art,
and pattern based query language for handling con-
ceptual graphs. Cypher possesses suitable syntax to
concisely express CRUD operations. For instance, a
vertex can be inserted with the command
c r e a t e < p a t t e r n >
Similarly, a vertex can be removed with the com-
mand
d e l e t e < p a t t e r n >
Deleting a vertex leads to the deletion of all of its in-
and out-bound edges.
The basic structure of a Cypher query is:
match < p a t t e r n >
[ wit h [< p a t t e r n >]]
where [< c o n s t r a i n t s >]
r e t u rn <e x p r e s s i o n > [ as <e x p r e s s i o n > ]
4 INFLUENCE RANKING
This section reviews five Twitter influence metrics
and describes the corresponding Cypher queries. The
social media crawler has been programmed to tra-
verse Twitter starting from the account of a major
higher educational institution in order to collect the
following six features for each anonymized Twitter
user t
k
as in (Kafeza et al., 2014),(Kanavos et al.,
2014a),(Kanavos et al., 2014b): Tweets (T
k
), retweets
(R
k
), conversations (C
k
), followers (F
k
), hashtags
(H
k
), and tweet frequency (Q
k
). The last is computed
based on tweet tiemstamps.
In Neo4j, a Twitter subgraph has been created
based on the collected data. Each user has been placed
in a vertex with the command:
c r e a t e ( n : u s e r { ’ t w e e t s ’ : x ,
’ r e t w e e t s ’ : x ,
’ c o n v e r s a t i o n s ’ : x ,
’ f o l l o w e r s ’ : x ,
’ f r e q u e n c y ’ : x ,
’ h a s h t a g s ’ : x })
where x denotes a value computed elsewhere in the
source code. The above Cypher command creates a
vertex n of type user along with a set of associated
key-value pairs. This makes the conceptual graph ho-
mogeneous in the sense that each vertex has the same
number of key-value pairs. Moreover, there are no
missing values. Therefore, an implicit schema does
exist for the vertices of the particular Twitter graph,
but this need not to be the case generally.
In a similar manner, if a user u follows another
user v, then an edge with the FOLLOWS tag (and
FOLLOWEDBY) is created:
c r e a t e ( ( u ) −[ :FOLLOWS]−>(v ) ,
( v ) −[ :FOLLOWEDBY]−>(u ) )
Notice that the inverse relationship has also been es-
tablished in a similar manner. Although this is by
no means necessary, finding the number of Followers
that a given user has, facilitates subsequent analysis.
Based on the above attributes, a range of cate-
gories for influential Twitter users can be constructed
depending on their online activity as in (Kafeza et al.,
2013).
Atomic conversational users have a high number
of tweets and retweets. The rationale is that active
users either generate or relay a significant amount
of information and they are therefore consulted by a
large number of users. The following query changes
the vertex type of the top x conversational users,
marking them as such.
match ( n : u s e r )
wi t h n , n . t w e e t s + n . r e t w e e t s as sum
or d er by sum d e s c
l i m i t x
s e t n : c o n v e r s a t i o n a l
Subsequently, the vertices marked as conversational
are returned along with the sum of tweets and
retweets.
match ( n : c o n v e r s a t i o n a l )
r e t u rn n , id ( n ) , n . t w e e t s , n . r e t w e e t s ,
n . t w e e t s + n . r e t w e e t s a s sum
or d er by sum d e s c
The atomic conversational metric is denoted by µ
C
.
Atomic multisystemic users, denoted by µ
M
, have
a high number of hashtags in their tweets and
retweets. These type of users are probably proficient
in a broad range of topics and they are a likely point
of advice for other users.
Evaluating Twitter Influence Ranking with System Theory
115

match ( n : u s e r )
wi t h n
or d er by n . h a s h t a g s d e s c
l i m i t x
s e t n : m u l t i s y s t e m i c
Subsequently, the users marked as multisystemic are
returned along with the number of corresponding
hashtags.
match ( n : m u l t i s y s t e m i c )
r e t u rn n , id ( n ) , n . h a s t a g s as h
or d er by h d e s c
Atomic energetic users, denoted by µ
E
, have a
high number of Tweets over a specified time interval.
This behavior pattern likely indicates a user knowl-
edgeable of or at least one strongly opinionated about
a particular topic. Thus, users curious to know about
this topic or, correspondingly, like minded users may
choose to consider this user an authority.
match ( n : u s e r )
r e t u rn n , n . t w e e t s
or d er by n . t w e e t s de s c
Notice that the above command retrieves the users
sorted in descending order according to the total num-
ber of their Tweets as well as their corresponding
number of Tweets they have posted. The time each
Tweet was posted as well as the time resolution de-
termining which user is atomic energetic takes place
elsewhere in the source code. The actual time reso-
lution was three days, which is a reasonably enough
time to post a tweet, read a reply, and in following to
post a new tweet.
Atomic popular users, denoted by µ
P
, have a high
number of followers. Although popularity, in Twit-
ter terms, does not necessarily translate to actual po-
pularity, highly followed users can be expected to at
least be read by other Twitter users, exerting thus an
at least limited amount of influence. The number of
users who connect to a given user through an edge can
be identified by
match ( n : u s e r { ’ name ’ : x })
<−[:FOLLOWS] −( u )
r e t u rn n , c ou n t ( d i s t i n c t u )
as f o l l o w e r s
or d er by f o l l o w e r s d e s c
l i m i t x
or by the quicker query
match ( n : u s e r
{ ’ name ’ : x } −[:FOLLOWEDBY]−>(u ) )
r e t u rn n , c ou n t ( d i s t i n c t u )
as f o l l o w e r s
or d er by f o l l o w e r s d e s c
l i m i t x
Atomic influential users, denoted by µ
I
, combine
in a sense the above notions as their overall influence
score I
k
is computed as in (Kafeza et al., 2013):
µ
I
k
4
= T
k
R
k
C
k
log
10
(1 + F
k
)Q
k
H
k
(1)
The number of followers F
k
is in base 10 logarithm for
avoiding outliers. In addition, F
k
is incremented by 1
so as to avoid a minus infinity metric when a user has
no followers. The following Cypher command returns
these statistics for a given user
match ( n : u s e r )
wi t h n
r e t u rn n , n . t w e e t s , n . r e t w e e t s ,
n . h a s h t a g s
Also, the number of followers has been computed
for each user. For each user its score was computed
according to (1) and was stored as a new property
named overall to the appropriate vertex. Having
computed this property, the following command re-
turns the top influential users according to (1) and
changes their type to influential:
match ( n : u s e r )
wi t h n
or d er by n . o v e r a l l de s c
l i m i t x
s e t n : i n f l u e n t i a l
5 RESULTS
5.1 Twitter Subgraph Synopsis
Definition 1. A Twitter egg is an account with no fol-
lowers.
Definition 2. A star is a bipartite graph where the
one parition is a singleton. Moreover, the vertex of
this singleton is connected to all remaining vertices.
The Twitter subgraph was collected in a time inter-
val of two months (September and October of 2015).
Its properties are stated in table 2. The first column
has fundamental graph structure properties such as
the number of edges and triangles, whereas the sec-
ond column has Twitter specific properties such as the
average tweet length and the average number of fol-
lowers. Note that the vertices are accounts and the
directed edges represent “following” relationships.
There is only a small fraction of eggs and stars.
Specifically, there are 31 stars are comprised of 148
WEBIST 2016 - 12th International Conference on Web Information Systems and Technologies
116

Table 2: Twitter subgraph properties.
Property Value Property Value
Vertices 6561 Hashtags 417
Edges 35422 Tweets 18221
Triangles 213 Retweets 7221
Squares 72 Avg.following 2.11
Stars 31 Avg. followers 4.61
Components 32 Eggs 117
Diameter 9 Avg. tweet 102.8
Table 3: Influential Twitter subgraph accounts breakdown.
Account type Instances
Official university account 1
Official school accounts 8
Official department accounts 22
Faculty member accounts 46
Student leader accounts 23
Organization accounts 20
Total 120
vertices, namely the 117 eggs plus the 31 central ver-
tices. By the very definition of the egonet, its diam-
eter equals 2. The remaining 6413 vertices belong to
a single, large component which is densely connected
since its diameter equals 9. These structural charac-
teristics indicate an active social network.
This is corroborated in the functional level by the
large number of hashtags, indicative of topic varia-
tions, and by the numerous and lengthy tweets. The
daily tweet and retweet traffic as shown in figure 2
has variations and bursts, signifying an active online
community. Notice that in figure 2 the tweets and the
retweets are expressed as percentages of the raw total
number of tweets and retweets respectively.
The Tweeter crawler began its search from the of-
ficial account of a prominent university and it was
programmed to contain its search strictly within ed-
ucation topics. As a result, table 2 consists of only
eductional accounts - see also table 3. Although users
from more than one domain would yield a more re-
Figure 2: Tweets and retweets per day.
alistic subgraph, the selection of a single topic facili-
tates the analysis.
In order to gain a deeper insight of the behavior
of Twitter analytics, the ranking scores are shown in
figures 2, 3, and 4. Initially there are more tweets
than retweets, but eventually retweets rise to an al-
most steady fraction of tweets. Also, there are iner-
leaving periods where retweets are anticorrelated with
tweets and periods where retweets are correlated with
twewets.
Concerning figure 3, conversational ranking scree
values are a bit higher than the influential ones,
though they both tend to have percentages equal to
1% after rank 60. For the conversational ranking scree
plot, the two major percentage decreases take place
for rank ranges starting from 5 to 35 and from 45 un-
til 65. For the influential ranking scree plot, there
are also two decreases but smoother than in conver-
sational one; the first starts from rank equal to 1 until
5 and the second from 10 to 50.
On the other hand, regarding figure 4, user rank-
ing logscree plots, for both conversational and influ-
ential scores, seem to have almost the same behavior.
More concretely, conversational values are bigger un-
til rank 60, while influential values are by little bigger
for the next 10 ranks. Then all the remaining ranks
have percentages equal to 1%.
A secondary finding is that accounts who reg-
ularly tweet usually have more influence than ones
who mostly retweet, although there are many excep-
tions to that rule. This is expected as accounts who
post new tweets can be considered as potential influ-
encers. Also, retweeting typically adds more status to
the poster of the original tweet than to its retransmit-
ter. The exception to the rule seems to be users who
selectively retweet about specific topics, acting in this
way as information hubs for these particular topics.
5.2 System Based Analysis
Definition 3. Assume a (multi)set S =
{
x
1
, . . . , x
n
}
is
partitioned into b distinct subsets S
k
, 1 ≤ k ≤ b such
that
b
∑
k=1
|
S
k
|
=
|
S
|
where identical elements of S are placed on the same
S
k
. The plot of
|
S
k
|
versus their ranking is termed the
scree plot of S. When the logarithm of
|
S
k
|
is used
instead, then the plot is called the logscree plot.
Definition 4. Assume a fixed set T of influence met-
ric evaluation tests. Metric µ
1
outperforms µ
2
with
respect to T if and only if µ
1
achieves strictly better
evaluation scores than µ
2
in each test of T . This case
is denoted as µ
1
µ
2
.
Evaluating Twitter Influence Ranking with System Theory
117

(a) Conversational (b) Influential
Figure 3: Atomic conversational and influential ranking scree plots.
(a) Conversational (b) Influential
Figure 4: Atomic conversational and influential ranking logscree plots.
Definition 5. Assume a fixed set T of influence metric
evaluation tests. Metric µ
1
is at least as good as µ
2
with respect to T if and only if µ
1
achieves
• strictly better evaluation score than µ
2
in at least
one test of T
• the same evaluation score with µ
2
in the remain-
ing tests
This case is denoted as µ
1
µ
2
.
This section outlines a method for evaluate rank-
ings based concepts from system theory. The analysis
relies on the following properties:
Property 5. Rankings in large, scale free graphs tend
to exhibit behavior which can be modelled by a Zipf
equation which has the form
|
S
k
|
= α
0
k
−γ
0
, α
0
, γ
0
> 0,
b
∑
k=1
|
S
k
|
=
|
S
|
(2)
where
|
S
k
|
is the cardinality of the k-th subset of S.
In this case, the data has been partitioned to b =
p
|
S
|
bins. This choice yields unbiased estimators
with reasonable error bounds while keeping low the
computational complexity.
Property 6. For most large systems γ
0
belongs to the
continuous interval [2, 3].
Taking logarithms of both sides linearizes (2)
yielding
ln
|
S
1
|
ln
|
S
2
|
ln
|
S
3
|
.
.
.
ln
|
S
b
|
=
0 1
−ln2 1
−ln2 1
.
.
.
.
.
.
−lnb 1
γ
0
lnα
0
(3)
The normal equations for (3) are:
−
∑
b
k=1
ln
|
S
k
|
lnk
∑
b
k=1
ln
|
S
k
|
=
∑
b
k=1
ln
2
k −
∑
b
k=1
lnk
−
∑
b
k=1
lnk b
γ
0
lnα
0
(4)
The least squares estimation
ˆ
γ
LS
of γ
0
under this
model is
ˆ
γ
LS
= −
b
∑
b
k=1
ln
|
S
k
|
lnk
−
∑
b
k=1
ln
|
S
k
|
∑
b
k=1
lnk
b
∑
b
k=1
ln
2
k
−
∑
b
k=1
lnk
2
(5)
For each influence metric of section 4, a Zipf model
has been fitted using the least squares approach which
was just described. Table 4 shows the values of
ˆ
γ
LS
for
each case. Observe that the exponent estimated for the
atomic influence metric is the closest to the exponent
WEBIST 2016 - 12th International Conference on Web Information Systems and Technologies
118

continuous range [2, 3], which is the interval most ex-
ponents associated with aspects of large, real world
social graphs typically belong to (Leskovec, 2011).
Table 4:
ˆ
γ
LS
for each influence metric.
µ
C
µ
M
µ
E
µ
P
µ
I
ˆ
γ
LS
1.41 1.78 1.65 1.61 1.91
At this point two questions arise. The first is
which of the five influence metrics reveals more infor-
mation regarding user online activity and thus identi-
fies influential individuals in a better way. The second
question is, once a baseline ranking is established,
how the others compare with it.
The first question has been addressed by a domain
expert, who established a ground truth ranking µ
∗
. Ta-
ble 3 contains a complete ranking according to the do-
main expert, whereas table 5 shows the percentage of
influential users listed in each of the ten percentiles of
the rankings returned by each of the five metrics.
Table 5: Percentage of influential users.
µ
∗
µ
C
µ
M
µ
E
µ
P
µ
I
50 10 22 11 32 26
50 11 7 11 7 52
0 9 33 9 8 19
0 5 28 7 7 6
0 10 10 8 6 7
0 12 10 12 19 0
0 28 0 25 5 0
0 10 0 10 6 0
0 9 0 10 0 0
0 11 0 7 0 0
Atomic conversational and atomic energetic tend
to exhibit similar patterns. Moreover, they yield the
worst list as the influential users are scattered almost
uniformly across the percentiles. On the other hand,
the atomic influential has the best performance. This
was expected since µ
I
combines multiplicatively five
features in a nonnegative scalar, whereas the other
four rankings rely on a single feature.
Table 6 contains the Tanimoto coefficients be-
tween the five influence metrics of section 4. Through
the five sets of ranking results, the similarity of each
influence metric is approximated by the Tanimoto co-
efficient defined for any two sets S
1
and S
2
as:
τ
S
1
,S
2
4
=
|
S
1
∩ S
2
|
|
S
1
∪ S
2
|
=
|
S
1
∩ S
2
|
|
S
1
|
+
|
S
2
|
−
|
S
1
∩ S
2
|
(6)
There are many dissimilarities each ranking has from
the baseline µ
I
. It is remarkable that each of the re-
maining rankings differs in its own way. For instance,
out of the 25 most atomic influential users, only 6
have been deemed as important, 4 were both atomic
conversational and multisystemic and 2 were atomic
popular.
Table 6: Tanimoto coefficient between metrics.
τ
·,·
µ
C
µ
M
µ
E
µ
P
µ
I
µ
C
1 0.523 0.400 0.511 0.340
µ
M
0.523 1 0.017 0.194 0.403
µ
E
0.400 0.017 1 0.701 0.192
µ
P
0.511 0.194 0.701 1 0.210
µ
I
0.340 0.403 0.192 0.210 1
From the above, the following metric ordering can
be inferred:
µ
I
µ
M
µ
C
µ
P
µ
E
(7)
Concluding, as a general remark regarding influence
metrics, it should be noted that social graphs contain
information of inherently high order, in the sense that
for a spectrum of queries, a considerable number of
edges should be visited in order to obtain meaning-
ful information. This can be at least partly attributed
to the distributed and connection oriented nature of a
graph. User influence metrics are not an exception to
this rule as influence can be in a certain sense dif-
fused through tweets, retweets and user references.
Therefore, a significant Twitter user can influence the
opinion of its neighbors but also the opinions of their
neighbors (e.g. followers of followers). Thus, influ-
ence metrics should take into account higher order
phenomena, if meaningful results are to be obtained.
6 CONCLUSIONS AND FUTURE
WORK
Twitter influence ranking has been cast in a multidis-
ciplinary way. Five Twitter-specific functional influ-
ence metrics have been implemented in Java using the
NetBeans libraries for interfacing with a Neo4j server
through the Cypher API. Also, an evaluation method-
ology for the influence metrics based on systems the-
ory is proposed.
Within the immediate scope of this work, research
can be conducted towards developing advanced func-
tional rankings or hybrid structrural-functional rank-
ings. The same analysis proposed in this paper should
be applied to Twitter subgraphs consisting of accounts
from multiple domains. Finally, research should in-
clude the development of rankings integrating the
concepts of reputation and trustworthiness in social
media.
Evaluating Twitter Influence Ranking with System Theory
119

At this point, the authors would like to publicly
express their gratitude to the sociology expert for set-
ting the ground truth regarding the influential Twitter
accounts of the graph of table 2.
REFERENCES
Bakshy, E., Hofman, J. M., Mason, W. A., and Watts, D. J.
(2011). Everyone’s an influencer: Quantifying influ-
ence on twitter. In Proceedings of the Fourth ACM In-
ternational Conference on Web Search and Data Min-
ing (WSDM), pages 65–74.
Bouguessa, M., Dumoulin, B., and Wang, S. (2008). Iden-
tifying authoritative actors in question-answering fo-
rums: The case of yahoo! answers. In Proceedings of
the 14th ACM SIGKDD International Conference on
Knowledge Discovery and Data Mining (KDD), pages
866–874.
Cha, M., Haddadi, H., Benevenuto, F., and Gummadi, K. P.
(2010). Measuring user influence in twitter: The
million follower fallacy. In Proceedings of Interna-
tional AAAI Conference on Weblogs and Social Media
(ICWSM).
Drakopoulos, G., Baroutiadi, A., and Megalooikonomou,
V. (2015). Higher order graph centrality measures for
Neo4j. In Proceedings of the 6th International Con-
ference of Information, Intelligence, Systems, and Ap-
plications (IISA).
Kafeza, E., Kanavos, A., Makris, C., and Chiu, D. (2013).
Identifying personality-based communities in social
networks. In Legal and Social Aspects in Web Mod-
eling (Keynote Speech) in conjunction with the Inter-
national Conference on Conceptual Modeling (ER),
LSAWM.
Kafeza, E., Kanavos, A., Makris, C., and Vikatos, P. (2014).
T-PICE: Twitter personality based influential com-
munities extraction system. In IEEE International
Congress on Big Data, pages 212–219.
Kanavos, A., Perikos, I., Vikatos, P., Hatzilygeroudis, I.,
Makris, C., and Tsakalidis, A. (2014a). Conversation
emotional modeling in social networks. In 24th IEEE
International Conference on Tools with Artificial In-
telligence (ICTAI), pages 478–484.
Kanavos, A., Perikos, I., Vikatos, P., Hatzilygeroudis, I.,
Makris, C., and Tsakalidis, A. (2014b). Modeling
retweet diffusion using emotional content. In Artifi-
cial Intelligence Applications and Innovations AIAI,
pages 101–110.
Katz, L. (1953). A new status index derived from sociomet-
ric analysis. Psychometrika, 18(1):39–43.
Kempe, D., Kleinberg, J., and Tardos, E. (2003). Maximiz-
ing the spread of influence through a social network.
In Proceedings of the ninth ACM SIGKDD interna-
tional conference on Knowledge Discovery and Data
mining, KDD ’03, pages 137–146. ACM.
Kontopoulos, S. and Drakopoulos, G. (2014). A space effi-
cient scheme for graph representation. In Proceedings
of the 26th International Conference on Tools with Ar-
tificial Intelligence (ICTAI), pages 299–303.
Leskovec, J. (2011). Social media analytics: Track-
ing, modeling and predicting the flow of information
through networks. In Proceedings of the 20th Inter-
national Conference Companion on World Wide Web
(WWW), pages 277–278.
Leskovec, J., Rajamaran, A., and Ullman, J. D. (2014). Min-
ing of massive datasets. Cambridge University Press,
2nd edition.
Mehta, R., Mehta, D., Chheda, D., Shah, C., and Chawan,
P. M. (2012). Sentiment analysis and influence track-
ing using twitter. International Journal of Advanced
Research in Computer Science and Electronics Engi-
neering, 1(2):73–79.
Onofrio Panzarino (2014). Learning Cypher. PACKT pub-
lishing.
Pal, A. and Counts, S. (2011). Identifying topical authorities
in microblogs. In Proceedings of the Fourth ACM In-
ternational Conference on Web Search and Data Min-
ing (WSDM), pages 45–54.
Robinson, I., Webber, J., and Eifrem, E. (2013). Graph
Databases. O’Reilly.
Rogers, E. M. and Beal, G. M. (1957). Importance of
personal influence in the adoption of technological
change, the. Soc. F., 36:329.
Russell, M. A. (2013). Mining the social web: Analyzing
data from Facebook, Twitter, LinkedIn, and other so-
cial media sites. O’Reilly, 2nd edition.
TunkRank (2015). http://thenoisychannel.com/2009/01/13/a-
twitter-analog-to-pagerank.
Weng, J., Lim, E.-P., Jiang, J., and He, Q. (2010). Twitter-
rank: Finding topic-sensitive influential twitterers. In
Proceedings of the Third ACM International Confer-
ence on Web Search and Data Mining (WSDM), pages
261–270.
WEBIST 2016 - 12th International Conference on Web Information Systems and Technologies
120
