
Presence Analytics: Density-based Social Clustering for Mobile Users
Muawya Habib Sarnoub Eldaw, Mark Levene and George Roussos
Dept. of Computer Science, Birkbeck, University of London, Malet Street, WC1E 7HX, London, U.K.
Keywords:
Presence Analytics, Density-based Clustering, Social-DBSCAN, WLAN Traces, Wireless Network Traces,
Eduroam, Social Groups, Class Attendance, Human Presence, Learning Activity, Mobile Data, Mobile Users.
Abstract:
We demonstrate how social density-based clustering of WLAN traces can be utilised to detect granular social
groups of mobile users within a university campus. Furthermore, the ability to detect such social groups, which
can be linked to the learning activities taking place at target locations, provides an invaluable opportunity to
understand the presence and movement of people within such an environment. For example, the proposed
density-based clustering procedure, which we call Social-DBSCAN, has real potential to support human mo-
bility studies such as the optimisation of space usage strategies. It can automatically detect the academic term
period, the classes, and the attendance data. From a large Eduroam log of an academic site, we chose as a
proof concept, selected locations with known capacity for the evaluation of our proposed method, which we
successfully utilise to detect the regular learning activities at those locations, and to provide accurate estimates
about the attendance levels over the academic term period.
1 INTRODUCTION
Pervasive technologies, such as Eduroam (Eduroam,
2016), generate vast amounts of detailed information,
providing an invaluable opportunity to study differ-
ent aspects of presence and movement behaviours of
people within a target leisure, work or study environ-
ment. Furthermore, these technologies increase peo-
ple’s ability to access information, which undoubt-
edly affects the way the target environment operates,
and it is therefore essential that we build real-time
monitoring systems as well as theoretical frameworks
to understand how people’s presence and its dynam-
ics reshape the structures of our environments. With
such measurements put in place, we can potentially
discover hidden patterns of behaviour at both the col-
lective and at the individual user levels, thus increas-
ing our understanding about people’s presence, and
in turn, improving our ability to make informed deci-
sions when we plan for our environments.
Here we focus our investigation on the social di-
mension of people presence within an academic envi-
ronment, with the objective of discovering meaning-
ful social clusters of users. In particular, we apply our
proposed data mining algorithm on the WLAN im-
prints that visitors leave behind as they move about
from one location to another across the different sites
at Birkbeck College. Our intuition is that we should
be able discover clusters that match the users groups
formed on the basis of attending lectures of individual
modules. Gaining knowledge about the social group
that regularly attends a target class such as the size of
the group, allows us to make accurate estimate about
the attendance level of the learning activity. Further-
more, by clustering learning activities (e.g. modules)
together we can discover a higher level of grouping
that matches the clustering formed with respect to the
membership in the study programmes that the stu-
dents are enrolled in.
The raw WLAN traces used in this research were
collected at Birkbeck, University of London during
the period from the 1st of October 2013 to the 10th
of April 2015. In comparison to most data sets used
in previous Eduroam based studies (Allahdadi et al.,
2013; Mulhanga et al., 2011), the data set containing
these traces is larger in size with respect to its number
of users as well as the number of days it spans.
The paper makes the following contributions to
presence analytics:
1. It presents a social density-based clustering
method that uses WLAN traces in order to de-
tect granular social groups of mobile users within
a university campus. The proposed clustering
method, which we call Social-DBSCAN, relies on
the underpinning semantic context for parameteri-
sation, i.e. utilising information from the semantic
context to determine the values of the clustering
52
Eldaw, M., Levene, M. and Roussos, G.
Presence Analytics: Density-based Social Clustering for Mobile Users.
DOI: 10.5220/0005970200520062
In Proceedings of the 13th International Joint Conference on e-Business and Telecommunications (ICETE 2016) - Volume 6: WINSYS, pages 52-62
ISBN: 978-989-758-196-0
Copyright
c
2016 by SCITEPRESS – Science and Technology Publications, Lda. All rights reserved

algorithm parameters such as the minimum class
size value, which we use to ensure that the num-
ber of individual students in any discovered social
group remains within a certain range values.
2. Make accurate estimates about the actual atten-
dance level of learning activities. Linking the dis-
covered social group that regularly attends a target
location and the learning activity that takes place
within the same context, will allow us to estimate
the attendance level of these learning activities.
The remainder of the paper is organised as follows. In
Section 2, we present the motivation for this work. In
Section 3, we review the related work. In Section 4,
we describe the social clustering of mobile users, and
provide the definitions of the concepts used in this
work. In the same section, we provide the descrip-
tion of the details of our clustering approach such as
the formulation of the clustering problem, similarity
computation, the detection of regular learning activi-
ties and the discovering of the arbitrary-shaped clus-
ters of users. In Section 5, we give a description of the
data set we used for the evaluation of our proposed ap-
proach, followed by the evaluation of the discovered
clusters. We provide a comprehensive discussion of
the results in Section 6. Finally, in Section 7, we give
our concluding remarks and a brief description of fu-
ture work.
2 MOTIVATION
In (Eldaw et al., 2016), we investigate the human
presence within an academic environment and exam-
ine four types of behavioural patterns that correspond
to the four different aspects of the data: social, spa-
tial, temporal and semantic. Motivated by our find-
ings, we set out to study more closely the social as-
pect of presence analytics, with the aim of gaining
better understanding of the human presence within the
case-study environment - the Bloomsbury campus of
Birkbeck University of London. Based on the anal-
ysis carried out in (Eldaw et al., 2016) there is high
temporal regularity in the human presence (see the
evident seasonality pattern in Figure 3), which can be
interpreted as the visitors having preferences with re-
spect to the visited locations. Moreover, our analysis
reveals that the distribution of revisiting users across
the various affiliations is approximately a power-law
(Clauset et al., 2009). The various patterns inves-
tigated: daytime, evening, weekdays and weekend,
show that most users belong to a small number of af-
filiations as can be implied from the analysis of the
distribution, shown in Figure 1. It is not surprising
ucl.ac.uk
coventry.ac.uk
uws.ac.uk
usr.ua.es
Affiliation
0
0.5
1
1.5
2
Number of Revisiting Users
×10
4
Number of Revisiting Users by Affiliation
Power-law fit
f(x) = a*x
b
a = 2.067e+04
b = -1.359
R-square: 0.9817
bbk.ac.uk
ugent.be
mit.edu
pi.cnr.it
Affiliation
0
1
2
3
4
5
6
Number of Revisits
×10
5
Number of Revisits by Affiliation
Power-law fit
f(x) = a*x
b
a = 6.17e+05
b = -1.46
R-square: 0.9769
Figure 1: Distribution of number of revisits by affiliation. In
this figure, the affiliations are ranked by number of revisits.
The top plot shows the distribution of number of revisiting
users by affiliation and the bottom plot shows the distribu-
tion of number of revisits. The distributions in these figures
were computed over the 11 week period covering the Spring
term of 2015 (From the 5th Jan to 20th March 2015).
that these affiliations, which include Birkbeck Col-
lege, are the ones that hold the most regular teaching
and research activities across Birkbeck’s sites. Fur-
thermore, as shown in Figure 2, we discovered that
the users’ revisits are distributed as an exponential
mixture across locations. The combination of these
findings gives very strong indications of an underly-
ing semantic users/visitors grouping on the basis of
the learning activities that take place at Birkbeck’s
Bloomsbury campus in central London.
2.1 The Intuition of the Proposed
Density-based Clustering Approach
Social relationships is an integral part of every com-
munity and no doubt that numerous social commu-
nities exist between the people of the same univer-
Presence Analytics: Density-based Social Clustering for Mobile Users
53
MAL G16
MAL B34
MAL 608
MAL 761
10GowerSt-b-Lobby
Location
0
2000
4000
6000
8000
10000
Number of Revisiting Users
Number of Revisiting Users by
Location
Exponential fit
f(x) = a*exp(b*x) + c*exp(d*x)
a = 5326
b = -0.02592
c = 7967
d = -0.1426
R-square: 0.9952
MAL CoffeeShop
43GordonSq-103
28RussellSq-102
MAL 630
10GowerSt-b-Lobbyn
Location
0
2
4
6
8
10
Number of Revisits
×10
4
Number of Revisits by Location
Exponential fit
f(x) = a*exp(b*x) + c*exp(d*x)
a = 2.727e+04
b = -0.02657
c = 8.68e+04
d = -0.2706
R-square: 0.9961
Figure 2: Distribution of number of revisits by location. In
this figure, the locations are ranked by number of revisits.
The top plot shows the distribution of number Of revisiting
users by location and the bottom plot shows the distribution
of number of revisits. The distributions in these figures were
computed over the 11 week period covering the Spring term
of 2015 (From the 5th Jan to 20th March 2015).
sity. The people at Birkbeck College are no excep-
tion to this. Based on the day-to-day social activities
such as lectures, seminars and other regular meetings,
we have strong evidence about the existence of finer-
grained relationships as opposed to the high-level so-
cial grouping by the user’s academic affiliation. In
this paper we utilise a density-based clustering ap-
proach to discover the social groups formed on the
basis of these learning activities. Our choice of a
density-based clustering overother types of clustering
methods is motivatedby the semantic underpinningof
the visits made to the various locations in the College.
In most cases, when a location is visited, the visit is
normally motivated by the desire to attend the learn-
ing activity taking place at the target location. For
instance, when a student makes a visit to one of the
lecture-rooms he or she is most probably doing this
because they are attending a class taking place at that
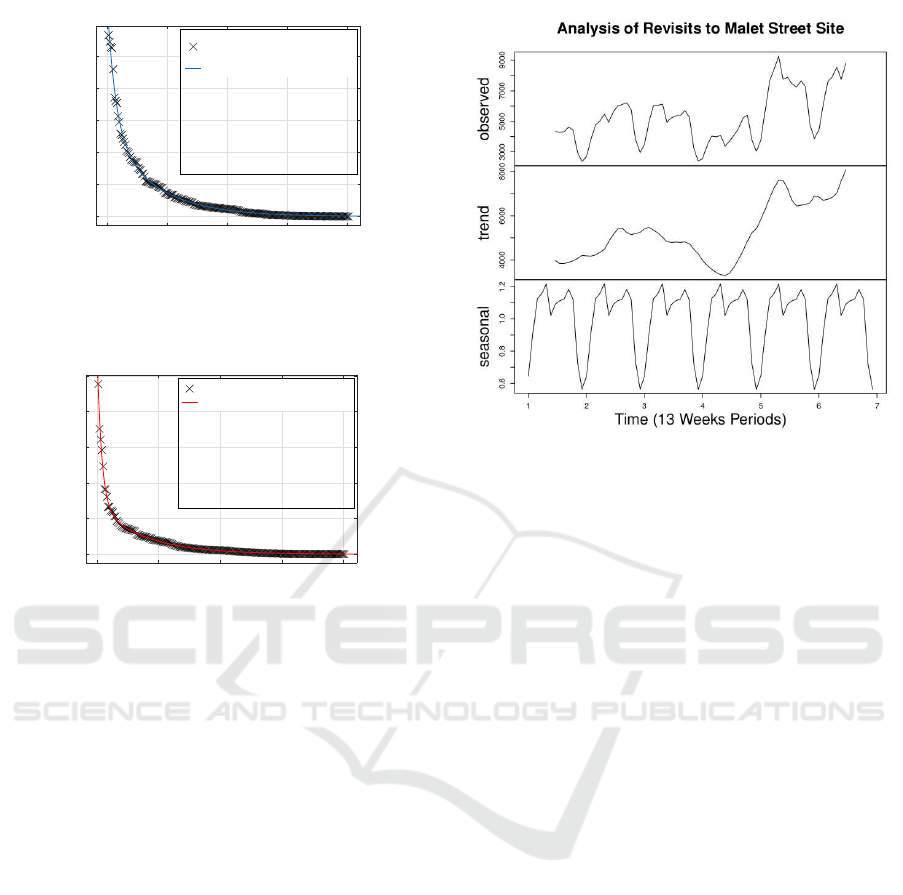
Figure 3: Time series analysis of number of revisits to Malet
Street site. In this figure, the top plot shows the original
time series in which the data is divided into 13 week periods
(Each 13 week period covering an 11 week academic term
plus an extra week on either sides of the term). The plot
second from top shows the estimated trend, and the bottom
plot shows the estimated seasonal constituent.
location.
It is important to note here that with exception
to the minimum class size and the minimum atten-
dance threshold, which we discussed in Section 4.4.1,
we do not make any specific assumptions about the
level of attendance of any given regular learning activ-
ity. Moreover, we do not make assumptions about the
density or the variance of attendance or the shapes for
the clusters that we would like to discover. The rea-
son is that these measurements about the attendance,
i.e. the density and the shapes of the social clusters
of users, are partly the kind of information that we set
out to discover in this research, and consequently we
take into consideration an unbiased prior view about
them.
3 RELATED WORK
Numerous studies investigated the possibility of using
WLAN traces to get an up-to-date perspective of the
human dynamics within an academic institution. We
review some of these studies and lay special emphasis
on the social dimension of the human presence.
In (Eagle and Pentland, 2006), which describes a
study involving university students, the authors iden-
tified activity patterns related to the users daily be-
haviour. The study showed that the daily patterns can
WINSYS 2016 - International Conference on Wireless Networks and Mobile Systems
54

be associated with the user’s major of study and, con-
sequently be linked to the level of employment. In
(Lee and Hou, 2006) the authors estimated the net-
work usage among different access points over a long-
term. In a study discussed in (Kumar et al., 2008) it
was shown that it is possible to identify social groups
amongst users. The study was based on WLAN mo-
bility traces that were collected over a period of one
month. In the same study, it was shown that male and
female session duration can be significantly different.
Most recent Eduroam studies provide analysis us-
ing small data sets of WLAN traffic traces (Allahdadi
et al., 2013; Mulhanga et al., 2011). The analysis and
the discussion presented in this paper is based on a
large amount of WLAN traces, that was recently col-
lected at Birkbeck University of London, which is one
of the participant universities in Eduroam. Further-
more, this analysis provides an up-to-date view about
the current trend in Eduroam usage.
4 SOCIAL CLUSTERING OF
MOBILE USERS
The patterns discussed in this section are concerned
with the social perspective of the human presence,
in particular, the human presence with the respect to
learning activities that occur across the different lo-
cations at a university campus. To examine such pat-
terns, we utilise a collection of methods to measure
the influence of the social behaviour in the data. Some
of these methods capture the degree of similarity be-
tween users, while other ones are designed to detect
the social groups of these users.
4.1 Definitions
1. Presence Analytics is defined as the collec-
tion and the analysis of mobile data in order to
find meaningful patterns about people’s presence
within a given environment.
2. An Event is defined as a group of one or more de-
vices/users connecting to the network from a par-
ticular location within a given time interval.
3. Revisit is defined as the appearance of a user at
a previously visited location at approximately the
same time of the day on the same day of the week.
4. Pattern of Events is defined as a time series of
occurrences of a given event, associated with a
given time. For example, the attendance of a mod-
ule with a regular weekly class delivered for a
number of consecutive weeks at the same given
location is a Pattern of events.
4.2 Problem Formulation
Suppose that we have the individual users’ records of
revisits, of a group of users U, to a target location L.
Moreover, suppose that all these revisits were made
within a fixed time interval of a given weekday D for
k consecutive weeks. We would like to automatically
discover whether this collection of revisits represent a
pattern of events of a learning activity that was taking
place at the location L over the k consecutive weeks.
In the remainder of this paper we use the terms
learning activity and pattern of events interchange-
ably to refer to the same concept. Similarly, we some-
times mention users, people, students and visitors all
to mean the same thing.
4.3 Similarity Measure
An important question that automatically arises when
we want to decide whether an observed user can be
associated with a particular group of users, is how to
compute the similarity between the observed user and
the members of a group. An equally important ques-
tion to address here is how much information is re-
quired to determine a realistic similarity value. To an-
swer such questions we utilise information extracted
from the semantic context to inform our model about
the kind of similarity measure to use and the amount
of information needed to compute the similarity.
4.3.1 Jaccard Similarity
We choose Jaccard, which we argue is a natural mea-
sure, based on the application and the data. Intu-
itively, the Jaccard similarity measure, which is also
referred to as the Jaccard or Tanimoto coefficient, sub-
stantially captures the similarity between two records
of attendance. It computes the similarity as the ra-
tio between the intersection and the union of the
two compared records of attendance (Cheetham and
Hazel, 1969), (Sneath, 1957), (Sp¨ath, 1980). More
specifically, it compares the total of shared attended
sessions to the sum of sessions attended by either of
the two users. The formal definition of this measure
is as follows:
Jaccard(p
a
, p
b
) =
|p
a
∩ p
b
|
|p
a
∪ p
b
|
. (1)
where p
a
and p
b
represent the records of revisits of
user a and user b as d-dimensional points.
4.3.2 Term-based Similarity Computation
One of the key challenges that we needed to address
when computing the similarity is how much infor-
Presence Analytics: Density-based Social Clustering for Mobile Users
55

mation is required to determine a realistic similar-
ity value. In the context of this work, the presence
and movement of people can be highly dictated by
the learning activities that takes place across the Col-
lege. For example, the regular presence of students
and the teaching staff in lecture-rooms is highly dic-
tated by the modules taught in these rooms. Similar to
other academic institutions, these learning activities
such as lectures and lab sessions are highly dictated
by the timetable, which gives the location and time
allocation for the different learning activities across
the academic year. Here at Birkbeck College, this al-
location is usually different for the different academic
terms, with exception to a selection of core modules
that continue to run for more than one term. Nonethe-
less, within the term period many people are likely
to be present at the same location at the same time at
least once a week. This observation was confirmed by
the regularity found in the temporal patterns as shown
in Figure 3. Based on this finding, we decided to com-
pute the similarity over the 11 week periods - each 11
week period correspondsto one of the academic terms
contained in the data set described in Section 5.2.
4.4 Detecting Regular Learning
Activities
To explain how our proposed method successfully de-
tects the occurrence of a class, we rely on the intuition
that the visitors to a target location, where the regular
sessions of a module are delivered, naturally form a
social group that most likely meet on a regular ba-
sis over the number of weeks that the module covers.
The experiments we conducted, as shown in the anal-
ysis presented in Section 6, were designed to discover
such groups by performing a two stage process, which
addresses the following challenges.
4.4.1 Noise Reduction
With the kind of WLAN data utilised in this work,
it is not guaranteed that all the individuals who vis-
ited a particular location were there, merely to attend
the learning activity taking place at that location. In
order to successfully detect a regular class that takes
place at a target location, we discard from our pro-
cessing the data of any individual whose total number
of visits to the target location was less than a minimum
attendance threshold.
Another concept that is closely related to level of
attendance is the minimum class size, which is the
smallest percentage of the total number of students
registered for the class that must be present for a
learning session to hold. Note here that the minimum
attendance and the minimum class size vary between
the different schools and departments within the Col-
lege.
4.4.2 Coherence of Attendance
Even with the noise being eliminated, we still cannot
guarantee that those individuals who visited a partic-
ular location were there merely to attend the learn-
ing activity that was taking place there. Therefore,
it is imperative to verify that those individuals that at-
tended the potential class are coherentin attending the
individual sessions of that class over the 11 week aca-
demic term. A coherent cluster is defined as a group
of individual users that have similar attendance. For
example, if two or more individuals consistently at-
tended the same sessions of a class then they are mem-
bers of a coherent cluster.
To verify coherence of attendance, we apply our
proposed clustering method to find out whether those
individuals, whose attendance satisfy the minimum
requirement, form a single cohesive cluster with re-
spect to their attendance of individual sessions across
the different weeks of the academic term period.
4.4.3 Discovering Coherent Clusters
The clustering approach we are proposing is based
on the DBSCAN algorithm, the density-based spa-
tial clustering of applications with noise (Ester et al.,
1996), which scales well for large amount of data
(Kriegel et al., 2011). The original DBSCAN takes
two parameters, namely epsilon (a distance threshold)
and minPts (a minimum number of points which is
used as a density threshold). Given some data points
for clustering, DBSCAN relies on these two param-
eters to identify density connected points in the data.
It uses the concepts of direct and density connectiv-
ity to group points together forming transitive hull of
density-connected points, which yields density-based
clusters of arbitrary shapes. In DBSCAN, two points
are said to be directly connected if they are at dis-
tance less than the threshold epsilon and a point is
said to be a core point if it has more directly con-
nected neighbouring points than the threshold minPts.
Furthermore, two points is said to be density con-
nected if they are connected to core points that are
themselves density connected to one another (Kriegel
et al., 2011).
In our proposed social variant of DBSCAN, which
we refer to as Social-DBSCAN, we use information
from the semantic context of the human presence to
inform the DBSCAN algorithm about the distance
and the density threshold values, which the algorithm
utilises to discover the social clusters present in the
WINSYS 2016 - International Conference on Wireless Networks and Mobile Systems
56

data. In particular, there are two main differences be-
tween our version of DBSCAN and the original ver-
sion published in (Ester et al., 1996):
1. The distance measure we utilise is based on the
Jaccard coefficient, which as discussed earlier in
sections 4.3.1 and 4.4.2, plays an important role
in capturing the degree of coherence between the
records of attendance of two individuals, i.e. it
compares the total of shared attended sessions to
the sum of sessions attended by either of the two
users.
2. A further important difference, which is closely
related to the data set being clustered and also re-
lated to how the clustering is performed, is that the
points representing the individuals who attended
the learning activity, are ordered in descending or-
der based on the individual’s level of attendance,
i.e. ordered by the individual’s total number of
attended sessions. The ordering of the points in
descending order captures the idea that the higher
the level of attendance the more likely that the in-
dividual is part of the social group that attended
the learning activity. This is a key concept of how
the clustering is performed in our proposed ver-
sion of the DBSCAN algorithm.
The proposed clustering algorithm, which we call
Social-DBSCAN, can be described in pseudo code
following the original version of DBSCAN described
in (Ester et al., 1996):
Social-DBSCAN(Dataset, CohCoff, MinClassSize):
# The Data set is ordered in descending
# order of attendance level.
SGroup = getNewSGroup()
for(point P in Dataset):
if VisitedPts.contains(P) == True:
continue
VisitedPts.add(P)
# findSimilarPts() returns all
# points similar to P with Jaccard
# similarity >= CohCoff.
# The returned set of points is
# presented in descending order
# according to attendance level.
pSimilarPts = findSimilarPts(P,
CohCoff)
if pSimilarPts.size() < MinClassSize:
NOISE.add(P)
else:
SGroup = getNewSGroup()
SGroup = expandSocialGroup(P, SGroup,
pSimilarPts, CohCoff, MinClassSize)
if SGroup.size() > 0:
DiscoveredSocialGroups.add(SGroup)
In the pseudo code shown above, the parame-
ters CohCoff and MinClassSize represent the coher-
ence coefficient and the minimum class size thresh-
old values respectively. Note here that the value of
the CohCoff is computed as a Jaccard distance, i.e.
1 − Jaccard. From a practical perspective, the val-
ues of these parameters are heavily influenced by the
context in which Social-DBSCAN is being applied.
In the pseudo code shown below, we illustrate how
a discovered group is expanded, where the code only
differs from the regionQuery() in DBSCAN, in that
the neighbourhood of a given point is returned as or-
dered list, based on the number of sessions the user
attended over the term period. In DBSCAN the neigh-
bourhood list is not returned in any particular order.
expandSocialGroup(P, SGroup, pSimilarPts,
CohCoff, MinClassSize):
SGroup.add(P)
for(point Q in pSimilarPts):
if VisitedPts.contains(Q) == False:
VisitedPts.add(Q)
qSimilarPts = findSimilarPts(Q,
CohCoff)
if qSimilarPts.size() >= MinClassSize:
# add all points in qSimilarPts to
# pSimilarPts.
pSimilarPts = pSimilarPts.add(
qSimilarPts)
if DiscoveredSocialGroups.contains(
Q) == False:
SGroup.add(Q)
5 DATA ANALYSIS
5.1 Birkbeck University of London
Birkbeck is one of the member colleges of Univer-
sity of London and a major provider of evening higher
education. Based on the most recent available statis-
tics, there are approximately 16,500 students attend-
ing Birkbeck. Most of Birkbeck students are part-
time, with approximately 88% of them enrolled on
part-time programmes (Birkbeck, 2016).
Birkbeck’s Bloomsbury Campus in central Lon-
don, is located very close to campuses of other col-
leges of University of London, such as UCL and
SOAS. This proximity to these other campuses was
naturally translated in a large amount of collaboration
between these universities. As a result, Birkbeck’s
Bloomsbury campus is shared by thousands of aca-
demics, researchers and students from these universi-
ties on a daily basis.
Birkbeck, is also one of the participant of
Eduroam, a WLAN service developed for the inter-
national education and research community that gives
Presence Analytics: Density-based Social Clustering for Mobile Users
57

secure, world-wide roaming access to the Internet
(Birkbeck Eduroam, 2016).
5.2 Data Set
The evaluation of the proposed clustering method,
Social-DBSCAN, is based on recent WLAN traces
collected at Birkbeck. This data set of WLAN traces
is a snapshot of the College’s Eduroam access data
for the period, from the 1st of October 2013 to 10th
of April 2015. It contains 223 locations and 167,272
users, who come from 2,462 institutions and depart-
ments. The 223 locations given in this data set are
divided between 11 of the 17 sites of the Bloomsbury
campus.
The data is divided into four categories: authen-
tication details, pre-proxy details, post-proxy details
and reply details. User-ID, access location, timestamp
and affiliation are the basic information for each pro-
cessed record. Based on these records, we designed
new types of data representing the four aspects of the
human presence: social, spatial, temporal and seman-
tic aspects. To detect the attendance of learning ses-
sions, we carry out further processing, where we cre-
ate d-dimensional spatio-temporal vectors. Each vec-
tor denotes the visits made by one of the users to a
target location, within a fixed time interval of day, on
a target weekday and over a period of 11 weeks. The
data division into 11 weeks periods is motivated by
the temporal regularity found in the data as shown in
Figure 3, where each 11 week period corresponds to
a single academic term.
In this work we also make use of the room ca-
pacity information, which is available independently
through the College’s website. All of the 20 locations
we chose for the evaluation of the proposed clustering
approach are rooms with known capacities.
5.2.1 Data Privacy
All sensitive information that we do not use in this
work, such as the users email address, has been re-
moved from the data set. Every other data item of per-
sonally identifiable information has been anonymised
notably the device MAC address. Eduroam access
point BSSIDs have not been anonymized during pro-
cessing, however access information is aggregated by
BSSID but not per user, and specifically no attempt
has been made to create individual user fingerprints or
reveal the locations of access points on a map. These
data processing and related security and data manage-
ment provisions have been approved by the Colleges
ethics committee.
5.3 Evaluation of Discovered Clusters
Our evaluation methodology is designed to verify
whether the presence of a discovered group of indi-
viduals represents regular attendance of a learning ac-
tivity that has taken place at the target location. It ver-
ifies whether the results obtained from the two stage
process, which addresses the noise reduction and the
coherence of attendance (see the discussion in Section
4.4 for more details). This is consistent with the initial
intuition that the regular visitors of a given location on
a given day of the week naturally form a single coher-
ent social group. From a practical point of view, there
are two criteria that the clustering result must fulfil in
order to justify the occurrence of a regular class at the
target location:
1. There must be a dominant coherent discovered
group with the majority of the students (e.g. 50%
or more) being members of such group.
2. Following the reduction of noise, the average
number of students per session must be within the
capacity of the target location, where the detected
class was taking place.
Table 1: Location information.
Location
ID.
Location
Name
Number
of Unique
Visitors
Capacity
#1 MaletSt-402 239 35
#2 MaletSt-G16 194 60
#3 Clore-102 135 33
#4 MaletSt-b35 72 125
#5 MaletSt-153 66 66
#6 MaletSt-b34 43 222
#7 MaletSt-b29 48 30
#8 MaletSt-417 49 60
#9 MaletSt-423 42 39
#10 Clore-204 32 33
#11 MaletSt-352 21 20
#12 43GordonSq-g02 24 28
#13 MaletSt-314 32 36
#14 MaletSt-b20 16 99
#15 43GordonSq-b04 17 127
6 DISCUSSION OF RESULTS
In our experiments, we examined the visiting patterns
to 20 randomly chosen locations with known capac-
ity. These chosen locations are mostly used for learn-
ing activities such as lectures and lab-based classes.
As shown in Table 1, the number of unique visitors
greatly varies between these chosen locations. For a
WINSYS 2016 - International Conference on Wireless Networks and Mobile Systems
58

Table 2: Social-DBSCAN clustering result for 20 unique locations. The student’s minimum attendance threshold was 30%
and the Coherence Coefficient was 0.6. This result was computed for the time interval from 18:00 - 21:00 every Monday of
the Spring term of 2015 (11 weeks period).
Location
ID.
Number of
Students
Number of
Discovered
Groups
Group
No.
Group
Size
Group Min
Attendance
Group Max
Attendance
Group Avg
Attendance
Standard
Deviation
Avg Number
of Students
Per Session
#1 217 2 1 211 4 10 5.08 1.25 98.09
217 2 2 2 4 4 4.00 0.00
#2 171 3 1 163 4 9 5.23 1.32 79.00
171 3 2 2 4 4 4.00 0.00
171 3 3 2 4 5 4.50 0.50
#3 126 3 1 104 4 10 5.17 1.35 50.91
126 3 2 2 4 6 5.00 1.00
126 3 3 3 4 4 4.00 0.00
#4 71 1 1 64 4 10 5.91 1.56 34.36
#5 60 2 1 40 4 10 5.50 1.53 21.27
60 2 2 3 4 6 4.67 0.94
#6 43 1 1 31 5 9 6.87 1.29 19.36
#7 47 3 1 27 4 9 6.30 1.67 17.18
47 3 2 2 4 6 5.00 1.00
47 3 3 2 4 5 4.50 0.50
#8 47 1 1 35 4 9 6.43 1.57 20.45
#9 41 2 1 33 4 8 5.58 1.44 17.55
41 2 2 2 4 5 4.50 0.50
#10 31 2 1 18 4 9 5.89 1.56 10.36
31 2 2 2 4 4 4.00 0.00
#11 21 2 1 8 5 10 6.75 1.71 6.27
21 2 2 3 5 5 5.00 0.00
#12 24 1 1 14 4 9 6.29 1.44 8.00
#13 30 3 1 13 4 9 6.23 1.37 9.00
30 3 2 2 4 4 4.00 0.00
30 3 3 2 4 6 5.00 1.00
#14 16 1 1 11 4 8 5.18 1.27 5.18
#15 17 4 1 2 9 10 9.50 0.50 7.82
17 4 2 8 4 7 5.63 1.11
17 4 3 2 4 4 4.00 0.00
17 4 4 3 4 6 4.67 0.94
few of them, this number of visitors exceeds the lo-
cation capacity, which is a clear indication that those
visitors were not all regular attendees at these loca-
tions. Therefore, it is important that we remove the
noise from the data and only preserve the records of
those visitors who most likely visited those locations
in order to attend the learning activities that were tak-
ing place there.
We restricted our investigation to the Spring of
2015 (i.e. the period from 5th Jan - 20th March 2015).
The results shown are for the time interval from 18:00
- 21:00 of every Monday of this period. As a proof of
concept we only report on two sets of experiments.
These two sets correspond to two values of the mini-
mum attendance threshold, which is used in detecting
the regular learning activities that took place at those
selected locations. We now summarise the results of
the experiments in these two categories.
6.1 Setting the Minimum Attendance at
30%
To ensure that only individual with consistent atten-
dance appear in the data set being clustered, we filter
out the records of those individuals with attendance
lower than 30%. The intuition here is that the group
of those individuals with regular attendance of 30% or
more will include all those who attend the actual class
and possibly include some noise as well, i.e. individ-
uals who are not regular attendees of the class such as
those who happened to be in the vicinity of the target
location when the class was taking place.
Although 30%, from a practical perspective, is
a low threshold value for minimum attendance, we
nonetheless utilised such a value to assess the perfor-
mance of the proposed clustering method at this level
of attendance. The results of the experiments can be
summarised as follows:
1. As shown in Table 2, we had more than one dis-
covered group for many of the locations, which is
a sign of lack of coherence in attending the same
sessions of the regular class we are trying to de-
tect. This is totally consistent with the intuition
that setting the minimum attendance threshold to
such a low percentage, i.e. 30%, will allow the
presence of noise in the data. As a result, it is
Presence Analytics: Density-based Social Clustering for Mobile Users
59

Table 3: Social-DBSCAN clustering result for 20 unique locations. The student’s minimum attendance threshold was 40%
and the Coherence Coefficient was 0.6. This result was computed for the time interval from 18:00 - 21:00 every Monday of
the Spring term of 2015 (11 weeks period).
Location
ID.
Number of
Students
Number of
Discovered
Groups
Group
No.
Group
Size
Group Min
Attendance
Group Max
Attendance
Group Avg
Attendance
Standard
Deviation
Avg Number
of Students
Per Session
#1 118 1 1 116 5 10 5.94 1.08 62.64
#2 102 1 1 99 5 9 6.00 1.15 54.00
#3 62 3 1 47 5 10 6.28 1.22 31.91
62 3 2 8 5 6 5.13 0.33
62 3 3 3 5 5 5.00 0.00
#4 53 1 1 50 5 10 6.40 1.40 29.09
#5 34 1 1 28 5 10 6.07 1.46 15.45
#6 32 1 1 30 5 9 6.93 1.26 18.91
#7 27 3 1 13 5 9 7.62 1.21 12.18
27 3 2 4 6 7 6.25 0.43
27 3 3 2 5 5 5.00 0.00
#8 32 2 1 27 5 9 7.04 1.23 18.18
32 2 2 2 5 5 5.00 0.00
#9 26 3 1 15 5 8 6.87 1.02 11.18
26 3 2 2 5 5 5.00 0.00
26 3 3 2 5 5 5.00 0.00
#10 17 3 1 9 5 9 7.11 1.20 7.64
17 3 2 2 5 5 5.00 0.00
17 3 3 2 5 5 5.00 0.00
#11 17 2 1 8 5 10 6.75 1.71 6.27
17 2 2 3 5 5 5.00 0.00
#12 15 1 1 13 5 9 6.46 1.34 7.64
#13 16 2 1 9 5 9 6.67 1.33 6.55
16 2 2 2 6 6 6.00 0.00
#14 10 1 1 6 5 8 6.00 1.15 3.27
#15 11 2 1 2 9 10 9.50 0.50 5.45
11 2 2 7 5 7 5.86 0.99
more likely that more than one group of individ-
uals with different level of attendance can be dis-
covered.
2. In some cases, as show in Table 2, the average
number of students per session is larger than twice
the capacity of the target location, which is an-
other sign of existence of remaining noise in the
data.
It is evident from this result that performing the
30% filtering was not sufficient to removeall the noise
and thus 30% is rather a small value for the minimum
attendance threshold.
6.2 Setting The Minimum Attendance
at 40%
Following the result shown in Table 2 and the discus-
sion given in Section 6.1 above, we argue that using
a higher minimum attendance threshold value will fil-
ter out more noise and thus increase the coherence in
the discovered groups. For the set of experiments dis-
cussed in this section, we raised the minimum atten-
dance threshold to 40% in order to obtained a more
accurate and consistent result, which we summarised
as follows:
1. With exception to locations #9 and #10, for every
location (see the result in Table 3), we detected a
smaller number of groups as opposed to the result
shown in Table 2. This is an indication that the
visitors of the target location were more likely at-
tending a regular learning activity that was taking
place there, over the 11 weeks period.
2. With exception to location #1, for every location,
the average number of students per session was al-
ways smaller than the capacity of the target loca-
tion. After the verification against the timetable,
it appears that location #1 hosted two classes on
Monday evening; one class running from 18:00 -
19:30 and the other from 19:30 - 21:00. The fact
that the average number of students per session
for the location was only 11% lower than twice the
capacity, shows that the clustering result is consis-
tent with the finding that the location hosted two
session on Monday evening.
3. As shown in both Tables 2 and 3, the average
number of students per session for some of the
locations was far too small in comparison to the
capacity of the target location (e.g. locations #14
and #15). Such situation can be attributed to
the possibility that a substantiated number of stu-
WINSYS 2016 - International Conference on Wireless Networks and Mobile Systems
60

dents in those classes might not have been active
Eduroam users.
6.3 Removing Noise Due to Irregular
Attendance
Is is very usual to have noise due to the wifi detecting
all movement within the vicinity of a target location.
One way to ensure that such noise is filtered out from
the data is to approximate the time spent at the target
location and discount those individuals who spent a
short time in the vicinity of the location. However, an
individual who is present in the vicinity with no in-
tention to attend the class at the target location is very
unlikely to consistently appear at the same location
at the same time of the day over the 11 week period.
Thus, the noise due to such inconsistent appearance at
the target location, can be removedby raising the min-
imum attendance threshold, which ensures that only
individuals with consistent attendance remain in the
data.
6.4 Sensitivity to Ordering of Points in
the Dataset Being Clustered
A key advantage of our proposed Social-DBSCAN,
over DBSCAN is that the latter is insensitive to how
the points are ordered in the data set considered for
clustering. This insensitivity of DBSCAN to the or-
dering of the points means that those points which
are situated at the edges of the discovered clusters
might change their cluster membership if the order-
ing is changed. Therefore, applying the original DB-
SCAN to the problem addressed in this paper may not
give the correct result. This indeed the case when we
consider discovering the social grouping in a setting,
where the possibility of the points changing their or-
dering is a common situation. In Social-DBSCAN
however, we impose a specific ordering for the data
points considered for clustering.
6.5 Robustness Against Incoherent
Revisits
One of the very attractive features that our proposed
Social-DBSCAN shares with DBSCAN is the robust-
ness to outliers (Kriegel et al., 2011) and (Ester et al.,
1996), which Social-DBSCAN capitalises on to en-
sure that coherent groups do not contain any inco-
herent member points. However, even after filtering
noise out and clustering the points using the Jaccard-
based distance, we may still discover more than one
coherent group. In the context of class detection, the
occurrence of such scenario can be attributed to the
possibility that there may be two classes sharing the
period from 18:00-21:00, e.g. one class running from
18:00 - 19:30 and another running from 19:30 - 21:00.
Another interpretation is that some students may
have irregular attendance patterns due to some special
circumstances such as unexpected additional work
commitment. In such case, the majority of the stu-
dents are usually clustered together in one single large
group while those students with irregular attendance
form a small-sized group or groups (see the result for
location #3 in Table 3). In any case, Social-DBSCAN
ensures that incoherent behaviour is separated from
the dominant coherent pattern extracted from the data.
7 CONCLUSION AND FUTURE
WORK
7.1 Conclusion
We demonstrate how social density-based clustering
of WLAN traces can be utilised to detect granular so-
cial groups of mobile users within a university cam-
pus. We showed how by being able to detect social
groups at target locations, we provide an invaluable
opportunityto understand the presence and movement
of people within their work, leisure or study envi-
ronment. Here we illustrated that by using the pro-
posed Social-DBSCAN, we can automatically detect
the regular learning activities taking palce at chosen
locations, and provide accurate estimates about their
attendance levels.
7.2 Future Work
Our future research is threefold:
1. The next development step for the work presented
in this paper is to cluster or group learning activi-
ties (e.g. modules) together in order to discover a
higher level of grouping. The intuition here is that
these higher level groups will directly correspond
to the clusters formed with respect to the member-
ship in the study programmes that the students are
enrolled in.
2. Another key investigation that we are focusing
on is how do people spend their time during
breaks. We are particularly interested in finding
out where students spend their time during breaks
and whether they maintain any social grouping
during this time and how often such social groups
meet.
Presence Analytics: Density-based Social Clustering for Mobile Users
61

3. Since the capacity of each location is known, we
would like to estimate the actual space usage of
the target locations over the term period and also
over the academic year. Unfortunately, at the
present time, a substantial proportion of the stu-
dents are not active users of Eduroam, and thus
we do not have fully accurate statistics in order
to provide accurate estimates about the usage of
space.
ACKNOWLEDGEMENTS
We thank Kevin Brunt from Birkbeck IT Services
who extracted the data set for us for the purpose of
this research.
REFERENCES
Allahdadi, A., Morla, R., Aguiar, A., and Cardoso, J. S.
(2013). Predicting short 802.11 sessions from radius
usage data. In Local Computer Networks Workshops
(LCN Workshops), 2013 IEEE 38th Conference on,
pages 1–8. IEEE.
Birkbeck, U. o. L. (2016). Birkbeck in numbers.
http://www.bbk.ac.uk/about-us/bbk/downloads/2014-
articles/bbk33-53-numbers.pdf. Last accessed on
March 14, 2016.
Birkbeck Eduroam, U. o. L. (2016). Eduroam
at Birkbeck, University of London.
http://www.bbk.ac.uk/its/services/wam/eduroam.
Last accessed on March 14, 2016.
Cheetham, A. H. and Hazel, J. E. (1969). Binary (presence-
absence) similarity coefficients. Journal of Paleontol-
ogy, pages 1130–1136.
Clauset, A., Shalizi, C. R., and Newman, M. E. (2009).
Power-law distributions in empirical data. SIAM re-
view, 51(4):661–703.
Eagle, N. and Pentland, A. (2006). Reality mining: sens-
ing complex social systems. Personal and ubiquitous
computing, 10(4):255–268.
Eduroam (2016). Eduroam. https://www.eduroam.org/.
Last accessed on March 14, 2016.
Eldaw, M., Levene, M., and Roussos, G. (2016). Presence
analytics: Discovering meaningful patterns about hu-
man presence using wlan digital imprints. In Proceed-
ings of The International Conference on Internet of
Things and Cloud Computing (ICC 2016). ACM.
Ester, M., Kriegel, H.-P., Sander, J., and Xu, X. (1996).
A density-based algorithm for discovering clusters in
large spatial databases with noise. In Kdd, volume 96,
pages 226–231.
Kriegel, H.-P., Kr¨oger, P., Sander, J., and Zimek, A.
(2011). Density-based clustering. Wiley Interdisci-
plinary Reviews: Data Mining and Knowledge Dis-
covery, 1(3):231–240.
Kumar, U., Yadav, N., and Helmy, A. (2008). Gender-based
feature analysis in campus-wide wlans. ACM SIGMO-
BILE Mobile Computing and Communications Re-
view, 12(1):40–42.
Lee, J.-K. and Hou, J. C. (2006). Modeling steady-state
and transient behaviors of user mobility: formulation,
analysis, and application. In Proceedings of the 7th
ACM international symposium on Mobile ad hoc net-
working and computing, pages 85–96. ACM.
Mulhanga, M. M., Lima, S. R., and Carvalho, P. (2011).
Characterising university wlans within eduroam con-
text. In Smart Spaces and Next Generation
Wired/Wireless Networking, pages 382–394. Springer.
Sneath, P. H. (1957). The application of computers to tax-
onomy. Journal of general microbiology, 17(1):201–
226.
Sp¨ath, H. (1980). Cluster analysis algorithms for data re-
duction and classification of objects.
WINSYS 2016 - International Conference on Wireless Networks and Mobile Systems
62
