
Experimental Evaluation of Some Indoor Exploration Strategies
Jens Wettach and Karsten Berns
Robotics Research Lab, University of Kaiserslautern, Gottlieb-Daimler Straße, Kaiserslautern, Germany
Keywords:
Robotics, Exploration, Indoor Environments, Experiments, Evaluation.
Abstract:
A key capability of any indoor service robot is to explore arbitrary, unknown environments in order to record
a complete and correct map in minimal time. Such a map is a prerequisite of common tasks like surveillance,
transportation as well as search and rescue. In recent years a series of solutions has been proposed by the
authors: a dynamic enhancement of the frontier-based approach, ground plan-based exploration and a hybrid
combination of both. This paper evaluates the performance of each of these strategies within an everyday
office scenario in simulation and reality and discusses their pros and cons.
1 INTRODUCTION
In order to perform a service task like surveillance
or transportation efficiently, a robot needs an accurate
map of its working space. Ideally, the robot should be
able to derive this map autonomously, so it can adapt
to a priori unknown environments without user inter-
vention. Feasible SLAM solutions exist for map con-
struction. But calculating a trajectory, that allows to
record a complete and correct map in minimal time,
is still an open problem. In the past, three solutions
have been developed by the authors of this paper, all
following the cyclic next best viewing pose (NBV) ap-
proach of (Amigoni, 2005). Each iteration consists of
three steps: map update, NBV calculation and target
approach. The strategies mainly differ in the type of
map and the sophistication of the NBV computation.
Subject of this paper is to evaluate and compare
the power of these approaches in a daily office sce-
nario, both under well-defined conditions in simu-
lation and in a real office scenario with dynamic
changes (doors, people). Nota bene, the focus is on
the performance of the proposed solutions in a typical
application environment, especially on the differences
between simulation and reality as well as between the
three strategies. In contrast, an analysis of their ef-
fectiveness in different environmental layouts and a
comparison to competitive state of the art approaches
is subject of ongoing research.
Section 2 presents important state of the art solu-
tions regarding indoor exploration. The sophistication
of the respective approaches is condensed for putting
the strategies under study into context. Since each of
them has been published previously, only their main
ideas and features are introduced in section 3. The
experimental evaluation is described in section 4, and
the findings are condensed in section 5.
2 STATE OF THE ART
(Yamauchi, 1997) has developed one of the most fa-
mous approaches: NBVs are derived from the frontiers
between unknown space and regions already known
as free in an occupancy grid map. The one that maxi-
mizes expected information gain, i. e. frontier length,
is selected in Greedy manner. (Oriolo, 2004) de-
scribes a far simpler strategy based on random mo-
tions. (Freda, 2005) biases the random motion to-
wards the free frontiers of the known space.
(Gonz
´
alez-Ba
˜
nos, 1999) and (Gonz
´
alez-Ba
˜
nos,
2002) create polygonal maps of the environment
based on the concept of the safe region, i. e. the areas
already known as traversable. NBVs are sampled
everywhere within these areas and scored by weight-
ing expected information gain and travel cost. (Sur-
mann, 2003) uses polygonal 2D maps on several hori-
zontal height levels in order to generate a 3D model of
the working space. Within each map, NBVs are calcu-
lated along the frontiers, and the most promising one
regarding information gain is selected greedily.
(Makarenko, 2002) has defined the problem of
automatically mapping an unknown environment for-
mally as integrated exploration. Accordingly, three
tasks have to be performed at the same time: map-
ping, localization and navigation. Hence, three cri-
280
Wettach, J. and Berns, K.
Experimental Evaluation of Some Indoor Exploration Strategies.
DOI: 10.5220/0005977502800287
In Proceedings of the 13th International Conference on Informatics in Control, Automation and Robotics (ICINCO 2016) - Volume 2, pages 280-287
ISBN: 978-989-758-198-4
Copyright
c
2016 by SCITEPRESS – Science and Technology Publications, Lda. All rights reserved

teria are evaluated simultaneously as a weighted sum:
information gain, travel cost and localizability. NBVs
are either taken from the frontiers or from locations
with a high chance of relocalization. (Amigoni, 2004)
and (Amigoni, 2005) propose NBV exploration as a
common solution: first the current map is updated;
then a series of viewpoints is generated and the most
promising one is selected via a scoring function; fi-
nally this position is approached. In contrast to the
previously used ad hoc functions, where determining
feasible weights is an open problem, here the entropy
of information gain and of travel cost is calculated
based on information theory. Whereas (Amigoni,
2004) balances these two criteria, (Amigoni, 2005)
performs a multi-objective optimization using also lo-
calization (map overlap) for calculating the Pareto-
optimal viewpoint candidate as NBV. As a further
extension, (Basilico, 2011) applies multi-criteria de-
cision making (MCDM) and fuzzy functions for an
online adaptation of the exploration criteria, e. g. in-
formation gain, travel cost and either chance of estab-
lishing a wireless link to a fixed base station or chance
of reaching a charging station.
Beside the sophistication of the NBV scoring, the
kind of mapped features and the strategy of map
evaluation influences the exploration performance.
(Wurm, 2008) proposes to segment the already known
map according to the structure of the environment,
e. g. into different rooms, and to perform a segment-
wise exploration. Assigning to each robot a different
segment yields a very efficient coordination of multi-
ple robots. Similarly, (Schmidt, 2006) combines re-
active behaviors for exploring the current room and
deliberative behaviors for switching between rooms.
The trajectory is continuously adapted to the changes
of the map. (Maffei, 2014) also performs an online
adaptation by regarding exploration as a boundary
value problem in a potential field: obstacles have high
potential, unknown regions a low value and already
visited areas a variable one. Revisiting known areas
supports relocalization. Distortions are added to bal-
ance relocalization and information gain.
Finally, several comparative studies analyze the
pros and cons of existing approaches in order to de-
rive hints for future improvements. (Amigoni, 2008)
reports that a Greedy selection of NBVs based on in-
formation gain performs better than a random choice,
and balancing utility and travel cost is even more ef-
ficient. However, a significant difference between an
ad hoc function (Gonz
´
alez-Ba
˜
nos, 2002) and a scor-
ing measure based on information theory (Amigoni,
2004) could not be approved. In contrast to that,
(Holz, 2011) has demonstrated that balancing two
criteria (Gonz
´
alez-Ba
˜
nos, 2002) is not always better
than a simple Greedy approach choosing the clos-
est frontier and that a sound design of the viewing
pose candidate (vp) evaluation function like MCDM
(Basilico, 2011) pays off. Furthermore, a continu-
ous re-evaluation of the selected NBV based on on-
line map updates and a segmentation of the working
space have been proposed for increasing exploration
efficiency. In this regard, (Amigoni, 2013) has ana-
lyzed the influence of the frequency of map updates
(perception) and of NBV selection (decision) on the
exploration performance. As a result, a frequency-
based approach with online updates outperforms the
classic event-based scheme (updates only at an NBV),
especially in unstructured environments, but the fre-
quencies have to be adapted to the computational ef-
fort of the continuous re-evaluation.
The strategies discussed in this paper rely on a
continuously updated 2.5D grid map, but on a dis-
crete NBV selection. Hence, the target is not changed
once it has been determined, and either it is reached
in a reasonable time span or marked as inaccessible.
The trajectory is adapted online to new map informa-
tion and dynamic changes (people walking around,
doors opened or closed) during NBV approach. Thus
it may leave the areas that are known at the mo-
ment of the target selection. This yields a more flex-
ible approach than those of (Yamauchi, 1997) and
(Gonz
´
alez-Ba
˜
nos, 2002). Vps are sampled along
frontiers or within polygonal maps of floor and ceil-
ing, derived from a 3D reconstruction of the working
space similar to (Surmann, 2003). The scoring func-
tion is designed as weighted sum as in (Makarenko,
2002) and balances information gain, travel cost and
dispersion of NBVs. Localization is delegated to a
continuously operating particle filter and therefore no
issue for the scoring. The focus is on examining how
the developed approaches perform in a real world ap-
plication, what the benefit of evaluating 3D features
is, how the strategies cope with dynamic changes and
how a combination of a sophisticated strategy with a
fallback to a simple, but always working approach in-
fluences the reliability of the exploration process.
3 EXPLORATION STRATEGIES
The three exploration approaches under observation
have been presented in preceding papers. For a bet-
ter understanding, the main ideas and key features are
summarized in the following. Common base is an in-
door robot, shown in figure 1. It is equipped with a
differential drive, a planar laser scanner at the front
and the back, a circumferential belt of ultrasonic sen-
sors and a 3D laser scanner.
Experimental Evaluation of Some Indoor Exploration Strategies
281
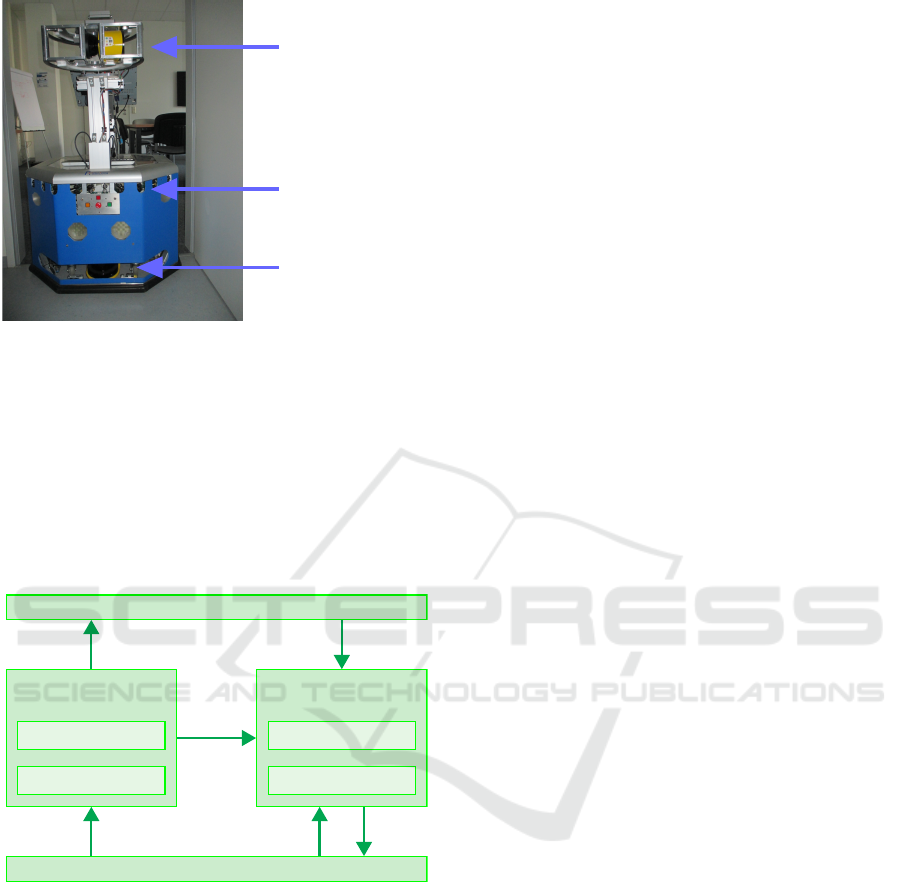
planar scanner
ultrasound
3D scanner
Figure 1: Robot and sensors used for exploration.
Figure 2 presents the common concept for all three
strategies. Hardware abstraction, SLAM and naviga-
tion are shared. On the lowest level, distance meas-
urements are fused into local obstacle memories and
overlaid sector maps as virtual sensors. Besides, ab-
stract motion commands are transformed into con-
trol values for the differential drive. Localization is
based on odometry plus continuous pose corrections
via DP-SLAM (Eliazar, 2003). Mapping constructs a
Exploration
Mapping
SLAM
Localization
Path Planning
Navigation
Obstacle Avoidance
Hardware Abstraction
map
NBV
sensor data sensor data
motor
control
map
Figure 2: Concept of integrated exploration.
2.5D occupancy grid map, filled with distance meas-
urements of all laser scanners. The SLAM unit facil-
itates online map updates, while the robot is moving.
Obstacle avoidance is realized by a network of anti-
collision, keep distance and evasion behaviors accord-
ing to the iB2C methodology (Proetzsch, 2010). The
behaviors evaluate the sector maps for analyzing the
free space around the robot and compute abstract mo-
tor control commands. The navigation unit guides the
robot to an NBV computed by the explorer. This goal
approach uses A
?
for planning an initial path. It is
transformed into an elastic band that performs a con-
tinuous free space analysis and adapts the path ac-
cording to the online map updates (Quinlan, 1993).
Consequently, the three approaches differ in the
strategy for calculating the series of NBVs. The dy-
namic frontier-based approach only evaluates the oc-
cupancy grid map, whereas the ground plan-based
and the hybrid approach record the layout of floor and
ceiling for deriving better vp candidates.
SCORE(vp
i
) = λ
i
· information gain(vp
i
)
+ λ
u
· unknown cells(vp
i
)
− λ
c
· cost(vp
i
)
− λ
o
· occupied cells(vp
i
)
− λ
d p
· distance to past nbv(vp
i
)
− λ
du
· distance to unreachable nbv(vp
i
)
(1)
In order to determine the NBV at a particular explo-
ration step, a set V P = {vp
i
} of viewing pose candi-
dates is generated, and the best one is calculated via
the scoring function (1). This function is the same for
all three approaches regarding its layout as weighted
sum and its parameters λ
λ
λ, but the contributing factors
are calculated differently for each strategy based on
the features that are recorded in the respective map.
Advantages of a vp are expected information gain
according to the particular strategy and number of un-
known cells at vp in the occupancy grid map. Dis-
advantages are path cost, number of occupied grid
cells at vp as well as distance to past and unreach-
able NBVs. The last two factors guarantee an efficient
dispersion of NBVs. First, the robot has to keep off
previously visited areas, at least as long as there are
promising vps in unknown regions. Even more im-
portant is to stay away from NBVs that could not be
reached in the past, because these give a hint for an
unknown, but attractive area that cannot be mapped,
e. g. a neighboring room only visible through a win-
dow. Hence the last factor avoids deadlocks. All
values are calculated in relation to the respective op-
timum, that is minimum for dispersion and maxi-
mum for all other factors, i. e. they are normalized
to [0, 1]. The set of scoring weights λ
λ
λ = (λ
i
,λ
u
,λ
c
,λ
o
,
λ
d p
,λ
du
) defines the exploration “mood”, e. g. curios-
ity or guardedness. Reasonable values have been de-
termined via comprehensive experiments (sec. 4.1).
An important issue of any exploration strategy is
the termination criterion. The challenge is to decide
whether the accessible areas have been mapped ex-
haustively. Especially in real world scenarios, the ro-
bot may not be able to approach some visible places
closely enough due to narrow space or a door closed
casually. For this purpose, any NBV, that cannot be
reached in a certain period of time, is recorded as un-
reachable, and new vp candidates, that are close to
such one, get a high penalty. On the other hand, the
expected information gain decreases over time since
ICINCO 2016 - 13th International Conference on Informatics in Control, Automation and Robotics
282
the remaining unknown areas shrink. Hence, the al-
gorithm stops when the score of the vp candidates at
a certain exploration step indicates, that there are no
rewarding targets left.
Dynamic Frontier-based Exploration. (Wettach,
2010) has extended the frontier-based strategy of (Ya-
mauchi, 1997) by a continuous localization and the
option to leave the safe region while approaching the
NBV. This facilitates online map updates even in un-
known areas and reduces detours. Vp candidates are
derived from the center of the free frontiers. Expected
information gain is calculated as length of the respec-
tive frontier. Unknown and occupied cells are calcu-
lated within a circular area with a predefined radius
around the vp. Path cost is given by the A
?
planner.
The distances to past and unreachable NBVs are com-
puted via the Euclidean norm.
Ground Plan-based Exploration. (Wettach, 2012)
calculates NBVs from the differences between floor
and ceiling: space visible at the floor, but hidden at
the ceiling is usually caused by open doors; free space
in the ceiling, that is blocked on the floor, marks inac-
cessible regions that deserve a closer look, e. g. due to
furniture or a closed door with skylight. At each NBV
a 3D point cloud is collected via a 360
◦
panorama
scan, and the main structures of the environment are
extracted by RANSAC-based plane fitting. This way
the ground plan of floor and ceiling is reconstructed
and recorded as polygonal maps. Vps are derived as
center of the difference polygons, and expected infor-
mation gain is calculated as polygon area. All other
scoring factors are computed from the grid map as for
the frontier-based approach.
Hybrid Exploration. In extreme situations the
ground plan approach may fail: unobstructed areas
like corridors do not provide significant differences
between floor and ceiling and thus no valid vp candi-
dates; in narrow places like door frames a panorama
scan may not be performed safely due to the protrud-
ing 3D scanner. (Wettach, 2014) has developed a hy-
brid strategy, that evaluates the ground plans when-
ever possible and that uses the frontier information as
a fallback. Expected information gain is either com-
puted from the difference polygons or from the fron-
tier length, whereas all other contributing factors of
the scoring function (1) are derived from the grid map.
4 EXPERIMENTAL EVALUATION
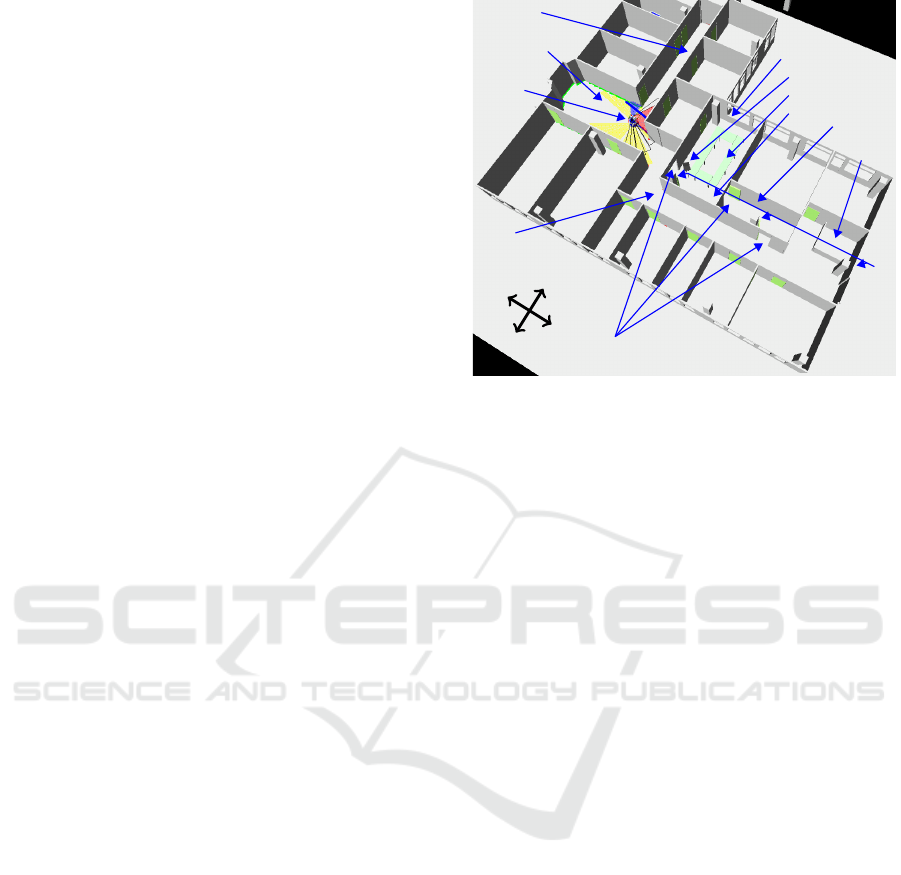
The exploration strategies have been evaluated in a
simulated office scenario, shown in figure 3, as well
as in its real world counterpart. It consists of an
meeting room
chair
tables
kitchen
stairway
open doors
pillars
hallway
hallway
robot
entrance
hall
start pose
a
b
c
E
W
N
S
Figure 3: Simulated office scene (from (Wettach, 2014)).
Open doors are marked with labels a, b, c.
L-shaped hallway with an open entrance hall in be-
tween and adjacent offices on each side. Since the
tests took place at common business hours, the office
rooms have been made inaccessible order to limit the
complexity of the experiments. Challenges are repre-
sented by a meeting room, equipped with tables and
chairs, as well as by a small kitchen. The respective
doors have been kept statically open. Figure 1 shows
the robot passing the door (b) from meeting room to
kitchen. Obviously, changing the room is a critical
operation due to the dimensions of doors and robot.
Besides, both rooms can be left via opposite doors,
yielding a potential loop as trial for the DP-SLAM
unit. The descending stairway at the south-east end
of the corridor represents a negative obstacle in real-
ity and is modeled by half-height walls in simulation.
The virtual model serves as ground truth, because it
has been built based on the construction plan of the
building. Naturally, the real scenario contains addi-
tional difficulties: the kitchen is equipped with a ta-
ble and a dresser; there are environmental dynamics,
e. g. people walking around, doors casually opened
and closed; sometimes doors closed in simulation stay
partially open, so the robot can look into but not enter
the neighboring room, which yields a big challenge
for the deadlock prevention (see figures 8, 9, and 10).
4.1 Impact of the Scoring Weights
In order to show the impact of the weights λ
λ
λ in func-
tion (1), two different sets λ
λ
λ
1
= (5, 1,15, 1,8,50) and
λ
λ
λ
2
= (20,10, 12,5,8, 50) are compared via a test run
of the dynamic frontier-based exploration in simula-
tion. In both sets, deadlock prevention is most im-
Experimental Evaluation of Some Indoor Exploration Strategies
283
portant in order to cope with traps of attractive, but
inaccessible areas like the stairway in the south corri-
dor. λ
λ
λ
1
then focuses on the path cost in order to avoid
oscillations between opposite borders of the known
space, i. e. to exploit locality. The distance to past
NBVs serves as a counterpart in order to achieve a
reasonable dispersion of NBVs. Expected information
gain is slightly less important. For putting the focus
on these four criteria, the unknown and the occupied
grid cells in the vicinity of a vp have least influence.
Apart from deadlock prevention, λ
λ
λ
2
emphasizes
information gain, followed by path cost in order to ex-
ploit locality. Number of unknown grid cells around
the target is a second measure of information gain and
has slightly less influence, similar to distance to past
NBVs as antagonist to locality. Estimated accessibil-
ity of the target is least important.
W
E
S
N
Figure 4: Simulation result of dynamic frontier-based ex-
ploration using scoring weights λ
λ
λ
1
= (5,1, 15,1,8, 50), with
occupied grid cells (red), NBVs (blue), trajectory (green)
and map orientation (cross hairs).
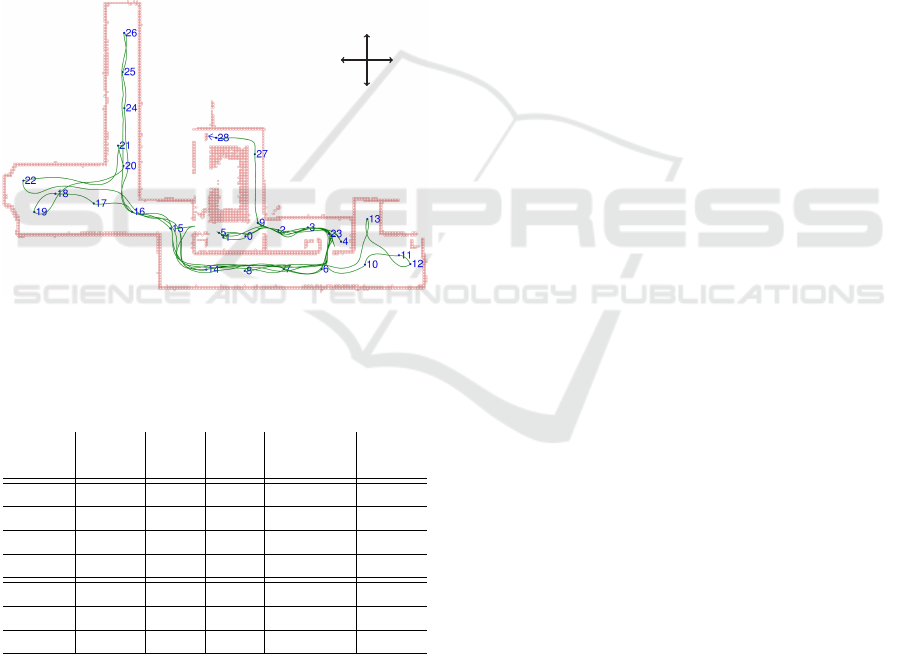
Table 1: Summary of experimental results.
Run Comp Corr T
Exp
∑
NBVs
k
ET
k
% % min w/o scan m
fig. 4 6
6
6.
.
.5
5
59
9
9 2.79 56.5 29/8 232
fig. 5 14.4 1.87 3
3
30
0
0 22/2 160
fig. 6 14.5 1
1
1.
.
.6
6
64
4
4 37.5 1
1
16
6
6 9
9
99
9
9.
.
.4
4
4
fig. 7 11.5 2.38 53.8 24/5 139.9
fig. 8 5
5
51
1
1 2
2
25
5
5/7 2
2
20
0
08
8
8.
.
.0
0
0
fig. 9 94 33 273.2
fig. 10 83.8 30/5 247.4
Figure 4 shows the test run with λ
λ
λ
1
, and figure 5
the one with λ
λ
λ
2
. The benchmark values are summa-
rized in table 1 (see sec. 4.2 for a description). λ
λ
λ
1
yields significantly more detours than λ
λ
λ
2
, i. e. oscilla-
tions between meeting room, kitchen and corridor,
which leads to a much longer trajectory (232 m vs.
160 m) and exploration time (56.5 min vs. 30 min).
At least, λ
λ
λ
1
is competitive regarding map complete-
ness and correctness. In sum, λ
λ
λ
2
seems more promis-
ing due to the reduced execution time. Since here the
focus is on evaluating the different strategies depend-
ing on environmental conditions, λ
λ
λ
2
is used for all
subsequent experiments.
4.2 Comparison of the Three Strategies
In the following a test run with the robot starting in the
meeting room facing to the east is performed for all
three exploration strategies, first in simulation, then in
the real environment. System parameters like scoring
weights, prefiltering of vp candidates and number of
replanning operations per NBV are fixed for all runs.
The maximum velocity of the robot has been limited
to 0.35 m/s. In simulation, the DP-SLAM unit and
corresponding pose correction have been switched off
in order to examine the power of the approaches with-
out odometry errors.
For comparing the results, a set of benchmarks has
been defined. Non-functional criteria are: robustness
regarding collision avoidance: the robot must not hit
any object; deadlock prevention: the algorithm has to
terminate in finite time; a priori knowledge: a grid
cell may either be free or occupied, floor and ceiling
can be described by a set of polygons; genuineness of
application: the test has to be performed in an every-
day scene. These criteria have been fulfilled equally
by each experiment. Functional criteria are map com-
pleteness (Comp), map correctness (Corr) and explo-
ration time (T
Exp
), because the goal is to record a
complete and correct map in minimal time. Number
of NBVs with and without 3D scan and length of the
exploration trajectory
k
ET
k
are subordinated param-
eters, indicating how the needed time has been spent.
All these values are summarized in table 1.
T
Exp
,
∑
NBVs and
k
ET
k
are measured directly.
Comp is the number of cells missing in the recorded
map wrt. a ground truth map (derived from a con-
struction plan) versus total number of cells in the true
map (false negatives). Corr is calculated as number
of cells in the recorded map that are not present in
the true map versus total number of cells in this map
(false positives). For reasons of comparability, Comp
and Corr are always calculated for the grid map. In
reality, these two criteria can only be qualitatively in-
spected due to significant map inaccuracies arising
from SLAM errors.
4.3 Simulation Experiments
Figure 5 shows the result of the dynamic frontier-
based exploration in simulation. First, meeting room
and kitchen are explored (vp 0-2), followed by the
ICINCO 2016 - 13th International Conference on Informatics in Control, Automation and Robotics
284
south corridor (3-9). At positions 10, 11 time con-
suming oscillations back to distant, previously visited
areas occur. Eventually, the robot explores the en-
trance area and north corridor (12-20), before return-
ing to the last open frontier at the staircase (21). A
panorama scan took 30 s on average, i. e. 10 min in
total for 20 NBVs (no scan at vp 1, 21 due to close ob-
stacles). T
Exp
= 30min is the minimum over all test
runs.
k
ET
k
= 160m yields a minimum travel time of
7 min 37 s (at maximum velocity). The time penalty
of 12 min arises from slow-downs in narrow passages.
Obviously, the robot never passed door (c) between
meeting room and corridor (cf. fig. 3), because this
passage is most challenging due to tables and a chair
opposite to the door leaf. Besides, the meeting room
could not be recorded completely, leading to a signifi-
cant Comp errors. At least Corr is quite competitive.
W
E
S
N
Figure 5: Simulation result of dynamic frontier-based ex-
ploration using scoring weights λ
λ
λ
2
= (20, 10,12,5, 8,50),
with occupied grid cells (red), NBVs (blue), trajectory
(green) and map orientation (cross hairs).
The test run for the ground plan-based explo-
ration is given in figure 6. Apart from some difficul-
ties at the beginning (0, 1), the trajectory is a straight-
forward loop through the whole working space, close
to how a person would explore the environment. Ac-
cordingly,
k
ET
k
= 99.4 m and 16 NBVs are minimal
over all test runs. Each scan took about 60 s, due to
the time needed for updating the polygonal maps, re-
sulting in a slight increase of T
Exp
= 37.5 min. This
yields 16 min for the scans, a minimum travel time
of 4 min 44 s and a time penalty of 17 min for slow-
downs. Comp and Corr are similar to the previous
run. However, meeting room and staircase area are
now almost completely covered.
Figure 7 reveals that the hybrid strategy performs
significantly worse. Meeting room, kitchen and south
corridor are explored quickly (0-7). But then a couple
of oscillations occurs by moving back to the meet-
ing room (8, 9), to the staircase (10, 11) and to the
kitchen (12-14). Afterwards, the remainder of the
0
1
W
E
S
N
Figure 6: Simulation result of ground plan-based explo-
ration, with ground plan of floor (orange) and ceiling (blue).
8,9
14
3,12
23
W
E
S
N
Figure 7: Simulation result of hybrid exploration.
south corridor, entrance area and north hallway are
explored (15-22), before the meeting room is reen-
tered from the west (23). Apart from the oscillations,
the trajectory represents the same basic loop as in the
previous run. T
Exp
= 53.8 min is fairly poor and the
number of NBVs is significantly increased to 24 (no
scan at vp 1, 4, 9, 14, 23, due to close obstacles). At
least
k
ET
k
= 139.9 m is better than for the frontier
approach. This yields a minimum travel time of 6 min
40 s, 19 min for the scans and 28 min for slow-downs,
i. e. more than 50 %. As indicated by the accumula-
tion of NBVs, this time penalty is caused by narrow
passages in the meeting room and kitchen. However,
Comp and Corr are competitive, i. e. errors are only
slightly increased, and completeness is significantly
better.
4.4 Real World Experiments
In the real office scenario, the experiments are af-
fected by environmental dynamics beyond control,
e. g. actuated doors and people walking around. Be-
sides, the SLAM unit does not provide a common ref-
erence frame, i. e. the pose of the robot while record-
Experimental Evaluation of Some Indoor Exploration Strategies
285
ing the initial map defines its orientation. Therefore,
it is indicated by cross hairs for better comparability.
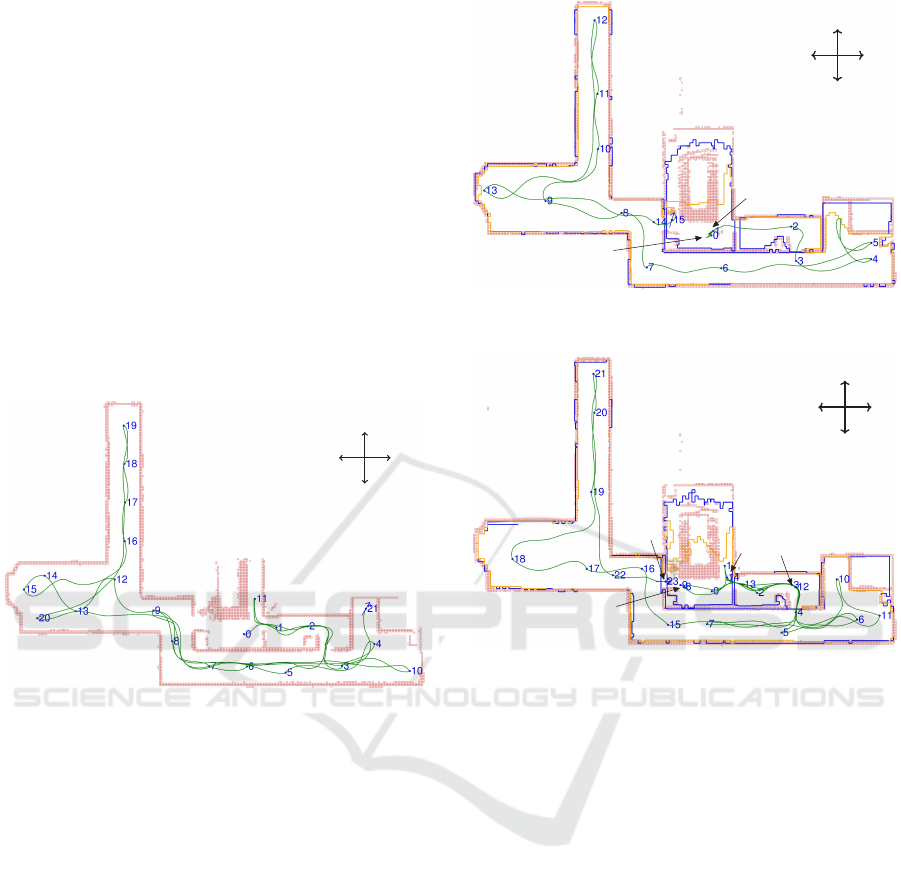
23, 24
14, 15
half-open doors
trajectory loop
F
H
N
W
E
S
N
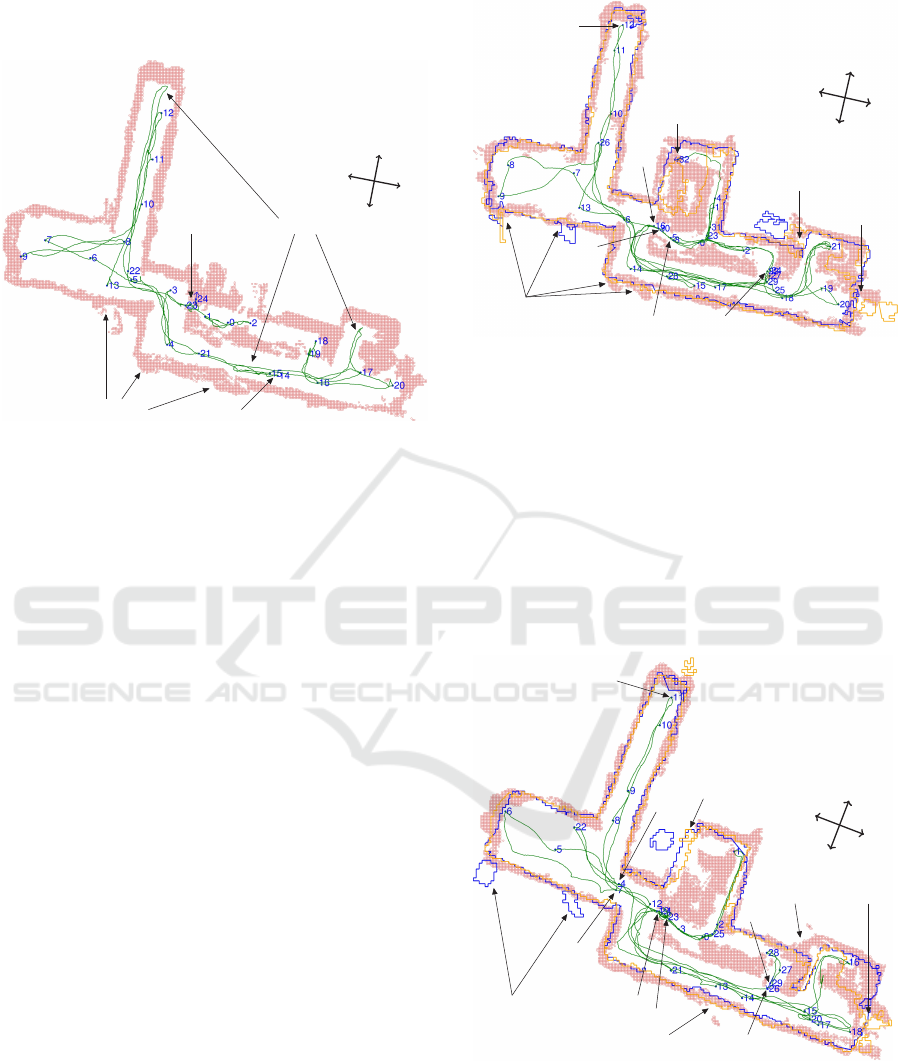
Figure 8: Real world result of dynamic frontier-based ex-
ploration.
Figure 8 shows how the dynamic frontier-based
strategy guides the robot from the meeting room (vp
0-2) through the west door (c) into the corridor (3-
4), entrance area (5-9) and north hallway (10-12). On
the way back to the south corridor, it is attracted by
some half-open doors (13-15), resulting in a local tra-
jectory loop F, until the deadlock prevention inter-
venes. While exploring the remainder of the corridor
and the kitchen (16-20), small navigation problems
occur (H). Finally, the robot tries to get back to the
meeting room at NBVs 23, 24 via intermediate scans
(21, 22). Here, the planner searches for an alterna-
tive to door (c), as the loop to the north corridor N
indicates. Despite the challenges of the real world,
T
Exp
= 51 min and 25 NBVs are quite competitive, at
least compared to the hybrid exploration in simula-
tion. The average time needed for a scan and map up-
date was 45 s, which yields 13.5 min in total (no scan
at vp 2, 9, 13, 18, 19, 22 and 23).
k
ET
k
= 208 m is
significantly increased compared to the simulation re-
sults. This means a minimum travel time of 9 min 54 s
and a time penalty of about 27.5 min for slow-downs.
During the ground plan-based exploration,
shown in figure 9, the robot needs 5 NBVs (0, 1, 3-5)
plus a side trip to the kitchen (2), before it manages to
leave the meeting room via the west door. The accu-
mulation of NBVs 1, 4 and 3, 5 arises from the inabil-
ity to reach the original targets. Afterwards, entrance
hall (6-9), north (10-12) and south corridor (14, 15,
17-21) are explored quickly, only disturbed by an ad-
ditional scan (13) due to the adjacent half-open door
and an oscillation (16). After recording the rest of the
kitchen (22, 23), the map is rather complete. From
12
16
30
32
5,3
22,24,27
half-open doors
half-open door
door with
glass inset
W
E
S
N
Figure 9: Real world result of ground plan-based explo-
ration.
the following 9 vps, only the last one (32) provides
new information, whereas the intermediate oscilla-
tions reveal severe navigation problems due to envi-
ronmental dynamics. At least the strategy is robust
enough to prevent deadlocks and to terminate in finite
time. Correspondingly, 33 NBVs, T
Exp
= 94 min and
k
ET
k
= 273.2 m are the worst of all runs. Each scan
took about 81 s, i. e. 44 min 33 s in total, the minimum
travel time is 13 min and the penalty for slow-downs
36.5 min.
23
19,24
11
half-open doors
half-open door
half-open door
half-open door
29
26
7
4
door with
glass inset
W
E
S
N
Figure 10: Real world result of hybrid exploration.
As shown in figure 10, the hybrid strategy man-
ages to explore the whole meeting room rapidly via
NBVs 0-3, followed by the entrance (4-6), north (8-
11) and south corridor (12-18), with only one interme-
diate scan (7) due to the adjacent half-open door. The
oscillations between door (c) (19, 23, 24), south cor-
ICINCO 2016 - 13th International Conference on Informatics in Control, Automation and Robotics
286

ridor (20, 21) and entrance (22) are caused by the in-
ability to enter the kitchen via the west door (25). Fi-
nally, the robot drives back to door (a) and completes
the map (26-29). T
Exp
= 83.8min,
k
ET
k
= 247.4m
and 30 NBVs represent a slightly better performance
than in the previous run. The total scan time is 33 min
45 s (no scan at vp 2, 16, 19, 25, 29), the minimum
travel time is 12 min and the time penalty for slow-
downs 38 min.
In sum, table 1 shows that the dynamic frontier-
based approach is always the fastest due to the time
needed to construct the ground plans for the other two
strategies. However, these two produce significantly
more complete maps, especially regarding the meet-
ing room, both in simulation and reality. All three
procedures need notably more time, more NBVs and
a longer trajectory for the real world scenario. They
all manage to avoid deadlocks and to create a suit-
able map within a reasonable amount of time. All
in all, in simulation the ground plan-based approach
provides the best trade-off between needed time and
map quality, whereas in reality the hybrid approach is
most promising.
5 CONCLUSION
The paper has analyzed the performance of three
NBV exploration strategies, based on representative
test runs in a simulated office scene and in its real
world counterpart. They all use the same weighted
sum of influence factors for scoring vps, online map
updates and adaptation of the exploration trajectory.
They differ in the kind of mapped features (2.5D
grid map vs. ground plan of floor and ceiling) and
corresponding estimation of information gain (fron-
tier length vs. area of difference polygons). The
dynamic frontier-based approach yields always the
fastest, but incomplete results, whereas the best trade-
off between needed time and map quality is provided
by the ground plan-based procedure in simulation and
by the hybrid strategy in reality.
Future work concentrates on a comparison with
state of the art approaches and on analyzing the in-
fluence of the layout of the environment on the re-
sults, in order to check that the strategies work in gen-
eral. Other topics are to find a generally optimal set
of scoring weights and to improve and evaluate the
room-wise exploration approach of (Schmidt, 2006)
in obstructed real world scenarios.
REFERENCES
Amigoni, F. (2008). Experimental evaluation of some ex-
ploration strategies for mobile robots. ICRA.
Amigoni, F., Caglioti, V., and Galtarossa, U. (2004). A mo-
bile robot mapping system with an information-based
exploration strategy. ICINCO.
Amigoni, F. and Gallo, A. (2005). A multi-objective explo-
ration strategy for mobile robots. ICRA.
Amigoni, F., Li, A. Q., and Holz, D. (2013). Evaluating the
impact of perception and decision timing on autono-
mous robotic exploration. ECMR.
Basilico, N. and Amigoni, F. (2011). Exploration strategies
based on multi-criteria decision making for search and
rescue autonomous robots. AAMAS.
Eliazar, A. and Parr, R. (2003). DP-SLAM: Fast, robust
simultaneous localization and mapping without pre-
determined landmarks. IJCAI.
Freda, L. and Oriolo, G. (2005). Frontier-based probabilis-
tic strategies for sensor-based exploration. ICRA.
Gonz
´
alez-Ba
˜
nos, H., Mao, E., Latombe, J.-C., Murali, T.
M., and Efrat, A. Planning robot motion strategies for
efficient model construction. ISRR.
Gonz
´
alez-Ba
˜
nos, H. and Latombe, J.-C. (2002). Navigation
strategies for exploring indoor environments. IJRR
21(10-11).
Holz, D., Basilico, N., Amigoni, F., and Behnke, S. (2011).
A comparative evaluation of exploration strategies and
heuristics to improve them. ECMR.
Maffei, R., Jorge, V. A. M., Prestes, E., and Kolberg, M.
(2014). Integrated exploration using time-based po-
tential rails. ICRA.
Makarenko, A., Williams, S., Bourgault, F., and Durrant-
Whyte, H. (2002). An experiment in integrated explo-
ration. IROS.
Oriolo, G., Vendittelli, M., Freda, L., and Troso, G. (2004).
The SRT method: randomized strategies for explo-
ration. ICRA.
Proetzsch, M., Luksch, T., and Berns, K. (2010). Develop-
ment of complex robotic systems using the behavior-
based control architecture iB2C. RAS 58(1).
Quinlan, S. and Khatib, O. (1993). Elastic bands: connect-
ing path planning and control. ICRA.
Schmidt, D., Luksch, T., Wettach, J., and Berns, K. (2006).
Autonomous behavior-based exploration of office en-
vironments. ICINCO.
Surmann, H., N
¨
uchter, A., and Hertzberg, J. (2003). An
autonomous mobile robot with a 3D laser range finder
for 3D exploration and digitalization of indoor envi-
ronments. RAS 45(3-4).
Wettach, J. and Berns, K. (2010). Dynamic fron-
tier based exploration with a mobile indoor robot.
ISR/ROBOTIK.
Wettach, J. and Berns, K. (2012). Ground plan based explo-
ration with a mobile indoor robot. ROBOTIK.
Wettach, J. and Berns, K. (2014). Combining dynamic fron-
tier based and ground plan based exploration: a hybrid
approach. ISR/ROBOTIK.
Wurm, K. M., Stachniss, C., and Burgard, W. (2008). Coor-
dinated multi-robot exploration using a segmentation
of the environment. IROS.
Yamauchi, B. (1997). A frontier-based approach for autono-
mous exploration. CIRA.
Experimental Evaluation of Some Indoor Exploration Strategies
287
