
An Energy-aware Brokering Algorithm to Improve Sustainability in
Community Cloud
Maurizio Giacobbe
1
, Marco Scarpa
1
, Riccardo Di Pietro
2
and Antonio Puliafito
1
1
Department of Engineering, University of Messina, Contrada Di Dio, 98166 Messina, Italy
2
C.I.A.M., University of Messina, S. Pugliatti 1, 98100 Messina, Italy
Keywords:
Cloud Computing, Community Cloud, Energy-aware Brokering, Green Cloud, Low Carbon, Resource
Allocation, Sustainability, Virtualization.
Abstract:
Cloud computing is a paradigm for large scale distributed infrastructures, platforms or software services which
represents a hot topic in Information Technology (IT) recently in both industrial and academic areas. Its use
is motivated by the possibility to promote a new economy of scale in different contexts. Along with the
well-known public, private and hybrid Cloud models, the Community Cloud is an emerging concept based
on a deployment model in which a Cloud infrastructure allows a specific community of consumers to share
interests, goals and responsibilities. It can be owned and managed by the community, by a third party, or a
combination of them. In such scenario, new low-carbon strategies at Cloud sites are necessary to allow those
latter to reduce the consumption in presence of a massive exploitation of IT services. Therefore, balancing
performances with both sustainability and cost saving concepts is a challenge. In this paper, we present a low
carbon strategy designed to make the best choice in resources allocation, based on sustainability, availabil-
ity and costs. The proposed energy-aware Brokering Algorithm (eBA) allows to push down carbon dioxide
emissions through the Community Cloud ecosystem, by running instances at the most convenient sites.
1 INTRODUCTION
Nowadays, worldwide companies which make busi-
ness in the Information and Communication Tech-
nology (ICT) field are increasingly sensitive to the
environmental sustainability issue. Their products
and services are empowering customers, both peo-
ple and organizations, to satisfy their requests in sev-
eral contexts, where improving efficiency and reduc-
ing pollution are two essential goals. For example,
the 2015 Global 100 Most Sustainable Corporations
in the World index of the Corporate Knights Maga-
zine reports Accenture (Ireland) is the first in IT Ser-
vices (54th overall position). Meanwhile tha ranking
reports Nokia (Finland), Lenovo Group (China) and
EMC (United States) are the most sustainable compa-
nies in Technology, Hardware, Storage & Peripherals.
Community Cloud is an emerging topic in ICT. It
is a deployment model in which a Cloud infrastruc-
ture is built and provisioned in order to be used by
a specific community of consumers with shared con-
cerns, goals, and interests (Murugesan and Bojanova,
2016). It can be owned and managed by the commu-
nity itself, by a third party, or a combination of both.
The deployment environment can be provided by a
mesh of Cloud providers in order to satisfy the spe-
cific requirements and conditions of the community.
Cloud providers can be interconnected based on open
standards in order to provide a universal decentralized
Cloud computing environment.
Our study addresses medium and small size Cloud
providers towards solutions allowing them to com-
pete with large Cloud providers in a more sustain-
able service marketplace. We watch to a dynamic
scenario where Cloud providers share their IT re-
sources among their respective Community Cloud
sites (i.e., datacenters) in order to reduce costs and
energy-efficiency gap if compared with the top Cloud
computing service providers (e.g., Amazon, Google,
Rackspace, etc.). An automated negotiation pro-
cess facilitates the bilateral negotiation between the
Community Cloud broker and multiple providers to
achieve several objectives for the community mem-
bers. However, for these purposes, balancing the
above objectives with performances is a challenge. To
this end, an approach based on Cloud brokering can
simplify the procedures in making the best choice. A
brokerage scenario is exemplified in Fig. 1: an Au-
166
Giacobbe, M., Scarpa, M., Pietro, R. and Puliafito, A.
An Energy-aware Brokering Algorithm to Improve Sustainability in Community Cloud.
DOI: 10.5220/0006300201660173
In Proceedings of the 6th International Conference on Smart Cities and Green ICT Systems (SMARTGREENS 2017), pages 166-173
ISBN: 978-989-758-241-7
Copyright © 2017 by SCITEPRESS – Science and Technology Publications, Lda. All rights reserved
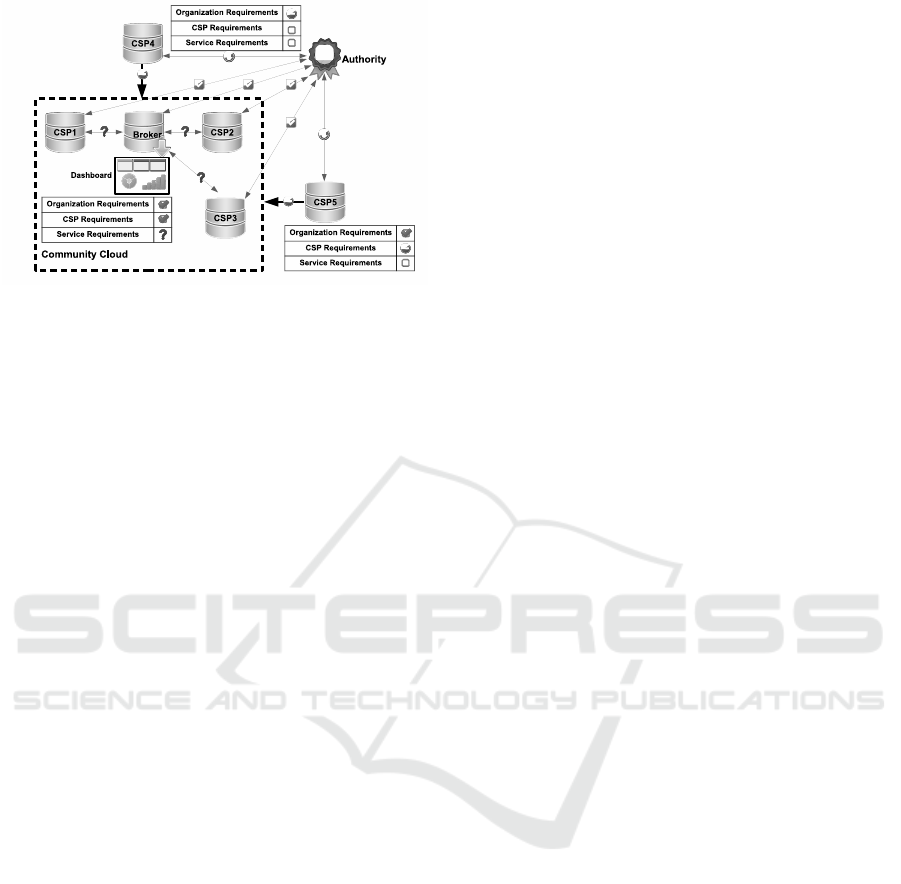
Figure 1: Brokerage in a Communtity Cloud environment.
thority in charge evaluates both the Organization and
the Cloud service provider (CSP) requirements (e.g.,
SLA) to determine if they are satisfactory to become
Community members. The same for a candidate bro-
ker which consequently is able to evaluate service re-
quirements and to rank the offers among the presented
by the Community members. For example, service re-
quirements can be based on the use of electricity at a
Cloud site. It can change in given moments of the day
and in given periods of the year, furthermore differing
for geographical area and for energy source. More-
over, a Cloud site can use a solar energy source and
the efficiency of its Photo-Voltaic system (PV) can
change in different moments of the day (i.e., morn-
ing, afternoon, evening, night) and in different peri-
ods of the year (i.e., spring, summer, autumn, win-
ter). A really sustainable approach, as that presented
in this paper, can help Cloud providers also in receiv-
ing funds to realize new green plants, thus to produce
clean energy and to receive Renewable Energy Cer-
tificates (RECs).
The reminder of the paper is organized as follows.
Section 2 discusses related work. Section 3 presents
the main sustainability metrics that have to be consid-
ered in our strategy. Section 4 presents our approach
to make the best choice in resource allocation. In Sec-
tion 5, we present a simulation environment for our
analytic evaluations considering real parameters, thus
proving the goodness of our approach. Section 6 con-
cludes the paper.
2 RELATED WORK
Currently, most of the energy-aware management
strategies are specifically focused on independent
Cloud providers, and less are beginning to look
at Community Cloud. Scientific literature presents
several contributions on “green” Cloud, and intra-
Datacenters resource scheduling in order to reduce
energy consumption, but less attention has been de-
voted to “sustainable” community, cooperative or
federated Clouds. We, instead, present a decision-
making approach which is mainly focused on the al-
location of instances where they can run in a more
sustainable way. The Community Cloud model helps
its implementation.
In (Kessaci et al., 2013) the authors present a
multi-objective genetic algorithm, named MO-GA, to
optimize energy consumption, carbon dioxide emis-
sions and generated profit of a geographically dis-
tributed Cloud computing infrastructure. Differently
from the MO-GA approach, we focus on possible ad-
vantages shared among a community of CSPs.
In (CHANDRASEKAR, 2014), the authors
present a review of literature on Cloud Brokerage Ser-
vices, but Community Cloud is not a considered.
In (Hamze et al., 2016) the authors present a
framework which addresses resource allocation ac-
cording to an end-to-end SLA. This is established
between a Cloud service user and several CSPs in
a Cloud networking environment. Compared to that
study, our work mainly looks at sustainability tak-
ing into account significant parameters by type of ser-
vice/application.
A survey of the major contributions dealing with
energy sustainability and cost-saving strategies aimed
at Cloud computing and Federation is presented in
(Giacobbe et al., 2015). The survey helps researchers
to identify the future trends of energy management in
Cloud Federation.
In (Volk et al., 2013) the authors present two
complementary energy-efficiency optimization ap-
proaches, each one of them covered in the scope of the
two European CoolEmAll and Eco2Clouds projects.
However, the brokerage role is not a considered.
In (Usha et al., 2012), the authors propose a work
based on a multi-criteria optimization technique for
better selection of a service provider, by using a
Pareto-based approach to decide the Cloud service
provider which satisfies the Quality of Service (QoS)
requirements for the user. However, that work does
not cover the dynamic composition of services based
on the migration of data.
3 SUSTAINABILITY METRICS
In order to design the proposed algorithms, we need
to preliminary consider several sustainability met-
rics, that are generally computed based on a real-
time monitoring of the electrical loads consumptions
at each Data Center (DC).
An Energy-aware Brokering Algorithm to Improve Sustainability in Community Cloud
167

The Power Usage Effectiveness (PUE) is a sus-
tainability metric recommended by the Green Grid
consortium to characterize the DC infrastructure ef-
ficiency. PUE is generally defined as follows:
PU E =
P
DC
P
IT
(1)
PUE indicates how much the internal power con-
sumption P
DC
of a DC exceeds the Information Tech-
nology power consumption P
IT
at the same DC,
mainly due to electrical equipments and cooling sys-
tems. It is one of the four sub-metrics useful to com-
pute the Data center Performance Per Energy.
The Data center Performance Per Energy
(DPPE) is a sustainability metric introduced by the
Japan’s Green IT Promotion Council in order to im-
prove on the PUE. DPPE is defined by the following
Formula (2):
DPPE = IT EU ∗ IT EE ∗ 1/PUE ∗ 1/(1 − GEC)
(2)
and it is essentially based on four sub-metrics:
• the Information Technology Equipment Utiliza-
tion (ITEU);
• the Information Technology Equipment Effi-
ciency (ITEE);
• the Power Usage Effectiveness metric (PUE);
• the Green Energy Coefficient (GEC).
The DPPE is defined in such a way that a greater
value in DPPE indicates a greater energy efficiency
(GPC, 2012).
In the following, we will assume that each Cloud
service provider dynamically computes the DPPE at
each site measuring in real time the relative sub-
metrics, without exposing functionalities deemed to
sensitive or risky for its own business. We denote its
value for n-th site at time t with DPPE
n
(t).
The Carbon Dioxide Intensity Of Electricity
(CDIE) is a measure of the quantity of carbon diox-
ide emitted by an IT infrastructure with respect to
the used energy, and it is measured in kgCO
2
/kW h.
It depends on the region where the Cloud site is lo-
cated and it is based on the government’s published
data for that region of operation for that year. In par-
ticular, we refer to the Intergovernmental Panel on
Climate Change (IPCC) database. IPCC is the lead-
ing international body for the assessment of climate
change (IPR, 2014). Since CDIE changes year to
year, it is a time dependent quantity thus we denote
the admitted quantity into the generic cloud site n at
time t with CDIE
n
(t).
Our strategy involves this factor taking into ac-
count the impact of operational carbon usage.
Based on the definitions above, we introduce the
sustainability impact factor of site n at time t as the
ratio of the above-mentioned CDIE and DPPE met-
rics:
k
n
(t) =
CDIE
n
(t)
DPPE
n
(t)
(3)
It is expressed in KgCO2/kWh. If it is multiplied for
the energy consumption (kWh) resulting from run-
ning a service at the related n-th site, it represents
the “weight” in terms of carbon dioxide emission
(kgCO2), i.e., the workload footprint, which is corre-
lated with that energy consumption. The higher it is,
the greater the pollution due to run that service. We
remark that the values of CDIE are published yearly
and that the DPPE for a given site changes only when
structural modifications are done. Due to this reasons,
both of them could be considered constant in time de-
pending on the time period analyzed. In such case the
value of sustainability impact factor is written as:
k
i
=
CDIE
i
DPPE
i
(4)
assuming it constant over the time.
4 ENERGY-AWARE RESOURCE
ALLOCATION APPROACH
In this Section, we introduce a new approach to make
the best choice in resource allocation to push down
environmental pollution. We mainly refer to reduc-
ing carbon dioxide emissions through the Community
Cloud ecosystem, running a certain instance workload
at the most convenient DCs, thus contemporary taking
into account sustainability, availability and monetary
cost criteria.
More specifically, we start from considering re-
source allocation in terms of instance i at a node n,
and the related workload w
n,i
. In this context, an in-
stance is a temporary virtual server that needs to be
allocated in order to run services. The instance is dis-
tinguished from classical static virtual server due to
its dynamism: an instance that is allocated on a spe-
cific node can be easily moved to other nodes thus to
be better managed according to real needs. Workload
is expressed in terms of power consumption (kW)
needed to run a particular instance.
4.1 Availability and Service Price
Criteria
Since we want to develop a method to quantify how
the workload submitted to a Community Cloud im-
pacts on its sustainability, we consider the availability
SMARTGREENS 2017 - 6th International Conference on Smart Cities and Green ICT Systems
168

of DCs to take into account operating periods of time
during which systems can produce pollution.
Availability is the degree at which a system, prod-
uct or component is operational and accessible when
required for use. The product quality model defined
in ISO/IEC 25010 comprises availability as a qual-
ity characteristic. Moreover it is an important Key
Performance Indicator (KPI) generally computed as
a function of the total service time, the Mean Time
Between Failure (MTBF), and the Mean Time to Re-
pair (MTTR); it is well known that the availability at
stable conditions is given by the following equations:
av = (MT BF/(MT BF +MT T R)) ∗ 100 (5)
when expressed as percentage quota. Physical in-
terpretation of availability is the percentage of time
during which a system correctly operates. We will
assume that during some not operational periods of
time a computational node does not produce any use-
ful work but it could waste power to perform other
kind of maintenance activities.
Service price is a quantifiable criterion that ad-
dresses customers and organizations in their business.
Generally, it is expressed in $/h (i.e., dollars-per-
hour) or $/GB (i.e., dollars-per-GigaByte). Starting
by identifying several profiles of service requests, for
example in terms of required running time ∆
r
of an
instance i at a node n, it is possible to determine the
total cost for that service as follows:
cost
n,i
=
Z
t
start
+∆
r
t
start
service price
n,i
(t) dt (6)
Usually providers offer instance placement services
with a fixed price in the maintenance time. Therefore,
eq. (6) becomes:
cost
n,i
= service price
n,i
· ∆
r
(7)
4.2 Analytic Aspects in a
Cloud-to-Cloud Comparison for an
Eco-Sustainable Community Cloud
Environment
In this work, we assume that an instance workload has
to be moved from a Cloud source node a to a Cloud
destination node b in the Community based on sus-
tainability and cost saving goals.
An instance uses electricity to run at any node,
and this power consumption generally changes from a
node to another due to different technological choices.
Moreover, each node can change the power consump-
tion distribution in time. As a consequence, the car-
bon footprint differs at each node. Therefore, we
mainly distinguish two different phases during which
an instance can be managed, i.e., the running at a
specific node and the migration from the source to a
possible destination.
1. Running Phase. To evaluate the carbon footprint
an execution instance i has at a generic Cloud
node n at time t for a δ long period, we introduce
the following function:
F
r
(n,i,t, δ) =
k
n
∗
Z
t+δ
t
(av
N
∗ w
n,i
(τ) + (1 − av
n
) ∗ p
n
)dτ (8)
where k
n
is the sustainability impact factor at
Cloud node n, w
n,i
(t) is the power consumption
to run the i-th instance workload at Cloud node
v. The availability av
n
at Cloud node n is used to
take into account the real usage of the infrastruc-
ture when the instance i runs at that node. The
‘idle’ condition at the same node, instead, is taken
into account through the p
n
basic power consump-
tion factor. Based on eq. (8), the carbon footprint
of a given load l when it runs on Cloud source
node a at time t
a
for ∆
r
time instants is:
co2
a,l
= F
r
(a,l,t
a
,∆
r
) (9)
Generally speaking, when two different Cloud
nodes a and b are considered, their footprints
over the same time interval are different (co2
a,l
6=
co2
b,l
) because both their sustainability impact
factor and availability are different; on the con-
trary, if the two Cloud nodes a and b are in the
same bladecenter (or datacenter) they are char-
acterized by similar sustainability impact factors
and availability (k
a
≈ k
b
and av
a
= av
b
), resulting
in the same footprint (co2
a,l
= co2
b,l
).
2. Migration phase. To characterize the carbon
footprint to move an instance i from a Cloud node
c
1
to a Cloud node c
2
within a time δ, we intro-
duce the following function:
F
m
(c
1
,c
2
,i,t, δ) =
k
c
1
∗
Z
t+δ
t
w
c
1
,i
(τ)dτ + k
c
2
∗
Z
t+δ
t
w
c
2
,i
(τ)dτ
(10)
F
m
() takes into account the fact that during the
migration phase two copies of the instances exist
in the source and in the destination node thus the
footprint is affected by the power consumption of
both of them.
The carbon footprint to move load l from a Cloud
node a to a Cloud node b within a time ∆
m
starting
at t
m
, is thus computed as:
co2
a→b,l
= F
m
(a,b,l,t
m
,∆
m
) (11)
An Energy-aware Brokering Algorithm to Improve Sustainability in Community Cloud
169
3. The Algorithm. The decision making energy-
aware Brokering Algorithm (eBA) is detailed
through the algorithms 1 and 2 using pseudo-code
where we used the symbol h instead ∆
r
to simplify
the notation.
In the proposed Community Cloud ecosystem, the
above formulas are used to characterize resources of
two providers through their footprints with respect the
instance i under examination, in order to determine
the best sustainability. Footprints of both source and
destination nodes are computed and they are exploited
to choose whether it is convenient to run the instance
i on the infrastructure of the original service provider,
the source, or at destination. The carbon footprint due
to the running and migration phases are:
co2
source,i
= co2
a,i
+ co2
a→b,i
(12)
co2
dest,i
= co2
a→b,i
+ co2
b,i
(13)
When ∆
m
∆
r
, eq. (12) and (13) simplify into the
following:
co2
source,i
∼
=
co2
a,i
(14)
co2
dest,i
∼
=
co2
b,i
(15)
Therefore, we can compare the co2
source,i
with all
the possible co2
dest,i
in order to determine what is the
best carbon footprint choice.
5 EXPERIMENTS
In order to evaluate the eBA algorithm behav-
ior, we set up simulated scenarios by using the
J2CBROKER tool (Giacobbe et al., 2016) developed
at the University of Messina. If compared with well-
known simulators (e.g., CloudSim) it differs because
its specificity in to simulate brokerage scenarios.
5.1 Datasets
We present a modeling of both services and Cloud
sites, thus to provide input data for the proposed
eBA Algorithm. Each offer is modeled by a json
document which includes two main collections (TA-
BLE 1): the first one refers to a Service Dataset, to
specify workload and performance parameters, and
the second one to a Sustainability Dataset to calcu-
late the carbon f oot print (Algorithm 2, line 25), the
cost (Algorithm 2, line 26) and the opt evaluation in-
dex (Algorithm 2, line 31).
Algorithm 1 : The energy-aware Brokering Algorithm
(eBA).
1: nosql db = newNoSQL()
2: use nosql db
3: de f ine nosql db.REQs collection
4: de f ine nosql db.OFFs collection
5: de f ine nosql db.reqsTags
6: de f ine nosql db.resulting
7: de f ine reqsTags = nosql db.REQs collection.tags( )
8: de f ine hMapReq =
nosql db.REQs collection.gather(reqsTags.h)
9: de f ine hMapO f f =
nosql db.OFFs collection.gather(reqsTags.h)
10: while true do
11: de f ine reqs status = hMapReq.trigger( )
12: de f ine o f f s status = hMapO f f .trigger( )
13: if (reqs status is true) then
14: hMapReq = hMapReq.update( )
15: else
16: if (offs status is true) then
17: hMapO f f = hMapO f f .update( )
18: end if
19: end if
20: nosql db.resulting = hMapO f f .calc()
21: nosql db.resulting. f ind( )
22: nosql db.resulting.sort(co2 f oot print,cost,opt,N)
23: end while
Table 1: Service and Sustainability Datasets.
Service Dataset
Parameters Values
Workload (watts) 200-300
Power basic (watts) 100
Running Time (hours) 10,24,360,750
Number of Instances in each
Offer
12,14,16,18,20
Number of Instances in each
Request
1,10,20,50
Availability (%) 99.90-99.99
Service Price ($/h) 0.007-0.112
Sustainability Dataset
Parameters Values
ITEU 0.3-0.6
ITEE 0.1-3.9
PUE 1.4-2.3
GEC 0.0-0.003
CDIE (kgCO2/kWh) (*)
(*) source:https://www.ipcc.ch
The Service Dataset is obtained from a survey on
several “top” providers of IT technologies (e.g., Dell),
Cloud services and solutions (e.g., Amazon Web Ser-
vices (AWS)).
The Sustainability Dataset results from the METI
project (MJP, 2012) on characteristics and energy ef-
ficiency of several monitored Asian DCs. The simu-
lator select a random value between the range set for
each metric and each offer is characterized by its sus-
tainability, cost and availability values.
SMARTGREENS 2017 - 6th International Conference on Smart Cities and Green ICT Systems
170

Algorithm 2: The calc() method of the energy-aware Bro-
kering Algorithm (eBA).
1: de f ine h num = hMapO f f .count(reqsTags.h)
2: de f ine worst c f [h num]
3: de f ine worst cost[h num]
4: for j = 1 to h num do
5: o f f num = hMapO f f .count(reqsTags.h. j)
6: de f ine co2 f oot print[h num][o f f num]
7: de f ine cost[h num][o f f num]
8: de f ine opt[h num][o f f num]
9: for i = 1 to o f f num do
10: de f ine av, price, iteu, itee, pue, gec, cdie
11: de f ine w, p
basic
, t0, h, d ppe, k, a, N
12: av = hMapO f f . j.i.availability
13: price = hMapO f f . j.i.price
14: iteu = hMapO f f . j.i.iteu
15: itee = hMapO f f . j.i.itee
16: pue = hMapO f f . j.i.pue
17: gec = hMapO f f . j.i.gec
18: cdie = hMapO f f . j.i.cdie
19: w = hMapO f f . j.i.workload
20: p
basic
= hMapO f f . j.i.p
basic
21: t0 = hMapO f f . j.i.tstart
22: h = hMapO f f . j.i.h
23: d ppe = d ppe f unc(iteu, itee, pue,gec)
24: k = k f unc(cdie,d ppe)
25: co2 f oot print[ j][i] =
integral(t0,h, w,k,av, p
basic
)
26: cost[ j][i] = cost f unc(price,h)
27: end for
28: worst c f [ j] = max(co2 f oot print, j)
29: worst cost[ j] = max(cost, j)
30: for i = 1 to o f f num do
31: opt[ j][i] = a ∗ (co2 f oot print
j,i
/worst c f
j
) +
(a − 1) ∗ (cost
j,i
/worst cost
j
)
32: hMapO f f . j.i.update(co2 f oot print,cost, opt)
33: end for
34: end for
5.2 Simulation Environment
In the J2CBROKER simulator, both the client
and server sides use their own mandatory
client json con f and server json con f configu-
ration files to dynamically set features and behavior
during the simulation steps. The first one contains
information about the server application and several
fields which are used for the dataset simulation
phase. The second one contains information about
the server-side elaboration phase. The Random Simu-
lation Mode (we use in our simulation at client-side)
allows the random creation of the datasets to send
at the server-side broker algorithm for computation.
The Guided Simulation Mode, instead, allows the
user to specify the list of the dataset files for the
server-side broker algorithm. The communication
between client and server is made through the HTTP
POST requests exchange. The output of the simu-
lation is a json file which contains the results of the
elaborations done by the server-side eBA Algorithm.
5.3 Experimental Results
This paragraph reports, in a graphical form, the re-
sults produced by the simulations, based on a number
of 1000 samples. Figures 2 and 3 show distinct re-
sults for the different running time h (as reported in
service dataset) and based on the established parame-
ters (i.e., weight a, confidence in terms of percentage
and number N of instances to allocate). In particular,
the weight a is a value in the [0,1] range and it is part
of the ‘opt’ Formula at the line 31 of the Algorithm 2.
It is used to assign a weight for each offer in terms
of sustainability and cost (the sum of the attributed
weight equals one).
Figure 2 shows four examples among the simu-
lated scenarios by using two typologies of graphs, i.e.,
kgCO2/DPPE vs h and cost vs h. They refer to four
different number N of instances in each request (see
Service Dataset in TABLE 1 and line 11 in the Al-
gorithm 2). Examples report a weight parameter a
equals 0.5 (that means to assign the same weight for
sustainability and cost) and a 95% in confidence in-
tervals for the selected kgCO2/DPPE (i.e. the carbon
dioxide emission compared with the DPPE expressed
by the Formula (2)) and cost indexes. The purpose
of these graphs is to give a clear indication on the
amount of carbon dioxide emission-per-DPPE and the
cost (i.e., money) varying the running time h at each
Cloud site. If compared with the others through the
y-axis reading, the fourth graph on the left shows that
the carbon dioxide emission-per-DPPE confidence in-
terval is more restricted. This means that the proposed
algorithm encourages the broker in to select the ‘best’
offers in the presence of a high number of instances
to allocate for each request. The same by reading the
related cost graph (on the right). Furthermore, even
if both carbon footprint and cost grow with N and h,
their relative kgCO2/DPPE and cost confidence in-
tervals are below the 67% in the most expensive of all
(N=50, h=750), that is a 23% less in wasteful among
the Community Clouds.
Figure 3 shows the confidence interval of the opt
index for one instance allocation. The values reported
in Figure 3 are the result of a post-processing phase,
by getting as input all the best opt values calculated
at each run step. If we consider, in fact, that for each
run in our simulation, the worst case results in an opt
index closer to one, the eBA Algorithm at Broker is
able to select sets of offers with an opt index lower
than 0.12, that is very low if compared with the worst
An Energy-aware Brokering Algorithm to Improve Sustainability in Community Cloud
171
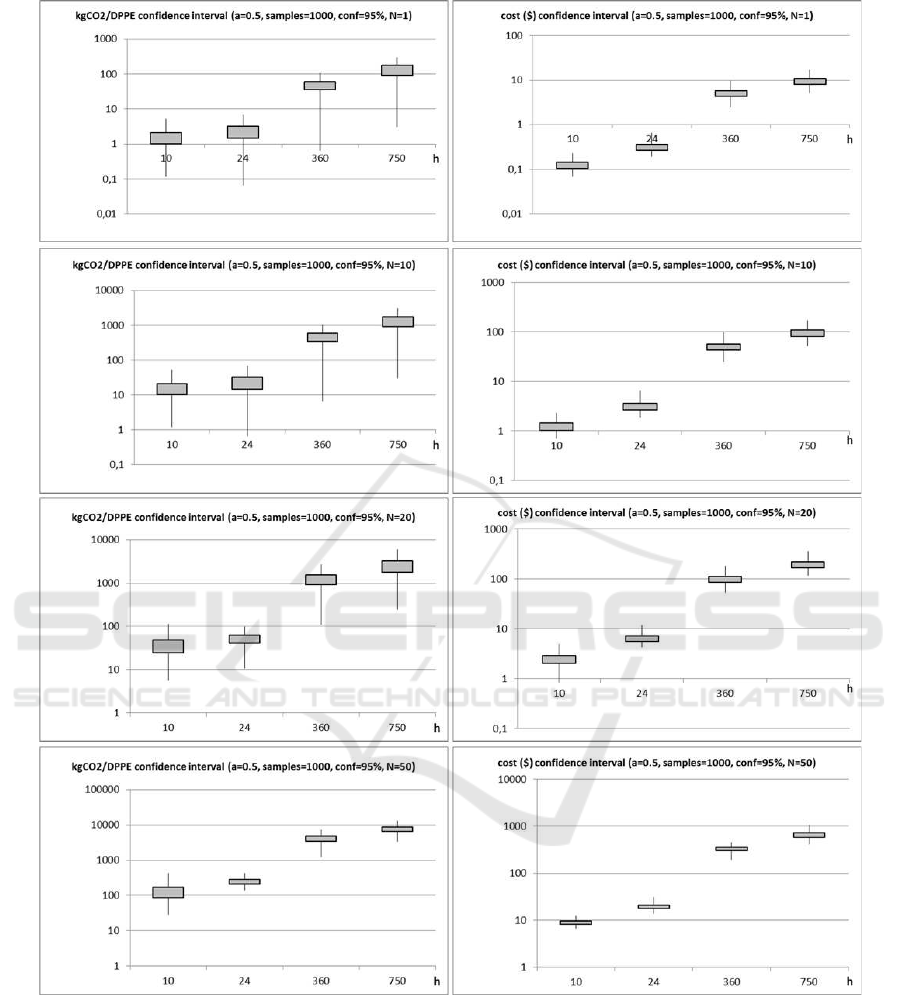
Figure 2: Confidence interval of kgCO2/DPPE and cost for different number of instances to allocate.
case. It means that the algorithm is able to select sets
of offers with an opt index closer to zero (the least
possible), taking into account not only sustainability
but also the service price criterion.
6 CONCLUSION AND FUTURE
WORK
In this paper, we presented and discussed an energy-
aware Brokering Algorithm to improve sustainabil-
ity in Community Cloud ecosystems taking care of
some metrics we consider particularly useful to im-
SMARTGREENS 2017 - 6th International Conference on Smart Cities and Green ICT Systems
172
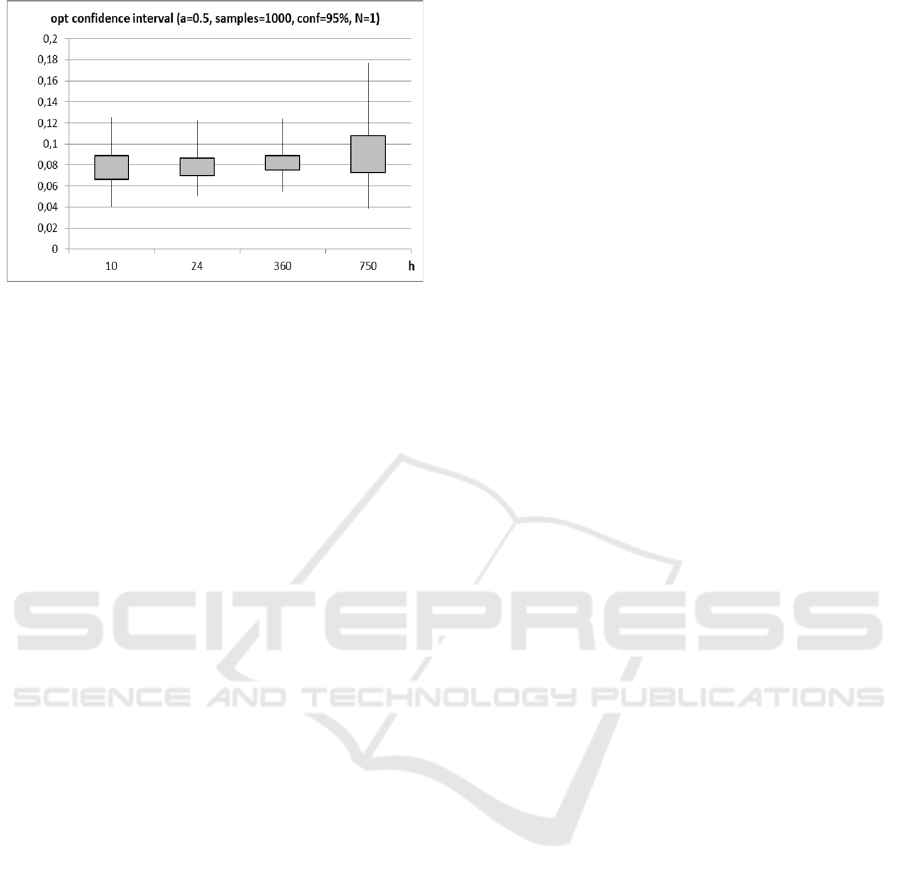
Figure 3: Confidence interval of the opt index for one in-
stance allocation.
prove sustainability. The proposed approach is able to
discover at a Cloud Broker the most convenient offers
delivered by the Community Cloud service providers
through a balance between sustainability and cost-
saving requirements. The proposed approach allows
to characterize offers on the basis of the geographic
area where the offered Cloud resources are available,
the energy-efficiency of the Cloud site, and service
parameters.
In future works, we plan to investigate a strategy
to smartly balance sustainability with several others
performance metrics. Thanks to an optimum balance
between sustainability, cost, and service parameters,
a Community Cloud ecosystem can reduce the gap
in competition with larger providers, towards an en-
couraging “green” resource sharing among Commu-
nity Clouds.
REFERENCES
(2012). The Ministry of Economy Trade and Industry
(METI) Japan Project - Enhancing the Energy Ef-
ficiency and Use of Green Energy in Data Centers.
http://home.jeita.or.jp/greenit-pc/sd/pdf/ds2.pdf.
(2012). New data center energy efficiency evaluation index.
dppe (datacenter performance per energy) measure-
ment guidelines. (ver. 205). Technical report, Green
IT Promotion Council.
(2014). The Carbon Dioxide Intensity Of Electricity, Inter-
governmental Panel on Climate Change (IPCC) Re-
port. http://www.ipcc.ch/.
CHANDRASEKAR, S. (2014). A review of literature on
cloud brokerage services. International Journal of
Computer Science and Business Informatics, 10(1).
Giacobbe, M., Celesti, A., Fazio, M., Villari, M., and Pu-
liafito, A. (2015). Towards energy management in
cloud federation: A survey in the perspective of fu-
ture sustainable and cost-saving strategies. Computer
Networks, 91:438 – 452.
Giacobbe, M., DiPietro, R., Puliafito, C., and Scarpa, M.
(2016). J2CBROKER: A service broker simulation
tool for cooperative clouds. In 10th EAI International
Conference on Performance Evaluation Methodolo-
gies and Tools (Valuetools 2016).
Hamze, M., Mbarek, N., and Togni, O. (2016). Broker
and federation based cloud networking architecture
for iaas and naas qos guarantee. In 2016 13th IEEE
Annual Consumer Communications Networking Con-
ference (CCNC), pages 705–710.
Kessaci, Y., Melab, N., and Talbi, E.-G. (2013). A
pareto-based metaheuristic for scheduling hpc appli-
cations on a geographically distributed cloud federa-
tion. Cluster Computing, 16(3):451–468.
Murugesan, S. and Bojanova, I. (2016). Community Clouds,
pages 744–. Wiley-IEEE Press.
Usha, M., Akilandeswari, J., and Fiaz, A. (2012). An effi-
cient qos framework for cloud brokerage services. In
International Symposium on Cloud and Services Com-
puting (ISCOS), pages 76–79.
Volk, E., Tenschert, A., Gienger, M., Oleksiak, A., Sis, L.,
and Salom, J. (2013). Improving energy efficiency
in data centers and federated cloud environments. In
CGC, pages 443–450.
An Energy-aware Brokering Algorithm to Improve Sustainability in Community Cloud
173
