
SAN D - A Dashboard for Analyzing
Employees’ Social Actions over Google Hangouts
Edvan Soares
1
, Marcos Eduardo
1
, Vanilson Bur´egio
1
, Emir Ugljanin
2
and Zakaria Maamar
3
1
Federal Rural University of Pernambuco, Recife-PE, Brazil
2
State University of Novi Pazar, Novi Pazar, Serbia
3
Zayed University, Dubai, U.A.E
Keywords:
Dashboard, Google Hangouts, Social Action and Violation.
Abstract:
This paper presents SAN D standing for S ocial ActioN Dashboard. It reports from different perspectives the
social actions that employees in an enterprise execute over social media with focus on Google Hangouts. This
execution might violate the enterprise’s use policies of social actions forcing decision makers take corrective
measures. SAN D is implemented using different technologies like Spring Boot and AngularJS.
1 INTRODUCTION
In previous works (A, 2015a; A, 2016), we designed
and implemented an approach for defining restrictions
over social actions (e.g., chat, post, and comment)
that enterprises’ employees perform over social me-
dia with emphasis on
Google Hangouts
. The ob-
jective of these restrictions is to ensure proper and
efficient use of social media, since many enterprises
are still unsure about their benefits and return-on-
investment (El-Sayed and Westrup, 2011; Kanaracus,
2015). Tracking the execution of social actions leads
to issuing warnings, when deemed necessary, to those
who violate restrictions like when to engage in a chat,
with whom to chat, and how a long a chat remains
active. In this paper, we pursue the same work by
providing a complete analysis of the social actions
that each employee executes along with the restric-
tions that she could have violated. In fact, we develop
a dashboard for decision makers who can drill into
the details collected during the execution of social ac-
tions. This drilling yields into insights such as the
most active employees on social media and the social
actions that each employee performs along with the
restrictions she has violated.
There is an ongoing debate about the role of social
media in the workplace. On the one hand, pros in-
clude reaching out to more customers and tapping into
social data like feedback on services. On the other
hand, cons include distracting employees and facili-
tating security breaches (Sherry, 2015). Approaches
that educate users on how to use social media effi-
ciently and/or suggest preventiveinstead of corrective
actions, are still a few. Circulating photos on the Web
and posting personal details show the severe damages
that these actions have on people’s lives (Roth, 2010).
Wouldn’t it be better to “control” the actions of cir-
culating and posting before performing them? To the
best of our knowledge, our work on restrictions is one
step towards making users aware of the pitfalls of so-
cial media so they can be held liable if recurrent vio-
lations occur, for example (A, 2015a).
In this paper, we present S AN D, standing for
Social ActioN Dashboard, that provides a summary
of employees’ historical data on chat sessions and vi-
olations of restrictions. The summary yields into use-
ful information for decision makers so they are aware
of who is doing what, when a violation took place,
and what response to a violation was taken. The rest
of this paper is organized as follows. Section 2 is an
overviewof our previous work on restrictions over so-
cial actions. Section 3 details S AN D in terms of ar-
chitecture, implementation technologies, and usage.
Section 4 concludes the paper along with some fu-
ture work.
2 BACKGROUND
This section discusses the context of our research,
which is social enterprise (aka enterprise 2.0). Then,
it presents an overview of our approach for defin-
ing and monitoring restrictions over social actions.
Extensive details on this approach are given in (A,
2015a). According to Global Industry Analysts,
Inc. “The global expenditure on Enterprise Web 2.0
214
Soares, E., Eduardo, M., Burégio, V., Ugljanin, E. and Maamar, Z.
SAN D - A Dashboard for Analyzing Employees’ Social Actions over Google Hangouts.
DOI: 10.5220/0006399302140219
In Proceedings of the 12th International Conference on Software Technologies (ICSOFT 2017), pages 214-219
ISBN: 978-989-758-262-2
Copyright © 2017 by SCITEPRESS – Science and Technology Publications, Lda. All rights reserved

is forecast to reach
$
5.7 billion by 2015, driven by
expanding broadband capabilities, decreasing prices,
improving performance of networks, and the devel-
opment of advanced, highly interactive Web 2.0 ap-
plications” (www.strategyr.com, 2016) and “... the
top 15 Web 2.0 vendors will spend
$
50 billion in
2015 on servers, networks, and other infrastruc-
ture, up from
$
38 billion in 2014 and
$
30 billion in
2013” (www.lightwaveonline.com, 2016).
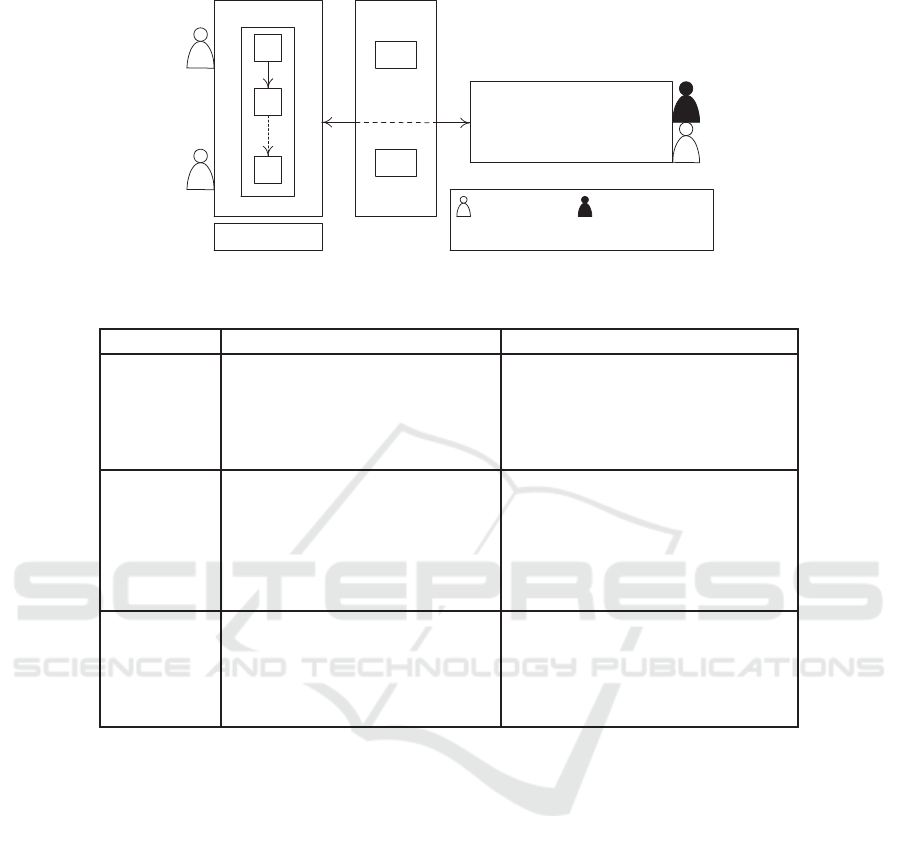
2.1 Context of Research
The architecture upon which a social enterprise op-
erates is depicted in Fig. 1 showing this enter-
prise’s business and social worlds connecting together
through a meet-in-the-middle platform. This platform
hosts Social Machines (SMs) that act as proxies over
Web 2.0 applications (A, 2015c; Bur´egio et al., 2013).
Fig. 1, also, shows interactions between stakeholders
and the business world and between stakeholders and
the social world.
The business world hosts the enterprise’s busi-
ness processes that consist of tasks connected to each
other through dependencies (e.g., prerequisite and co-
prerequisite). The execution of processes might lead
to interacting with the social world so that for in-
stance, some social actions are triggered while oth-
ers are re-executed or canceled. SMs allow these
interactions to take place. The social world hosts
Web 2.0 applications that the enterprise subscribes to.
Some Web 2.0 applications are internal to the enter-
prise (i.e., locally managed) while others are external
(e.g., Facebook) calling for specific agreements (kind
of service level agreement) between the enterprise and
Web 2.0 applications’ providers. Last but not least,
the meet-in-the-middle platform supports interactions
between the business and social worlds. In this plat-
form, SMs act as proxies over Web 2.0 applications
so that tasks in the business processes trigger social
actions and track their progress at run-time.
2.2 Google Hangouts in Brief
Google Hangouts (hangouts.google.com/), or
commonly called Hangouts
TM
, is a popular com-
munication platform that allows both individuals
and groups to chat as well as make video calls
with up to 25 users at a time. It combines several
Google’s previous services such as Google Talk,
Google+ Messenger, and Google+ Hangouts. Google
promotes Hangouts as the “future” telephony prod-
uct so it has been enhanced with several voice
capabilities of Google Voice. Hangouts comes
along with Google+ Hangouts API (develop-
ers.google.com/+/hangouts) that allows enterprises
and regular users to create collaborative applica-
tions on top of Google Hangouts. This provides a
means for building new features and customizing
Google Hangouts’s behavior. Applications built
for Hangouts are just like regular Web applica-
tions, developed using HTML and JavaScript, but
enriched with Hangouts real-time functionality of
Google+ Hangouts API.
2.3 Categories of Social Actions
Social actions aim at supporting users reach out to
(unknown) peers (e.g., request friendship) and/or en-
gage (unknown)peers in a collaborativeproduction of
content (e.g., co-author a technical report) (A, 2015a).
In Table 1, social actions fall into one of the following
categories: communication, sharing, and enrichment.
As per our previous work (A, 2015a), we use three
properties to define a social action:
•
Stakeholders
property refers to those who par-
ticipate in a social action in terms of who initiates
it and who reacts to it. This property is manda-
tory for the social actions (e.g., chat) that require
a ”continuous” presence of all stakeholders during
the execution of these actions.
•
Content
property refers to the object that is made
available for and/or by a social action’s stakehold-
ers. This could be text, image, audio, etc.
•
Tool
property refers to a Web 2.0 application
(e.g., Facebook and Google Talk) that makes a so-
cial action available to the stakeholder(s) for exe-
cution.
2.4 Restrictions Over Social Actions
To define restrictions, we used Object-Constraint
Language (OCL) (Object Management Group, 2012)
as per the following examples:
1. A participant’s identity should be known
(anonymity not allowed) to the employee at
start-up time.
context: Chat
inv R_1: self.stakeholders -->
forAll (s:Stakeholder | s.Name <> null)
where
self
.stakeholders contains the set of
Stakeholder instances representing the partici-
pants who take part in a chat session. | separates
the object from the condition.
2. No more than n characters per chat message
SAN D - A Dashboard for Analyzing Employees’ Social Actions over Google Hangouts
215
Google+ Hangouts, Facebook,
Twitter, etc.
Social
Machines
SM
i
Google+
Hangouts
SM
k
Facebook
BPM platforms
Business process
Business world
t
1
t
2
t
i
Interactions
Social world
Unknown stakeholderKnown stakeholder
BPM: business process management
t: task; SM: social machine
Legend
Meet-in-the-middle
platform
Figure 1: Architecture of the social enterprise (adapted from (A, 2015b)).
Table 1: Representative categories of social actions ((A, 2015a)).
Category Description Examples of social actions
Communication
Includes actions that establish back-and-forth
interactions between users, which should en-
gage them in joint operations
Chat with a user or group of users
Request/Accept a relationship connection with
others (e.g., friend, family, and co-worker)
Poke someone
Send direct messages to a user’s inbox
Sharing
Includes actions that establish one-way inter-
actions and allow to create and edit shared
content and to facilitate this content’s con-
sumption
Co-author a text on a Wiki system
Publish a post on a Blog Web site
Upload a video on a public repository
Share schedules, photos, music files, or any
other content with friends and other users
Subscribe to an RSS Feed
Enrichment
Includes actions that provide additional
[meta] data on shared content by providing
opinions and/or ranking
Comment a post
Rank/Rate a post, page, video, news, etc.
Tag users’ photos, videos, activities, etc.
Recommend a Web site, book, or other prod-
ucts/services to friends and other users
context: Chat
inv R_3: self.messages() -->
forAll(m:Message | m.Size < n)
where
messages()
is defined as follows:
context: Chat
def: messages(): Set(Message) =
self.content --> select(m:Content
| m --> oclIsKindOf(Message))
where
self.content
contains the set of
Content
instances representing messages exchanged dur-
ing a chat session.
3. The enterprise approved chat-tool should be used
context: Chat
inv R_5: self}.tool -->
oclIsKindOf(Internal)
3 SOCIAL ACTION DASHBOARD
SAN D is a descriptive-analytics system for examin-
ing historical data related to chat sessions, only. The
objectives are to understand how an enterprise’s em-
ployees violate restrictions and to support enterprises
in their decision-making processes. SAN D pro-
cesses raw data and presents them in a user-friendly
easily-interpretable format.
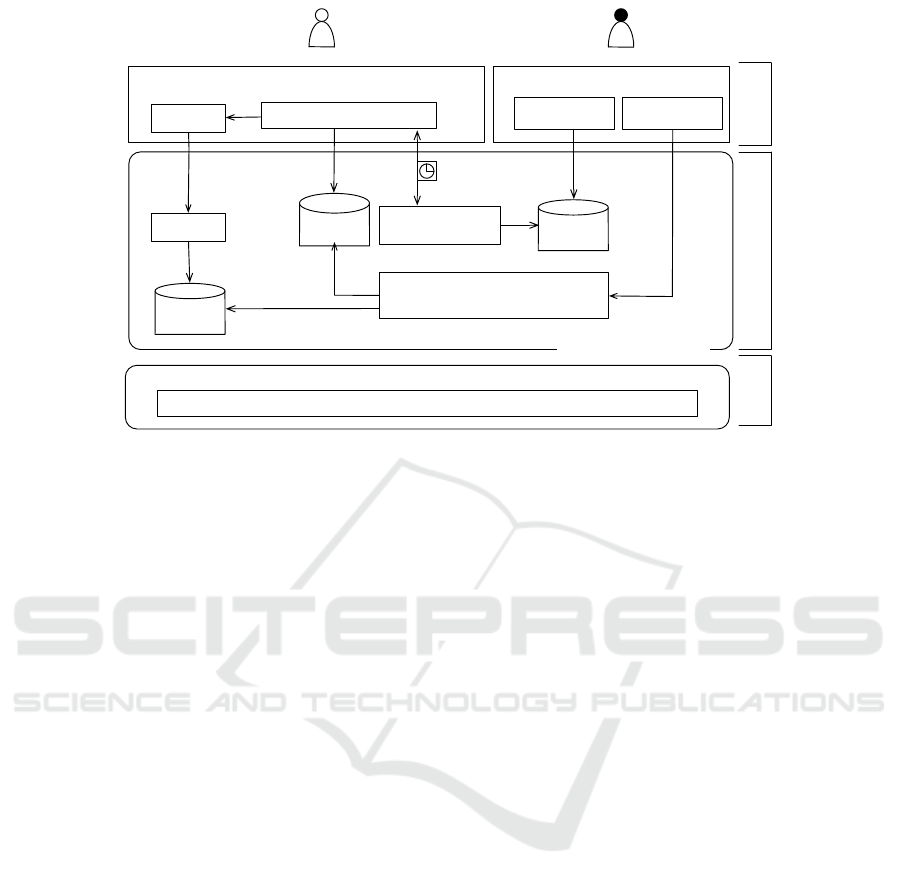
3.1 Architecture
Fig. 2 is S AN D’s architecture that extends the
restriction system’s architecture we developed ini-
tially (A, 2016). The additional components are vio-
lation detector, violation repository, analytics service,
and dashboard interface.
• The violation detector is deployed on the client
side and is in charge of identifying and report-
ICSOFT 2017 - 12th International Conference on Software Technologies
216
Send data
Chat app interface
Google+ Hangouts API (Web 2.0 application)
Customized chat app
Activity log
repository
Update
Web portal
Manager
Employee
Action monitor
Set
Synchronize
Restriction
repository
Parse
Restriction manager
Control social machine
Configuration
interface
Business
world
Meet-in-the-middle platform
Social
world
Dashboard
interface
Violation
repository
Analytics Service
Render
Update
Read
Read
Violation
manager
Violation
detector
Figure 2: SAN D’s architecture.
ing violations of restrictions that take place during
chat sessions. The violation detector blocks chat
sessions and sends data to the meet-in-the-middle
platform when violations occur.
• The violation manager is deployed on the meet-in-
the-middle platform and is responsible for receiv-
ing data on violations and storing these data in the
violations repository.
• The violation repository stores all violations re-
ceived by the violation manager. Examples of vi-
olations include employee using chat application
outside the allowed time-periods or employee en-
gaged in more active chat sessions than allowed.
• The analytics services provides APIs that give de-
cision makers the ability to obtain details on the
violations that took place and run summary re-
ports. These services permit to measure for in-
stance, time spent in chat sessions by employees
and total of violations per type and per employee
as well, and to track violationsunder different per-
spectives/views over time.
• The dashboard interface uses the APIs of the ana-
lytics services to provide a graphical user interface
that renders different charts and statistics on em-
ployees’ historical data on chat sessions and vio-
lations of restrictions.
3.2 Implementation and Usage
We discuss some implementation details of S AN D
along with the technologies used in this implementa-
tion. S AN D is divided into two separate parts: front-
end that renders data in a visualization layer, and
back-end that processes data and makes them avail-
able to the front-end. This strategy of implementa-
tion breaks-up the complexity of the system by uncou-
pling the dependencies between the presentation and
business layers and minimizing the impacts of further
changes on the system as a whole.
In the back-end, we use Spring
Boot (projects.spring.io/spring-boot) to implement
the Analytics Services, which provide REST ser-
vices in charge of processing and returning data in
JSON format. Spring Boot is a Java-based framework
that uses Configuration over Convention (CoC) as
a design paradigm to increase development produc-
tivity by discarding for instance, the use of different
XML-based configurations. SAN D’s Analytics
Services are connected to the violation and activity log
repositories, where data sent by the client-side chat
tool (A, 2016) is stored.
In the front-end part, two views can be high-
lighted: one to visualize the time spent by users us-
ing the chat tool and the other to visualize the amount
of users’ violations according to the previously estab-
lished restrictions. To visualize some metrics, such as
time spent, S AN D’s uses Keshif (www.keshif.me),
a JavaScript-based tool that allows to obtain insights
from data by providing a dynamic interface for data
exploration. The top chart in Fig. 3 sorts in a de-
scending way users according to the number of uses
of Google Hangouts. The middle chart in Fig. 3 shows
the number of conversations separated by intervals of
the time spent in minutes per conversation. It is possi-
ble to realize, for instance, that conversations with du-
SAN D - A Dashboard for Analyzing Employees’ Social Actions over Google Hangouts
217
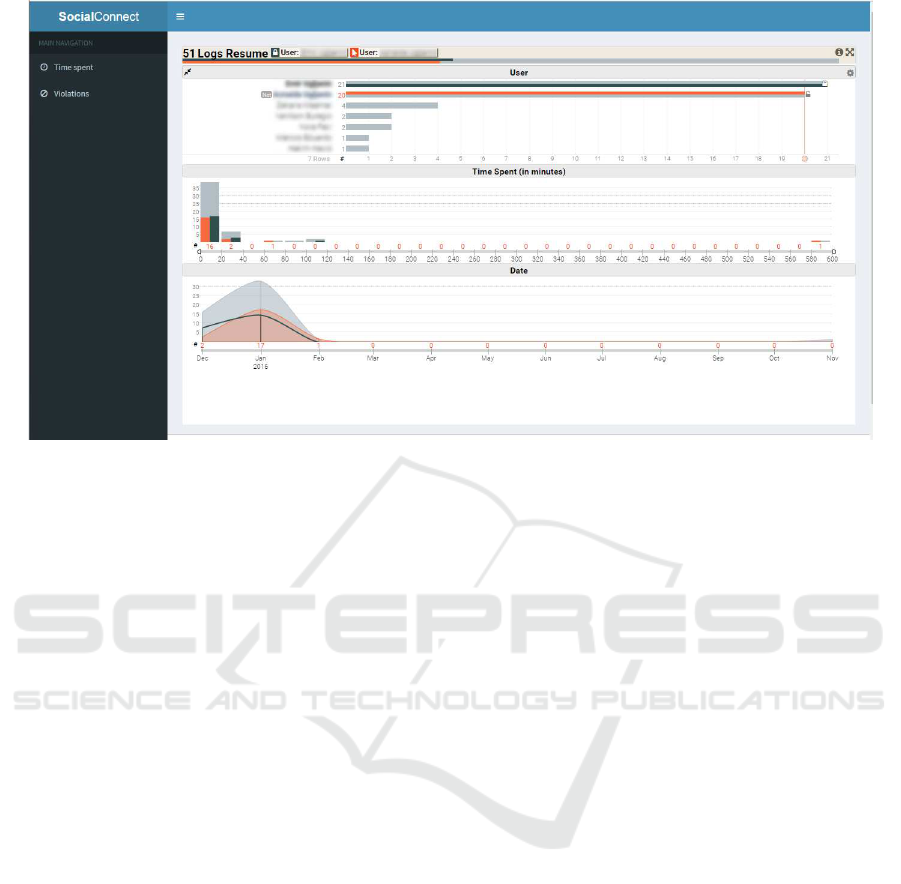
Figure 3: SAN D’s time-spent view.
ration between zero and twenty minutes have a larger
number of occurrences. Finally, the bottom chart in
Fig. 3 maps the number of uses of Google Hangouts
by date, where it is possible to see the periods that
have a higher and/or lower number of uses. The in-
formation in the three graphs is interconnected, so
it is possible to filter or make comparisons among
them. For example, to know the information of a
specific employee, the user simply selects the desired
employee on the chart that lists all employees and the
values of all other charts will be updated, according to
the selected employee. Comparisons are also a feature
that can be highlighted. For instance, to compare the
data of two employees, the user simply selects them
in the chart, and bars with specific colors for each se-
lected user will be automatically shown in the other
charts, making it possible to compare data (e.g., time
spent in chat conversations) between the selected em-
ployees.
In addition to Keshif, the front-end part
uses AngularJS (www.angularjs.org) and mor-
ris.js (www.morrisjs.github.io/morris.js/) to create
other charts like the one illustrated in Fig. 4. These
charts permit to visualize employees’ violations in
terms of total amount of violations committed by
all employees and amount of violations of a specific
user. Violations types include the following:
1. Date range during which users are allowed to use
Google Hangouts.
2. Inactive users to detect those who are not active
during a certain time period which is longer then
defined. This requires stopping the inactive ses-
sions and opening new ones.
3. Maximum number of characters to limit the num-
ber of characters per message.
4. Maximum active session to avoid many concur-
rent sessions.
5. Daily session limit to restrict the maximum num-
ber of sessions per day.
4 CONCLUSION
In this paper, we present the architecture and im-
plementation details of S AN D standing for S ocial
ActioN Dashboard. SAN D permits to analyze and
control employees’ actions over Google Hangout so
that it feeds decision makers with various details like
main types of violations that occurred in the work-
place, time of violation execution and violation ex-
ecutors. These details permit to develop best prac-
tices of using social media taking into account an en-
terprise’s concerns like privacy, confidentiality, and
competitiveness. These details also permit to improve
relationships with customers since social actions will
be “controlled” from a productivity performance. In
term of future work, we would like to examine other
forms of social media like Facebook Messenger and
generate patterns of violations so that preventivemea-
sures are put in place.
ICSOFT 2017 - 12th International Conference on Software Technologies
218
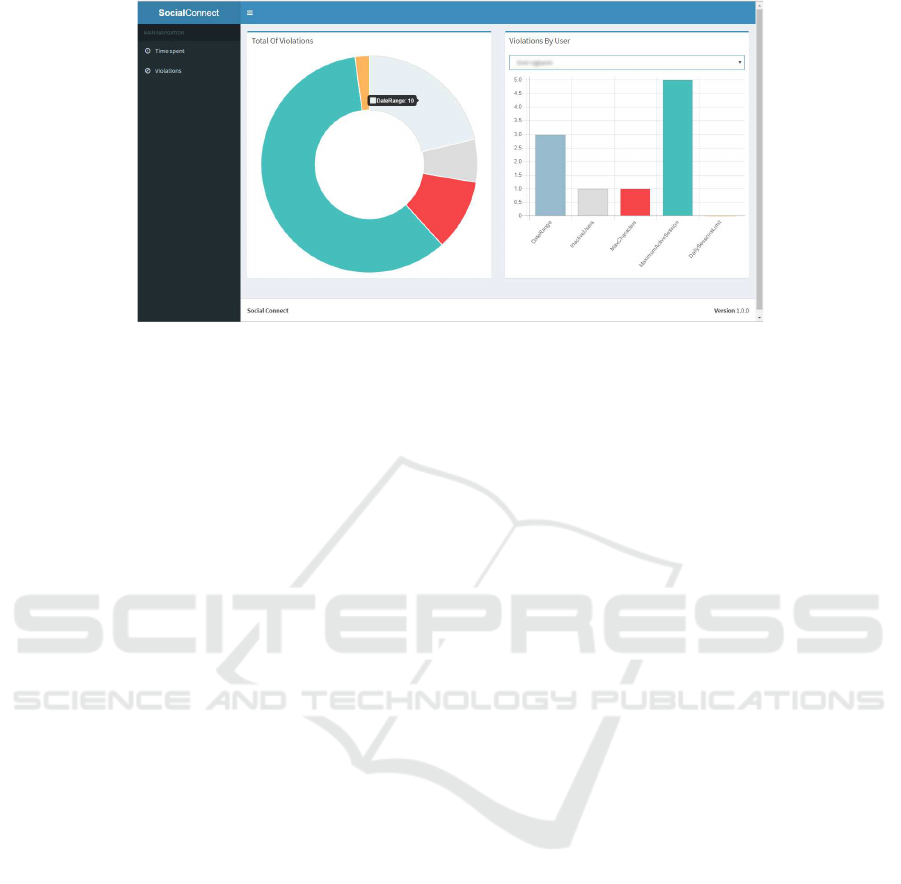
Figure 4: SAN D’s violations view.
REFERENCES
A, B. (2015a). No Tile - Blind Review. In Proceedings
of the 19th International IEEE Enterprise Distributed
Object Computing Conference (EDOC’2015), Ade-
laide, Australia.
A, B. (2015b). No Tile - Blind Review. In Proceedings of
the 24th IEEE International Conference on Enabling
Technologies: Infrastructure for Collaborative Enter-
prises (WETICE’2015), Larnaca, Cyprus.
A, B. (2016). No Tile - Blind Review. In Proceedings
of EDOC Workshops 2016 held in conjunction with
the 20th IEEE International Enterprise Distributed
Object Computing Conference (EDOC’2016), Vi-
enna, Austria.
A, B. (January-February 2015c). No Title - Blind Review.
IEEE Internet Computing, 19(1).
Bur´egio, V. A., Meira, S. L., Rosa, N. S., and Garcia, V. C.
(2013). Moving Towards “Relationship-aware” Ap-
plications and Services: A Social Machine-oriented
Approach. In Proceedings of the EDOC’2013 Work-
shops held in conjunction with the 17th IEEE Interna-
tional Enterprise Distributed Object Computing Con-
ference (EDOCW2013), Vancouver, BC, Canada.
El-Sayed, H. and Westrup, C. (2011). Adopting Enter-
prise Web 2.0 Collaborative Technologies in Business:
the Implications for Management Accountants. Re-
search Executive Summary Series, Manchester Busi-
ness School, 7(4).
Kanaracus, C. (2013 (visited February 2015)). Gartner:
Social Business Software Efforts Largely Unsuc-
cessful, For Now. http://www.infoworld.com/d/
applications/gartner-social-business-software-efforts-
largely-unsuccessful-now-211813.
Object Management Group, . (2012). Object Constraint
Language, Version 2.3.1.
Roth, P. (2010). Data Protection Meets Web 2.0: Two Ships
Passing in the Night. UNSW Law Journal, 33(2).
Sherry, D. (2010 (visited September 2015)). Web 2.0
Security Threats and How to Defend Against Them.
http://searchsecurity.techtarget.com/magazineContent
/Web-20-security-threats-and-how-to-defend-against-
them.
www.lightwaveonline.com (March 2015 (checked
out in May 2016)). Web 2.0 Compa-
nies Likely Shape Optical Network Market.
www.lightwaveonline.com/articles/2015/03/web-20-
companies-likely-shape-optical-network-market-
says-lightcounting.html.
www.strategyr.com (June 2010 (checked out in May 2016)).
Global Enterprise Web 2.0 to Reach US$5.7 Billion
by 2015. www.strategyr.com/PressMCP-6116.asp.
SAN D - A Dashboard for Analyzing Employees’ Social Actions over Google Hangouts
219
