
S3Bike: An Electrically Assisted Cycle Monitored in Heart Beat to
Help People with Heart Problem
Tests and Choice of the Best Heart Rate Sensor
Coline Jamme
1,3
, Kaavena Devi Persand
2
, Georges Soto-Romero
1,3
and Annabelle Vigué
1
1
Biomedical Engineering School, Faculty of Franche-Comté, Besançon, France
2
LAAS-CNRS, Université de Toulouse, CNRS, INSA, Toulouse France
3
LAAS-CNRS, Université de Toulouse, CNRS, Toulouse, France
Keywords: Heart Rate, Real Time Monitoring, Electrically Assisted Cycles, Physical Activity and Mobility.
Abstract: Many older people give up all physical activities because of their feeling of insecurity outdoors. In parallel,
the number of Electrically Assisted Cycles (EAC) in the cities increases significantly. Purpose: The aim of
the current study is to know if it’s possible to monitor their heart rate via an EAC to give a secure access to
locomotion of people under medical advice. Methods: It is two-fold: For all the experiments, our reference
is the Polar H7 chest strap. First, we compared different sensor’s positions during a 30 seconds’ effort test
indoors on a healthy subject. Then, we studied the repeatability and the reproducibility of the PulseSensor
placed on the cyclist’s earlobe during rest and test efforts on two samples of 12 health subjects. Results: The
PulseSensor placed on the earlobe is reliable indoors. Conclusion: The PulseSensor can be a good sensor to
monitor an EAC in heart rate. But we need to design a system to integrate all the electronic directly on the
cyclist and his helmet and to protect it from the outdoors interactions like the exposure to the sun, the
humidity or the cyclist’s perspiration.
1 INTRODUCTION
1.1 Heart Disease Concerns for the
Mobility
Cardiovascular and heart diseases are the secondary
causes of death in France just after tumours
(Ministère des Solidarités et de la Santé, 2016). This
remains true among frailty elderly. Even if the main
factors are linked to tobacco and drug-taking, the
lake of physical activity is also considered as an
aggravating factor. World Health Organization
recommends at least 150 minutes of moderate-
intensity physical activity throughout the week to
fight against sedentary lifestyle. For those with poor
mobility, they should perform physical activity to
enhance balance and prevent falls, 3 or more days
per week. Among the recommended sports, we
noticed swimming, cycling and walking. We
decided to focus on cycling to associate physical
activity with an ecological mobility solution. In
particular, Electrically Assisted Cycling (EAC) has
the advantage that they can assist the rider when the
effort becomes too much important.
Heart rate is one of the main physiological
indicator of the physical exertion, and monitoring
this parameter can be value to assess Electrically
Assisted Cycles. Of course, we could use the ways
existing today to measure heart rate. But our main
goal was to make the sensor the fuller acceptance we
can for elderly people. That is why, we decided to
integrate it in the cyclist’s helmet, supposing that the
helmet should be always worn.
1.2 Experimental Setups
The reference of all the next data is the reliable
sensor connected to the Polar H7 chest strap device
(International journal of sport physiology and
Performance, 2017). For a starting base, we tested an
Arduino compatible heart rate sensor and performed
preliminary validity study on healthy volunteer’s
subjects. First, we selected the better place to put the
sensor thank to our preliminary study. Then we
proved the sensor’s validity during rest and test
Jamme C., Persand K., Soto-Romero G. and ViguÃl’ A.
S3Bike: An Electrically Assisted Cycle Monitored in Heart Beat to Help People with Heart Problem - Tests and Choice of the Best Heart Rate Sensor.
DOI: 10.5220/0006503601070110
In Proceedings of the 5th International Congress on Sport Sciences Research and Technology Support (icSPORTS 2017), pages 107-110
ISBN: 978-989-758-269-1
Copyright
c
2017 by SCITEPRESS – Science and Technology Publications, Lda. All rights reserved
efforts indoors. Finally, the last experiment showed
us the impact of outdoor elements, and so, let us
other research fields to protect the sensor.
1.3 LED Pulse Sensor Functioning
The sensor that we tested is a non-invasive heart rate
monitoring sensor. The signal that is emitted is an
analogue fluctuation in voltage with a periodic wave
shape from a green LED. The pulse sensor amped
responds to relative changes in light intensity. This
latter is proportionally transformed into a certain
value. So, the light reflected back to the sensors
characterizes the pulse. When the system finds the
moment when the signal is high, it measures the
time between all the pulses and sends the Inter Beat
Interval. Finally, the processor totals and posts the
heart rate in beats per minute.
2 PRELIMANARY STUDY: BEST
SENSOR POSITION
2.1 Methodology
We used a sample of one healthy volunteer subject
to make a first hypothesis on the best sensor
position. The reference of our data is still the reliable
sensor connected to the Polar H7 chest strap devices.
We connected a PulseSensor on an Arduino Uno.
With an USB port and a cable, we could see the
50Hz direct data on our computer. A specific
program in Python is needed to log the data in a file.
The Polar captor registered one data point per
second and we used it to compare the two signals
when the test was over. Our signal had to be reliable
for the high and low heart rate, so we designed an
effort test which would show these extremums.
After having connected the two sensors on the body
of the cyclist, we started programs and devices.
During the 30 first seconds, the subject didn’t move
on the indoor cycling: It’s the rest time. When this
time was over, the subject began his exercise and
pedalled as fast as possible with a high-power yield
for 30 more seconds. Finally, the cyclist stopped his
efforts and return to a rest state for 30 seconds. Also,
the test duration was 90 seconds. The event which
allowed us to have time aligned between the two
sensors was the sudden heart rate increase after the
30 seconds of rest. So, it was a manual calibration.
We made this experiment on three different parts of
the body. First, we fixed the sensor on the forehead
temple behind the helmet. Then we tested the sensor
on the index finger. Finally, we clipped the sensor
on the cyclist’s earlobe.
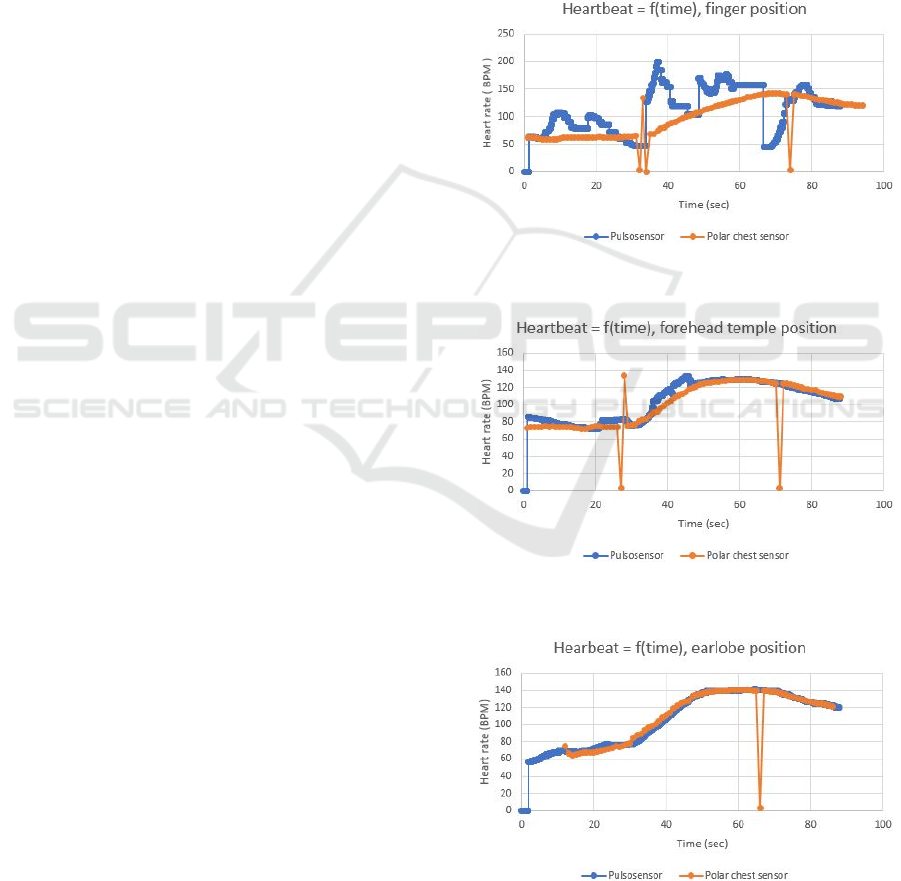
2.2 Results
We compared the results obtained by the two kinds
of sensors on a graph. The following graphs
represents the Heart rate in Beats per minute over
the time in seconds. There are 3 graphs for the 3
positions tested. The blue function is the heart rate
obtained with the pulse sensor connected to Arduino
and the orange with the Polar chest strap.
Figure 1: Graph of heart rate function over time for the
finger sensor’s position.
Figure 2: Graph of heart rate function over time for the
forehead temple sensor's position.
Figure 3: Graph of heart rate function over time for the
earlobe sensor's position.

We decided to accept the pulse sensor’s values
with a 2% margin of error in comparison to the Polar
thoracic chest strap. On the 3 graphs, the orange
curve follows a logical curve.
2.2.1 Finger Position
We can easily say that the finger is not the best place
to put our pulse sensor. Indeed, they are a lot of false
values in the blue graph and there is no trend. There
are only 17 values in the margin of error by 88, in
other words, the blue curve has 18.1% of correct
measurements.
2.2.2 Forehead Temple Position
When we placed the pulse sensor on the cyclist’s
temple, the blue curve was more reliable but not
perfect. There were still some false values, and the
trend when cyclist was at rest is imprecise. If we
consider the entire function, 67% of values are
within the margin of error.
2.2.3 Earlobe Position
The pulse sensor is in the optimal position when it is
placed on the cyclist’s earlobe. As a matter of fact,
when we analysed the values, there are 76 measures
by 88 which are included in the margin of error. So,
it represents more than 80% of the entire function.
We didn’t obtain the precision that we were looking
for but there are some ways to do this.
2.3 Conclusion
Regarding the results, we chose to place the sensor
on the earlobe for the next experiment. Indeed, it’s
the best location to have the same results as our
reference, the Polar thoracic chest strap. To perform
this sensor and make its values under our margin of
error, we will have to imagine a simple procedure of
preliminary sensor calibration. We could also filter
illogical values with a filtering step. Moreover, this
position is an advantage for our future project
because we are going to make our system on-board
and place the Arduino microprocessor on the cycling
helmet, not far from the earlobe.
3 EXPERIMENT:
REPRODUCIBILITY AND
REPEATABILITY
The aim of this experiment was to prove that the
measurements obtained with the pulse sensor on the
earlobe are reproducible and repeatable with a 10%
confident limit.
3.1 Materials and Methods
To show that, we designed two experiments with
two different samples. The test took place indoors.
For both, the sensor tested was the pulse sensor
connected to an Arduino Microprocessor and the
reference still was the Polar sensor on the thoracic
chest strap. Then, the test was the same as the first
experiment. We started the programs and devices
and at the same time, the healthy subject stayed
calm, without pedalling for 30 seconds. Then he
began the test effort and pedalled as fast as possible
for 30 seconds. Finally, he stopped the test and as
during the first 30 seconds, didn’t move on the bike.
We disconnected the sensors after 30 seconds. So,
the experiment for one subject has a duration of 90
seconds. To prove that the results are reproducible,
we repeated the previous experiment with a sample
of 11 healthy subjects, between 20 and 25 years old
(N=11). We compared the error rate between the
pulse sensor’s measurements and those from the
Polar thoracic chest strap. The repeatability was
tested with a sample of 3 healthy subjects (N=3).
Each of them repeated the experiment 5 times in the
same physical conditions. We also compared the
approval limit got with the Bland-Altman method
and our confident limit of 90%.
3.2 Results
3.2.1 Reproducibility
Thanks to the Bland-Altman method, we could say
that our measures were similar with a confident
interval of 90% and even 95%. Indeed, we got the
correlation plot and the Bland-Altman plot’s figures
below.
Figure 4 : Pearson's correlation plot for the reproducibility
test.

Figure 5: Bland-Altman plot to compare PulseSensor to
the Polar chest strap for the reproducibility test.
We measured approval limits and we got an
approval interval of [-17.3; +17.6]. Yet, when we
analyzed our results, there are only 3.96% of
measures which are out of the approval interval. So,
the confident interval is included in the approval
interval. We can conclude that the measures got with
the PulseSensor are reproducible.
3.2.2 Repeatability
The test of repeatability showed that, in our
conditions, it was difficult to reproduce the same test
5 times. Indeed, we had some sensor’s position gap
between different experiment on the same subject.
Despite of this, the results were in the 90% confident
interval. We should be able to reduce our confident
limit with a preliminary calibration of the sensor’s
placement. Our results for this test are listed in the
table below.
Tableau 1: Bland-Altman results for repeatability test of
PulseSensor.
3.3 Discussion
Thanks to this study, we can determine the
advantages and the drawbacks of the pulse sensor
for our specific use. First, the earlobe is a good and
easy position for elderly people to place the sensor
whatever their clothes or their flexibility. Then, its
integration in the compulsory helmet make it
unforgettable to have. We also don’t need to design
an adapted hanging system for each cyclist because
the exact position of the sensor on the earlobe
doesn’t impact the results. But our experiments
present some limits, and should be considered as a
preliminary study. First, we used a sample of only
one subject to determine the better place where
putting the PulseSensor. Then, it could have
measurement’s errors due to a wrong contact
between the sensor and the earlobe. So, we need to
design a mechanical fix system and make a
preliminary calibration of its placement to reproduce
the test in the same conditions. Moreover, we made
all tests indoors even though in the future, it will be
a system for cyclists outdoors. So, our results are
significant for an indoor use, but first outdoors test
shown that environmental variables (humidity,
cyclist’s vibrations, light…) have a significant effect
on measurement accuracy. That’s why our next
work will be to design a better system to protect our
sensor from the extern light ray and to fix it on the
user’s earlobe.
4 CONCLUSIONS
The PulseSensor is a reliable sensor when it’s placed
on the earlobe and tested indoors. After designing
systems to make it on-board, we will be able to test
it in real conditions: On a biking trip. Then, the final
step will be to monitor an EAC with the
PulseSensor.
REFERENCES
Ministère des Solidarités et de la Santé, 2016. The
publishing company. Maladies cardiovasculaires.
World Health Organization, 2017. The publishing company.
International journal of sport physiology and perfor-
mance, 2017. The publishing company. Comparison of
Heart Rate Variability Recording With Smart
Photoplethysmographic, Polar H7 Chest Strap and
Electrocardiogram Methods.
2017. Pulsesensor, The publishing company. Pulse Sensor
Amped.
