Market Share Research Using Conjoint Analysis on Digital Cameras
Haodong Liu
Scecina Memorial High School, 46219 Indianapolis, Indiana, U.S.A.
ddhaodong@gmail.com
Keywords: Market, Conjoint, Share.
Abstract: This research conducts conjoint analysis market research study on a branded digital camera using programing
R. The aim is to predict market share (strictly share of preference as the model doesn't take into account
distribution or promotional effects). In conjoint analysis, customers are shown a variety of possible products
(or services) and asked to say which they prefer. By analyzing the preferences against the specification of the
products shown statistically, the underlying preferences can be worked out, so that preference for products
that were not tested can be evaluated (see conjoint design) to produce a conjoint analysis model to explore
different sets of preferences across the market as a whole. Using these preference values (utilities or part-
worths) from the conjoint research, a market model on customers’ preferences can be created based on what
drives customers' decisions. This allows businesses to model and test different product and service options to
evaluate likely market preferences and potential share, revenue and profit, all based on what customers really
value. In this project, a share of preference model is developed to improve the offering to customers and
estimate their effect on share to find out which options give the best return on investment.
1 INTRODUCTION
This research conducts conjoint analysis market
research study on a branded digital camera using
programing R. The aim is to predict market share
(strictly share of preference as the model doesn't take
into account distribution or promotional effects). In
conjoint analysis, customers are shown a variety of
possible products (or services) and asked to say which
they prefer. By analyzing the preferences against the
specification of the products shown statistically, the
underlying preferences can be worked out, so that
preference for products that were not tested can be
evaluated (see conjoint design) to produce a conjoint
analysis model to explore different sets of preferences
across the market as a whole. Using these preference
values (utilities or part-worths) from the conjoint
research, a market model on customers’ preferences
can be created based on what drives customers'
decisions. This allows businesses to model and test
different product and service options to evaluate
likely market preferences and potential share, revenue
and profit, all based on what customers really value.
In this project, a share of preference model is
developed to improve the offering to customers and
estimate their effect on share to find out which
options give the best return on investment.
2 CONJOINT DESIGN
A product or service area is described in terms of a
number of attributes. Based on the knowledge the
product category, product features and product
attributes, one design can be deployed by working
with the product manager in order to know what
parameters should be used. Attributes that affect
customers’ preference most significantly are price,
zoom, image quality, LCD screen size, and battery
life, which are all put into the model. This digital
camera study can be applied to any consumer product
because of the process would be exactly the same.
A digital camera may have attributes of zoom,
screen size, brand, price and so on. Each attribute can
then be broken down into a number of levels. For
instance, levels for zoom may be 4x optical, or 7x
optical. Using experimental design the attributes have
been used to develop 16 different types of camera (the
choice objects). For the sake of simplicity, the
attribute with a larger magnitude is denoted as +1
while the smaller one is -1. (See Appendix 1).
However, it is hard to determine which feature has
the greatest impact on customers’ preferences, and
what will the market share of a product with certain
features be. To answer this research question, the
following survey is conducted.
229
Since the analysis comes from the company’s
point of view, some combination does not make sense
for a company and therefore can be eliminated. (For
example, it is impossible for a company to sell goods
that have the best attribute with a lower price. This
means that the combination of -1,1,1,1,1 is impossible
and therefore it is not under the concern).
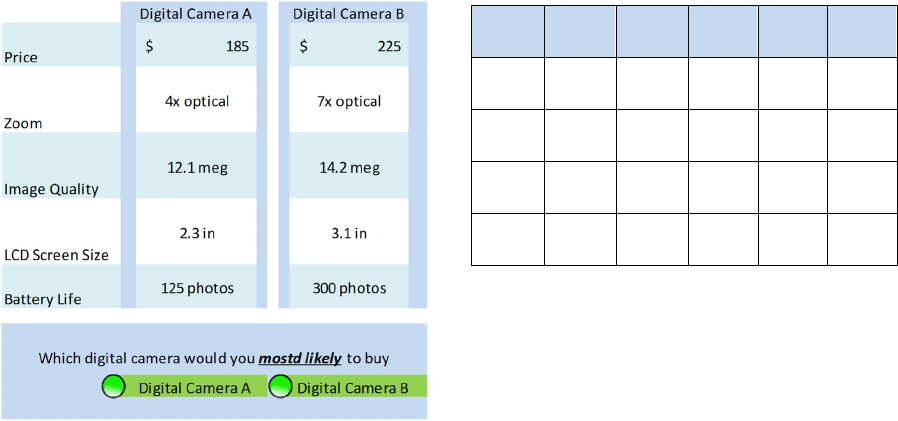
Participant would be shown a set of products,
prototypes, mock-ups, or pictures created from a
combination of levels from all or some of the
constituent attributes and asked to choose from, rank
or rate the products. Each example is similar enough
that consumers will see them as close substitutes, but
a unique combination of product features is made up
for a clear preference. The cameras were then
organized into 120 groups for customers to choose
from. (16*15/2) each pair of camera composes a
question in the survey looks like the table below.
Which camera a consumer would buy at the end
of day? What would the survey look like? To answer
above question, a comparison of a pair of cameras is
conducted to 200 responders like above.
For this model we had to simplify so that it fits on
the page. The data are made up and do not reflect any
real life situation.
3 DATA COLLECTION
Data for conjoint analysis are most commonly
gathered through a market research survey, although
conjoint analysis can also be applied to a carefully
designed configurator or data from an appropriately
design test market experiment. Market research rules
of thumb apply with regard to statistical sample size
and accuracy when designing conjoint analysis
interviews. The length of the research questionnaire
depends on the number of attributes to be assessed
and the method of conjoint analysis in use.
A typical Adaptive Conjoint questionnaire with
20-25 attributes may take more than 30 minutes to
complete. Choice based conjoint, by using a smaller
profile set distributed across the sample as a whole
may be completed in less than 15 minutes. Choice
exercises may be displayed as a store front type layout
or in some other simulated shopping environment.
200 people completed the survey, each made 120
choices. Then the total number of choices is 24,000.
An Excel spreadsheet is presented below with the
choice frequencies for each camera and each person.
Here is a peak of choices. An ordinal assumption is
made regarding the dependent variables:
Participant Camera1 Camera2 Camera3 Camera4 Camera5
1 15 9 14 6 12
2 13 12 14 8 14
3 13 11 12 12 10
4 14 13 6 5 13
4 ANALYSIS
Consumer psychologists have found that statistical
models such as dummy variable regression or
ANOVA very useful in conjoint analysis for multi-
attribute alternatives.
The task addressed is to model, fit, and if
successful, to predict the choices among alternatives.
Several abbreviations are used in the model, and they
are listed below:
DV = Choice frequency (sum across all people).
Dependent variable, this is the sum of all frequencies
across all people. For example, on camera 1, the sum
of all frequencies across all people, the value is 2146.
IV’s= Product attributes. Independent variable, this is
the Product attributes as Price, Zoom, Image Quality,
LCD Screen Size, Battery Life.
The Results is a simplified regression model that
helps predict the odds for consumer to choose a
specific product.
Seventh International Symposium on Business Modeling and Software Design
230
To evaluate the relative impact of all attributes,
we use the regression equation in R:
RegModel <- lm(ChoiceFrequency ~
Price+Zoom+Image.Quality+LCD.Screen.Siz
e+Battery.Life)
Predicted Frequency =
= 1500-347*Attribute1 + 257.7*Attribute2 +
321*Attribute3 + 121*Attribute4 + 283.1*Attribute5.
Coefficients Standard tStat
Errors
Intercept 1,500.00 5.05 297.17
Price -347.00 5.05 -68.75
Zoom 257.75 5.05 51.06
Img. Quality 321.38 5.05 63.67
LCD Scr. Size 121.00 5.05 23.97
Battery Life 283.13 5.05 56.09
R-squared =0.99, F-stat=3021
5 MODEL RESULT
People like to look for price, but not like to
compromise price for zoom. It means people like to
pay more for higher zoom. The results can be
summarized into two points.
1. All product features were considered by people
when they choose cameras.
2. If there is no major surprises, they preferred:
• Lower prices (negative coefficient)
• Large zooms (positive coefficient)
• Higher image quality (positive coefficient)
• Larger LCD screens (positive coefficient)
• Longer battery life (positive coefficient)
But price and image quality are most critical since
they have the highest coefficients in the model.
How do we use model results in the future
marketing? We can use this result to predict the
market share in the future. Here is an example:
Camera A: 185 7x zoom 12.1 mg 3.1 in LCD
300
photo
b
attery
Camera B: 225 7x zoom 14.2 mg 3.1 in LCD
300
photo
b
attery
Camera C: 225 7x zoom 12.1 mg 3.1 in LCD
125
photo
b
attery
Camera D: 185 4x zoom 14.2 mg 3.1 in LCD
125
photo
b
attery
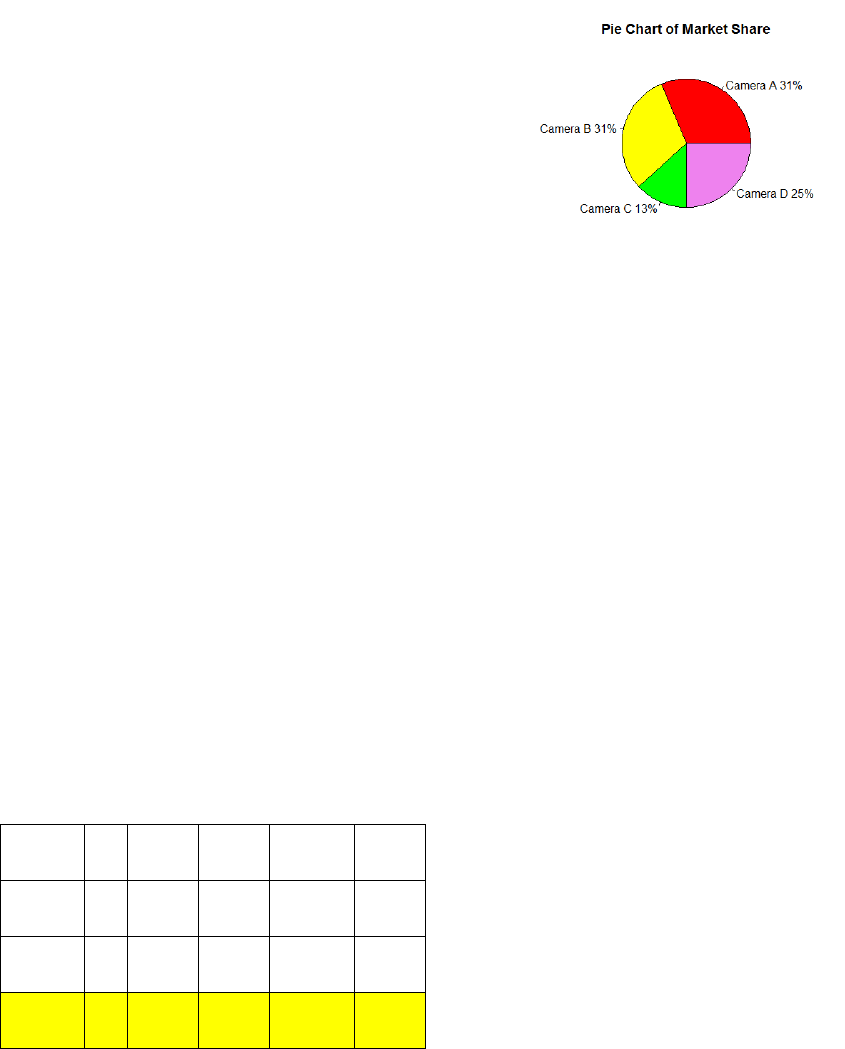
If I want to introduce camera D, what would be
the market share be, comparing to other 3
competitors?
Using the model for the matrix of the example to
calculate the predicted frequencies, and look at the
proportions, and the proportion tells us the relative
preferences and shares of digital cameras in the
market.
6 DISCUSSION
Share in a market model is known as "Share of
Preference". This is the expected share if customers
knew all the information and all the products had the
same level of distribution. If prices and costs are
known, the model can be extended to include revenue
and profit potential.
Models can have extra parameters to take external
effects into account, so providing models that are
more closely related to reality reflects the real market.
A further element missing from this simple model is
the ability to look at different subgroups and
segments to see if a range of products could do better
than a single product in the market. Market models
are very valuable tools in the process of strategic
analysis.
Note that the ratings must reflect what your
customers perceive the position to be. Often
customers' perceptions do not reflect reality and so
changing the ratings on the attributes may be more
about communication than changing the actual
delivery. Often we find that simple service features
such as delivery, availability of help, keeping
promises and so on can have greater psychological
effects on customers, therefore have more significant
market effects than changing price or specific product
features. Market modeling, also known as a market
simulation, is one of the key strengths of Conjoint
Analysis.
There are other types of market models for other
types of trade-off research such as Pricing Research
Market Share Research Using Conjoint Analysis on Digital Cameras
231

or Brand-Price Trade Off Research. Models are a
major benefit of trade-off studies over other forms of
quantitative market research.
REFERENCES
Green, P. and Srinivasan, V. (1978) Conjoint analysis in
consumer research: Issues and outlook, Journal of
Consumer Research, vol 5, September 1978, pp 103–
123.
Marder, E. (1999) The Assumptions of Choice Modeling
Green, P. Carroll, J. and Goldberg, S. (1981) A general
approach to product design optimization via conjoint
analysis, Journal of Marketing, vol 43, summer 1981,
pp 17–35.
Richard T (2010). Journal of Choice Modelling, vol 3,pp
57–72.
Swait, Joffre (1998). "Combining sources of preference
data". Journal of Econometrics, vol 89: pp 197–221.
Luce, R. Duncan (1959). Conditional Logit analysis of
qualitative choice behavior. New York: John Wiley &
Sons.
Zarembka, Paul (1974). Frontiers in Econometrics. New
York: Academic Press. pp. 105–142.
APPENDIX
Attributes Description Level 1 (-1) Level2 (+1)
Price
The price indicates the amount you would pay for the camera in
your local shop.
$ 185 $ 225
Zoom
This is how much the camera can offer a 'close up' of what you are
looking at. A greater zoom indicates you can get a better 'close up'
image.
4x optical 7x optical
Image Q/ty
This is how detailed the picture is when stored by the camera. A
higher image quality indicates you can print a larger version of the
p
hoto.
12.1 meg 14.2 meg
LCD Scr. Size
This is the size of the LCD display on the back of the camera. A
larger LCD offers a better preview of you photo when you take it.
2.3 in 3.1 in
Battery Life
This is how many photos the camera can take before it needs to
have the battery re-charged.
125 photos 300 photos
Seventh International Symposium on Business Modeling and Software Design
232
