
MPT: Suite Tools to Support Performance Tuning in NoSQL Systems
M. El Malki, H. Ben Hamadou, N. El Malki and A. Kopliku
IRIT: Institut de Recherche en Informatique de Toulouse, France
Keywords: NoSQL, Cassandra, Mongodb, Monitoring, Tuning Performance.
Abstract: NoSQL databases are considered as a serious alternative for processing data whose volume reaches limits that
are difficult to manage by relational DBMS. So far, they are praised for the capability to scale, replication and
their capability to deal with new flexible data models. Most of these systems are compared to read/write
throughput and their ability to scale. However, there is a need to get more in depth to monitor more precise
metrics related to RAM, CPU and disk usage. In this paper, we propose a benchmark suite tools that enables
data generation, monitoring and comparison. It supports several NoSQL systems including: column-oriented,
document-oriented as well as multistores. We present some experimental results that show its utility.
1 INTRODUCTION
Within the last years, the incredible increase of data
has contributed to the development of new data
management systems known as Not Only SQL
(NoSQL) systems. They are based on four data
models (Corbellini et al., 2017): column-oriented,
graph-oriented, document-oriented and key-value
oriented (Cattel. 2017). In few years, NoSQL systems
have become a reliable alternative to relational
systems. They are well known for their horizontal
scaling and their ability to absorb extremely large
variable data with in fault-tolerant environments.
NoSQL systems provide a high availability
environment, i.e., the system makes sure that there is
a response for every query.
However, to ensure such availability, NoSQL
systems incorporate highly optimized read/write
mechanisms, which require important memory
resources (Talha Kabakus et al., 2016; Xiang et al.,
2010).
The read mechanism is tightly related to the
writing mechanism configuration (Xiang et al., 2010).
A maximum optimization of the writing
performances affects the reading performances and
vice versa (Cattel, 2011). Therefore, many systems
allow performance tunings that enable database
administrators/data architects to tune the performance
of the NoSQL system with respect to read/write or
querying workloads. Tuning is usually done and
tested before deployment of solutions. This step
stands to evaluate major of NoSQL system
performances; system resources utilization i.e.
adjusting the memory and the resources usage, in
order to achieve the expected performance.
It becomes important to have benchmarks that can
enable comparison and monitoring on different
NoSQL systems. We need these benchmarks within
each system to check tuning performance and we
need them to compare the different NoSQL systems.
We also need to be able to measure performance in
multistores (Valduriez et al., 2015).
Unfortunately, performance tuning faces two
additional constraints:
Multistores Support. According to numerous
studies, NoSQL systems have been developed
for specific tasks. It is though often necessary
to combine multiple stores together, such
systems are called multistores (Lu, et al,
2017).
Data Synchronizations Issues within the
Cluster. NoSQL systems are designed to be
fault-tolerant. Indeed, the loss or the
temporary absence of a node within the cluster
is not automatically detectable by the user.
While read/write operations are ensured on the
other nodes. Nevertheless, the recovery of the
unavailable node requires its synchronization
with the other nodes, i.e. a coordination
process so that all nodes have a copy of the
most recent data. This process can be
performed manually (DBA administrator) and
it should be performed locally at each node.
This process may add extra overhead due to
El Malki, M., Ben Hamadou, H., El Malki, N. and Kopliku, A.
MPT: Suite Tools to Support Performance Tuning in NoSQL Systems.
DOI: 10.5220/0006687601270134
In Proceedings of the 20th International Conference on Enterprise Information Systems (ICEIS 2018), pages 127-134
ISBN: 978-989-758-298-1
Copyright
c
2019 by SCITEPRESS – Science and Technology Publications, Lda. All rights reser ved
127

the unnecessary resources usage and
dramatically impact read/write performances.
Therefore, the last challenge consists in
proposing a continuous nodes maintenance by
automating the recovery operations i.e. repair
process.
In this paper, we present a benchmarking tool that
enable DBA to tune and monitor the NoSQL
performances with guarantee to best resources
usages. Our suite tools is built to offer for both
academia and industrial a useful benchmarking tools
with a reference dataset and a set of exploratory
queries. To the best of our knowledge, we introduce
our benchmarking suite as one of the fewer solutions
that supports multistores systems. More precisely the
benchmark provides:
performance tuning interface: setting
configuration parameters
monitoring tool: displaying metrics in real-
time fashion
benchmarking tool: data loading and
exploratory queries execution.
Figure 1: Functionalities Supported.
In this paper, we introduce the motivations behind
the experimental works showing the use cases of the
benchmark. We study the impact of tuning
parameters while dealing with read/write
performances. We set different configurations
parameters in order to tune: cache memory, write
buffers, heap size (1/2
th
Heap Size, 1/4
th
heap size). In
each case, we study their impacts on different metrics
such as CPU usage, read/write throughput, memory
usage
The paper is organized as follows. In the next
section, we present the related works. In Section 3 we
describe our benchmark and finally we present our
experimental work and the conclusion.
2 RELATED WORK
Recently several benchmarks have been developed
within the NoSQL systems (Murugesan et al., 2014;
Cooper et al., 2015; Dehdouh et al. 2015; Chevalier
et al., 2015). Among these tools, significant focus is
devoted to the study of the three V's (volume, variety,
veracity of data) and the comparison of logical data-
models. In this paper, we focus on performance
tuning on NoSQL systems. Works can be
distinguished based on the nature of:
performance tuning;
data synchronization (data repair).
2.1 Performance Tuning
In this subsection, we investigate performance tuning
works by studying two domains: academic works and
industrial tools.
In the context of academic works, we start by
citing the work presented in (Sathvik, 2013), that
studies the tuning performances within the column-
oriented model, Cassandra (Veronika et al., 2013). It
determines the metrics related to the memory usage
and exposes their impact on the read/write
mechanisms (Sathvik, 2013). These same metrics
were integrated by (Prassana 2012) within a tool that
provides a graphical visualization of these metrics. In
(Murugesan et al., 2013) the authors analyse the
different logging methods offered by comparing them
to standard method.
Several other works have also focused on
studying performances in Cloud platforms (Wu et al.,
2013) and Hadoop frameworks (Dede et al., 2013).
(Wu et al., 2013) diskusses the difficulties and the
complexity of monitoring cloud platforms and the
authors propose a scalable monitoring platform,
based on two integration methods, called data
extraction and data storage, using Ganglia and Cacti
(Wu and al., 2013). In (Gabriel et al., 2015), the
authors draw up a description of the monitoring tools
focuses on tools tailored for Hadoop.
As it concerns industrial tools, we noticed that
there was a real interest for developing monitoring
tools, regardless of the benchmarks tuning.
We also figured out that the monitoring tools
specifically designed for Cassandra are not actually
very common. Moreover, Cassandra exposes
essential metrics for cluster monitoring via JMX
(Sam R. Alapati, 2018), which makes it possible to be
used by monitoring tools based on JMX like Ops
Center and Devcenter, which help to keep tracks of
the resources (Memory, CPU, cache) usage. These
tools have been specifically developed for Cassandra
Co nfig uration
M on ito rin g :
q
Performances
tuning
Benc hm a rkin g
q
Table c re ation
q
D ata in se rtion
q
D ata que rin g
Multituning
MongoDB
Supportedtasks
Supported
NoSQLsystems
Cassandra
Datalake
Cassandra&
MongoDB
ICEIS 2018 - 20th International Conference on Enterprise Information Systems
128

by the Datastax editor with a commercial version for
professional use. As it comes to MongoDB, it has
embedded basic monitoring capabilities as mongostat
and mongotop (MongoDB User Guide, 2016). Also,
there are several plugins that allow the integration of
MongoDB in most of the popular performances
monitoring tools, to mention Munin, Ganglia, Cacti,
Zabbix or Nagios. These solutions are not specific to
MongoDB but they are adapted to be compatible
with.
Table 1: Benchmarking NoSQL tools.
tool
Configuration
Benchmarking
Monitoring
OPScenter
x
x
NAGIOS
x
JCONSOLE
x
Cassandra
STRESS
x
x
YCSB
x
Our solution
x
x
x
However, despite the fact that all of the above
mentioned tools offer important performance
monitoring interfaces for major of NoSQL systems’,
they were built to run exclusively on a specific
NoSQL system or there is a need to run them
separately on each of the desired systems. Moreover,
in the context of multistore, it is necessary to have a
monitoring tool able to support several DBMS at
once. To our knowledge, a tool capable of monitoring
so-called multistore solutions has not been proposed
yet (Table 1).
Moreover, by studying performance tuning, we
must also considerer cumbersome NoSQL issues
such as data synchronization.
2.2 Data Synchronization
(Data Repair)
Related woks on NoSQL architectures emphasize the
fact that NoSQL systems do not support transaction
management (Abadi t al., 2014). The CAP theorem,
on which NoSQL systems are based, does not ensure
data coherency between the different nodes (Abadi t
al., 2014). In the case where data is highly distributed
over multiple datacenters, an update operation may
take significant delay to be replicated on different
datacenters. Furthermore, data centers may not have
the same version of data at the same time. This kind
of problem occurs mainly when one data node
becomes unavailable for a while. The latter must
synchronize the latest versions of data that have been
modified during its unavailability.
To our knowledge, there is a lack of academic
works that enable automatic repair process. This
industrials solutions as Cassandra stress and
Opscenter are commercial solutions.
The concern of our article is to present a
benchmark that allows evaluations of the
performance while tuning different configuration
parameters, i.e. before the deployment phase.
3 NoSQL SYSTEMS
In this section we describe two systems used in our
solution, the column-oriented model with Cassandra
and the document-oriented model with MongoDB.
3.1 Cassandra
Cassandra is a column-oriented data system based on
a master-master architecture. It is optimized for fast
and highly read/write operations. In what follows we
give a description on the read/write mechanisms
inside Cassandra.
Path Write. During a writing operation, the data is
firstly written into a log called commitlog, and it is
also written into a memory structure called memtable.
A writing operation is validated if both of the
previous operations have been successfully
processed. This same process is done in every node.
Secondly, memtables are sequentially flushed to the
disk, onto SSTables structures. This operation called
flush is invoked when the memtable content exceeds
the configurable threshold.
Moreover, SSTables are immutable, and each one
can have different versions accumulated on disk.
These different versions must periodically be
consolidated. The merging process is called
compaction; it can significantly impact the reading
performance according to adopted compaction
strategy.
Read Path. For each read requests, the coordinator is
responsible to assign the request to the nodes that
offer higher availability in order to return data with
the latest version, the result of an active memtable and
different SStable must be combined. The read process
is performed via two main steps. On the first step, it
verifies if the data is available on row cache memory.
If not, it must, on the second step, merge the different
SStable to return the most recent version.
MPT: Suite Tools to Support Performance Tuning in NoSQL Systems
129

3.2 MongoDB
MongoDB is a document-oriented database with a
high horizontal scalability. The main idea of
MongoDB is to freely evolve and make shards to
improve read/write performances. Unlike Cassandra,
MongoDB is based on a master-slave architecture and
the OS takes in charge the cache writing. Indeed, the
memory usage of MongoDB is under the control of
the operating system's virtual memory. In other
words, MongoDB will use memory as much as it is
available, and it will switch to disk if needed.
Deployments with enough RAM memory for the
application's data will achieve best performances.
Since version 3, MongoDB has introduced a new
storage engine called WiredTiger, which allows the
specification of a maximum cache size, which did not
exist in the old storage engines (MMAPv1, TokuMX,
Rocks).
Like Cassandra, the write process is not
instantaneous. Data is first written in the log files
(commitlog) and then is written to the disk with
respect to the configuration parameters.
In the NoSQL systems, numerous configuration
strategies can be envisaged. The adequate
configuration choice must reply to the expected
workloads. The monitoring tools help to ensure the
best strategy. In the following, we describe our tool
suite to improve tuning performances.
4 BENCHMARKING TOOL MPT
The name of the proposed benchmark suite is MPT
(Management Performance Tool). It is designed to
support the resources management and used in a
NoSQL multistore. The particularity of MPT is the
fact that it is able to adjust, monitor and compare two
NoSQL systems’ performances: columns-oriented
and documents-oriented. The tool also evaluates the
systems separately.
MPT includes the following main components:
Configuration Tool: it allows the
configuration of the parameters related to the
read/write mechanisms.
Benchmarking Tool: it compares the memory
usage within two NoSQL systems.
Monitoring Tool: it tracks the metrics related
to the resources’ usage in both systems.
4.1 Configuration Tool
Since setting the configuration files may be
sometimes a cumbersome task, MPT allows
administrators to manipulate them in a graphical
mode and thus set the different parameters so they can
be evaluated easily.
As there are many configuration parameters, we
focus on those having a direct impact on the
performance of the read/write operations, i.e.
performance and system resource usage tuning,
including commit log, compaction, memory, disk I/O,
CPU, reads, and writes. MPT is able to distinguish
between common parameters for both systems and
specific ones. More precisely, regarding the common
parameters, we are concerned with the following
aspects.
Cache Memory. There are two types of cache:
row_cache and key_cache. Row cache temporarily
keeps the data written into the Heap memory and
therefore, during a reading operation, it allows a
quick response without accessing the disk. However,
as the cache size is limited, i.e. in Cassandra 2.2 and
later, it is fully stored into off-heap memory using a
new implementation that relieves on garbage
collection pressure in the JVM. The subset stored in
the row cache use a configurable amount of memory
for a specified period of time. It is necessary to
determine the cycle for flushing data to disks. The
related parameters are:
key_cache_keys_to_save
key_cache_size_in_mb
key_cache_save_period
For the specific parameters for each system, we
focus on the following aspects. We start by the
parameters related to Cassandra configuration.
Compaction and Compression Strategies. These
two aspects are the main resource usage regulators in
Cassandra and they can often cause a fail if the
following parameters are not properly set:
MemTable allocation type
MemTable cleanup threshold
File cache size
MemTable flush writer
MemTable heap/offheap space
Memtable_heap_space_in_mb
Compaction_throughput_mb_per_sec
Concurrent_compactors
After defining the different specific configuration
parameters for Cassandra, we introduce now the ones
related to MongoDB.
Storage Engine. MongoDB offers the possibility
to choose among one from four storage engines. Only
the latest storage engine Wiredtiger offers the
possibility to set the cache memory. The other three
ones delegate the memory management to the OS
system. We dress the different setting parameters in
Table 2.
ICEIS 2018 - 20th International Conference on Enterprise Information Systems
130
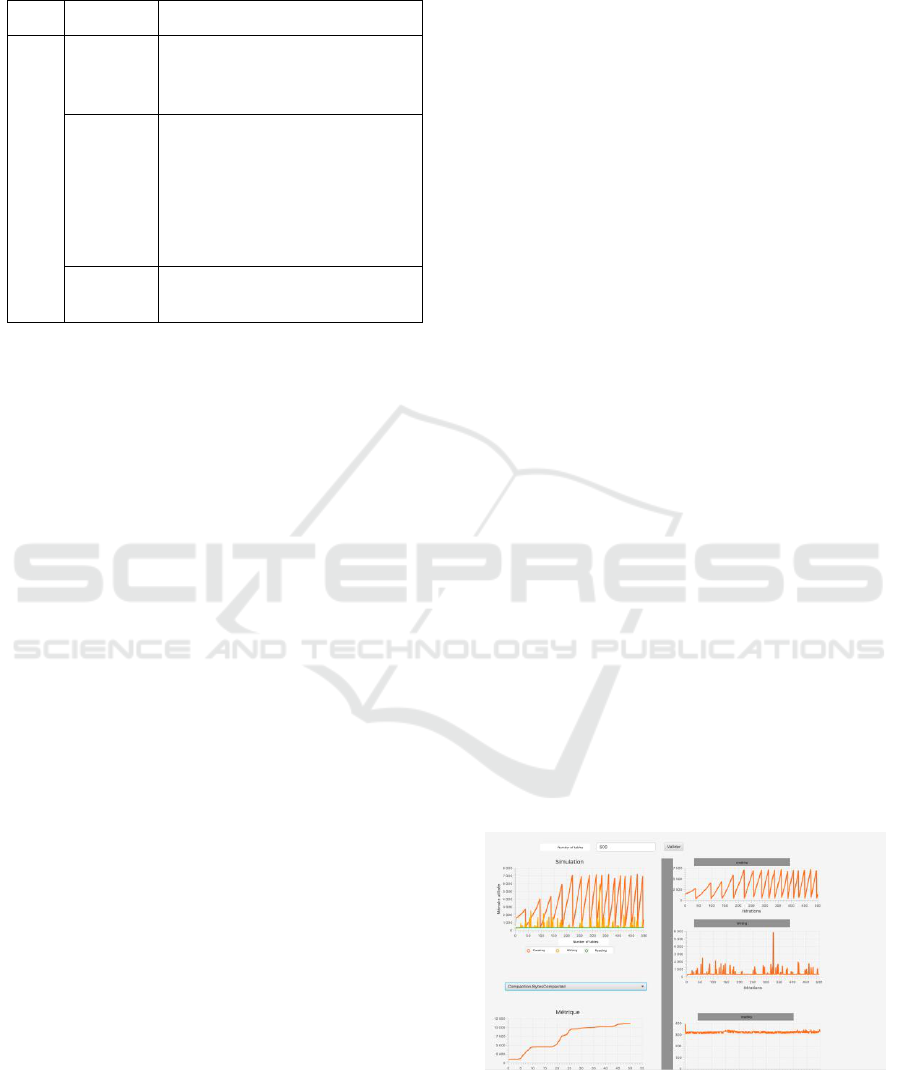
Table 2: Parameter’s configuration related tuning
performance.
Metrics
Nom metrics
Cassandra
/Cassandra
Key Cache
key_cache_keys_to_save
key_cache_size_in_mb
key_cache_save_period
MemTable
MemTable allocation type
MemTable cleanup threshold
File cache size
MemTable flush writer
MemTable heap/offheap space
Compaction_throughput_mb_per_sec
Concurrent_compactors
Commitlog
CompletedTasks
PendingTasks
TotalCommitLogSize
4.2 Benchmark Tool
In this section, we describe the main functions of the
suite tool, which allows benchmarking the memory
usage.
The tool tracks in real-time the memory used by
the NoSQL system process. This metric enables us to
study the memory at different phases:
(i) The Table Creation Phase. The user can
specify the number of tables to be created and
thus follow step by step the memory allocation
for each table. The data schema follows the flat
logic model (Chevalier et al., 2015) i.e. all
attributes are flat without any nesting level
according the following schema: {id, name,
username, old, city, mobile}. The
attribute id is used as a partitioning key.
(ii) Data Loading. The user can track the memory
allocated and used for the population process of
each table. The inserted data is generated
randomly. The tool integrates a data generator
where the number of rows is a random number
between 107 and 1012. The data is generated
once for both systems.
(iii) Data Querying. The tool provides 12 queries.
4 queries with a simple selection;
4 queries with a “where” clause on the
partitioning keys.
2 queries with a “where” clause on keys that
are not part of the partitioning key.
2 queries with a “group by” clause
The user can specify the query to evaluate and
track the allocated memory for each queried table.
The comparison of the NoSQL logic models is not the
subject of this study, many works have already
conducted in this direction (Chevalier et al., 2015).
4.3 Monitoring Tool
Using JMX, Cassandra and MongoDB provide
metrics related to each node in text/log formats. We
extract these metrics and present them as a graph.
Thus, the user can specify the desired metrics and
follow in real time the metrics evolution.
The user can also specify the metrics to be
displayed for the whole cluster. We choose to not
centralize the data and to monitor each node
behaviour at the same interface.
The extracted metrics are reported in table Table
2.
4.4 GUI
The home interface of the GUI allows choosing the
system to be evaluated, Cassandra, MongoDB or the
multistore.
Thereafter, there are two tabs, a tab for
configuration and a tab for benchmarking monitoring.
The configurations tab allows the user to set the
parameter values in the configuration subsection. The
second tab contains the memory usage graphs, which
are structured as follows:
A graph for “table creation” phase, which
displays the memory in MB, used for each
created table.
A graph for “loading” phase that displays the
memory used for the data inserted onto each
table.
A graph for “reading” phase that displays the
memory used for each queried table, in MB.
A Simulation graph, which combines the
results of the three previous graphs.
A graph to track the performance tuning
behaviour.
Figure 2: interface of our solution MPT.
MPT: Suite Tools to Support Performance Tuning in NoSQL Systems
131
4.5 Automatic Synchronization
(Repair) Process
In order to synchronize t-he data, NoSQL systems
integrate a synchronization tool generally called
Repair. It consists of manually executing a repair
operation at each node. This repair process is based
on Mercle tree, i.e. comparing each partition of table
/document with other partitions of other replicas. This
process significantly increases the CPU usage due to
the important number of comparisons. This CPU
usage is more important if other read/write processes
are running at the same time. In our solution, we have
built a script to automatize the repair process. It is
executed at Cassandra start and it is based on the
following rules:
A repair operation is launched in continuous
each ten days. This interval is used to do not
impact the others process as the compaction.
A repair operation is not launched if read/write
is running.
A repair operation is not launched if
compaction operation is running.
Only one repair operation can be lunched at
the same time.
5 EXPERIMENTS
In this section, all the experiments were conducted
using a single node server that is a 𝑖5 3.4𝐺𝐻𝑧
processor coupled with 8𝐺𝐵 of RAM and two 2𝑇𝐵
𝑆𝐴𝑇𝐴 disks that runs under 𝐶𝑒𝑛𝑡𝑂𝑆 7, used to
evaluate 𝑀𝑜𝑛𝑔𝑜𝐷𝐵 𝑣3.4.2. we use anther server with
the same characteristics to evaluate Cassandra v3.1.0.
We used the data loading component benchmark of
the tool suite (1) to create table and documents, (2) to
load generated data into MongoDB/Cassandra and (3)
to query data. The data is generated using csv format
for Cassandra and json format for MongoDB.
This is done for illustrative purposes to show that
we can generate, load and query data with our
benchmark. Also, we show that we can monitor each
benchmark phase and all metrics related to
performance tuning. Precisely, we evaluate:
Memory usage with ¼
th
heap size and ½
th
heap
size in both systems Cassandra and MongoDB.
Comparing our solution with another monitoring
tool, Jconsole.
5.1 Memory Usage in Cassandra
In this first experiment, we study the performances by
limiting cache memory at ¼ of heap memory i.e. 2
GB. The results are obtained in real time.
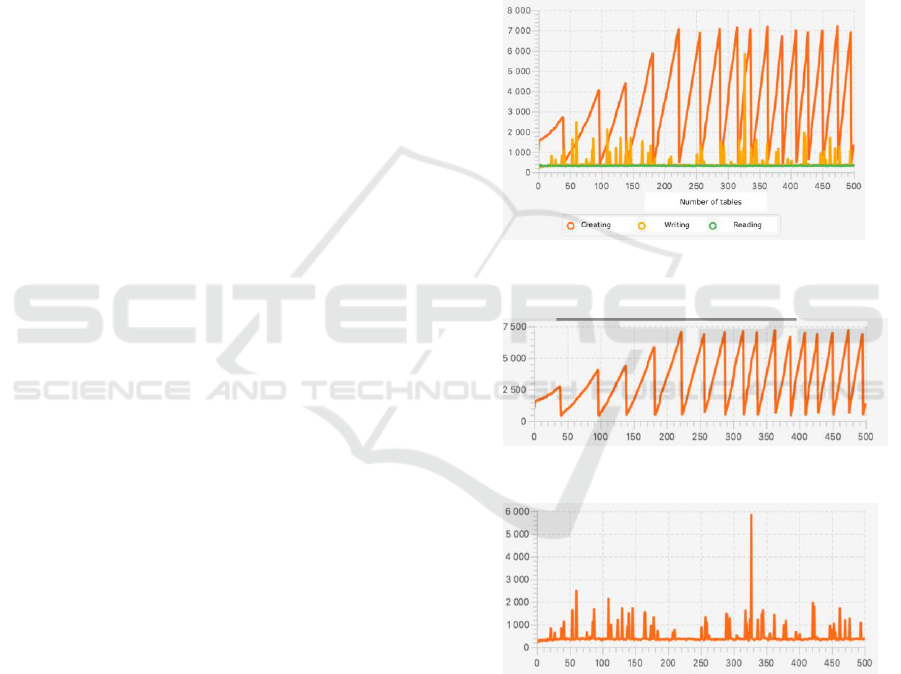
In Figure 3-5 describe the allocated memory
(RAM) for the regarding three phases (Figure 3 & 4):
table creation, data loading and data querying. Each
figure shows the memory usage per table. In the graph
related to table creation phase, we note a maximum
of 75 MB at the end of this phase. A maximum of 60
MB during the phase of data writing (Figure 5) and a
maximum of 40 MB during data reading phase.
Figure 3: Overall Memory usage for three phases
(Memory/table).
Figure 4: Memory usage at creating phase (Memory/table).
Figure 5: Memory usage at writing phase (Memory/table).
5.2 Comparing MPT with JConsole
In this experiment, we compare memory usage using
another monitoring tool JConsole. As a reminder,
JConsole is a monitoring tool known in Java
environments since several years. We compare results
provided by JConsole tool and the results provided by
our tool. The results are reported in the Figure 5 and
Figure 6.
ICEIS 2018 - 20th International Conference on Enterprise Information Systems
132
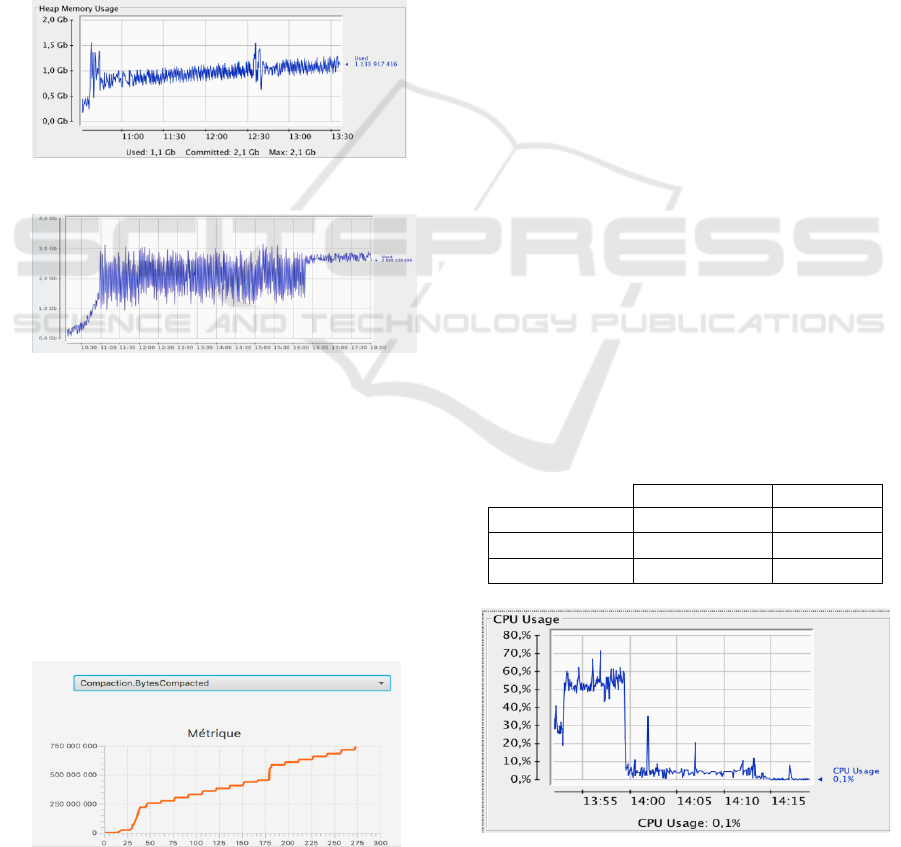
We conduct the same experiment i.e. evaluation
of three phases with ¼ of heap and ½ of heap.
The Figure 6 shows that the max is 3.1GB for ½th
heap i.e. 4 GB and 1.6 GB for ¼ of heap i.e. 2GB.
Unlike our solution, distinguishing between results of
each phase can be extremely difficult. In simulation
Figure 3, we can see that it is possible to monitor
separately the three phases.
JConsole does not handle memory usage for
specific applications but it indicates memory usage
for all Cassandra processes that turn at the same time.
Thus, JConsole does not offer the same flexibility
than our solution and it is impossible to adjust
performance according the application. Note that the
results are given as times series and not by
table/document.
Figure 6: Usage memory using JConsole with 2GB.
Figure 7: Usage memory using JConsole with 4GB.
Another advantage for our solution when compared
to JConsole is the fact that it cannot evaluate
Cassandra/ MongoDB metrics as we can represent in
the following experiment (Figure 8). In this
experiment, we show that our solution is capable to
report the metrics related to the performance tuning.
For example, In the Figure 8, we report in KB the size
of data flushed per number of table during the
compaction operation. The volume of data compacted
is more important due to number of flush writer. We
reach 750 MB at table number 300.
Figure 8: Metrics of data compacted in Cassandra.
This result is directly related to operation of
memory release that we can observe in In Figure 3.
In fact, in Figure 3, we can also shows the memory
for release operations. The number of memtable flush
is significantly decreases when cache memory free
decreases. The number of flush writer starts at each
100 memtables to achieve 30 memtables. This is
explained by two different mechanisms. The first is
related to the limited lifetime of Cassandra tables.
Memtables must be written in SST before memory
release. The second mechanism is related to the
manipulation of the JVM memory. The garbage
collector is trigged to release the old java objects.
In Figure 7, we observe the flush writer with ½th
of heap. The number of flushed memtables is less
important than the previous configuration. The
interval flushing is largest; we note a flush operation
at each 210 memtables. This is explained by a cache
memory that is found to be more important.
These results impact the read/write mechanisms
and the CPU utilization.
5.3 CPU Usage Performances
In this experiment we evaluate and compare CPU
utilization.
In Figure 9, we report the CPU utilization with ¼
th
of heap size. We can see that we exceed 70 % of CPU
usage during table creation phase. The utilization of
CPU becomes less important to reach a maximum of
35% in loading phase and 12% at reading phase.
In Table 3, we report all results in both
configuration (1/4
th
and ½
th
heap). We note that the
CPU usage decreases while increasing the heap
memory.
Table 3: Comparing CPU utilisation.
¼
th
heap
½
th
heap
min
3.5%
2.8%
max
72%
44%
average
17%
10%
Figure 9: Usage CPU with heap of 2 GB.
MPT: Suite Tools to Support Performance Tuning in NoSQL Systems
133

6 CONCLUSION
This paper presents a suite of tools that enable
benchmarking and monitoring for NoSQL systems by
considering the columns-oriented model, Cassandra
and documents-oriented model, MongoDB. We build
a complete suite of tools integrating a configuration
tool, a benchmarking tool as well as a monitoring
tool. We also proposed an automation process of data
synchronization.
We conduct experiments to show the need and the
requirements of this solution, and we evaluate the
performances on the read/write mechanisms. Our
experiments show that we can facilitate the real-time
monitoring of Cassandra and MongoDB metrics by
offering graphical reports.
As perspectives, we plan to publish the developed
tool online to allow researchers and industrials to
conduct all the experiments in a real-conditions. Also,
we plan to compare our tool with the native
alternative tools of existing NoSQL systems.
REFERENCES
D. Abadi, R. Agrawal, A. Ailamaki, M. Balazinska, P. A.
Bernstein, M. J. Carey, S. Chaudhuri, J. Dean, A. Doan,
M. J. Franklin, J. Gehrke, L. M. Haas, A. Y. Halevy, J.
M. Hellerstein, Y. E. Ioannidis, H. V. Jagadish, D.
Kossmann, S. Madden, S. Mehrotra, T. Milo, J. F.
Naughton, R. Ramakrishnan, V. Markl, C. Olston, B. C.
Ooi, C. Ré, D. Suciu, M. Stonebraker, T. Walter, and J
Widom. 2014. The Beckman Report on Database
Research. SIGMOD 2014 -. 43, 3 61-70.
A. Jacobs, “The pathologies of big data,” Communications
of the ACM, vol. 52, no. 8, pp. 36–44, Aug. 2009
Abdullah Talha Kabakus and Resul Kara A performance
evaluation of in-memory databases, Journal of King
Saud University - Computer and Information Sciences
A. Ghazal, T. Rabl, M. Hu, F. Raab, M. Poess, A. Crolotte,
and H. Jacobsen.. BigBench: towards an industry
standard benchmark for big data analytics.
SIGMOD'13. 1197-1208
C. Bondiombouy, B. Kolev, O. Levchenko, P. Valduriez
Multistore Big Data Integration with CloudMdsQL T.
Large-Scale Data- and Knowledge-Centered Systems
2016 28: 48-74
Chevalier M, El Malki M, Kopliku A, Teste O, Tournier R
Benchmark for OLAP on NoSQL technologies
comparing NoSQL multidimensional data warehousing
solutions RCIS 2015, pp 480–485
Corbellini, Alejandro, MATEOS, Cristian, ZUNINO,
Alejandro, et al. Persisting big-data: The NoSQL
landscape. Information Systems, 2017, vol. 63, p. 1-23
Cooper BF Yahoo! cloud serving benchmark, 31 Mar 2010
https://s.yimg.com/ge/labs/v1/files/ycsb-v4.pdf.
Dede E, Govindaraju M, Gunter D, Canon RS,
Ramakrishnan L. Performance evaluation of a
mongodb and hadoop platform for scientific data
analysis. workshop on scientific cloud computing
G. Iuhasz and I Dragan An Overview of Monitoring Tools
for Big Data and Cloud Applications SNASC ‘15
Alapati S.R. (2018) Securing Cassandra. In: Expert Apache
Cassandra Administration. Apress, Berkeley
K. Dehdouh, O. Boussaid, and F. Bentayeb, “Columnar
nosql star schema benchmark,” in Model and Data
Engineering. Springer, LNCS 8748, pp. 281–288, 2014
K.-H. Lee, Y.-J. Lee, H. Choi, Y. D. Chung, and B. Moon,
“Parallel data processing with mapreduce: A survey,”
SIGMOD pp. 11–20, 2012.
Lu, Jiaheng, Holubova, Irena, Multi-model Data
Management: What's New and What's Next? EDBT
2017, pp. 602-605, Venice, Italy, March 21-24, 2017
MingLi Wu, Zhongmei Zhang and Yebai Li, "Application
research of Hadoop resource monitoring system based
on Ganglia and Nagios," 2013 IEEE 4th SES
MongoDb User guide : https://docs.mongodb
P. Murugesan and I. Ray, "Audit Log Management in
MongoDB," 2014 IEEE World Congress on Services,
Anchorage, AK, 2014, pp. 53-57.
Peng Xiang, Ruichun Hou and Zhiming Zhou, "Cache and
consistency in NOSQL," 2010 Science and Information
Technology, Chengdu, 2010, pp. 117-120.
Rick Cattell. 2011. Scalable SQL and NoSQL data stores.
SIGMOD Rec. 39, 4 -12-27
Sathvik Katam Performance Tuning of Big Data Platform
Cassandra Case Study Faculty of Computing. Blekinge
Institute of Technology
Stonebraker, M., 2010. SQL databases v. NoSQL
databases. Commun. ACM 53, 10–11.
TPC, Transaction Performance Councli, “TPC
http://www.tpc.org/
ICEIS 2018 - 20th International Conference on Enterprise Information Systems
134
