
Applying Causal Inference in Educational Data Mining: A Pilot
Study
Walisson Ferreira de Carvalho
1,2
, Bráulio Roberto Gonçalves Marinho Couto
3
, Ana Paula Ladeira
1
,
Osmar Ventura Gomes
1
and Luiz Enrique Zarate
2
1
Centro Universitário UNA, Av. Professor Mário Werneck, 1685, Belo Horizonte, Brazil
2
Pontifícia Universidade Católica de Minas Gerais, Rua Walter Ianni, 255, Belo Horizonte, Brazil
3
Centro Universitário de Belo Horizonte - UniBH, Av. Professor Mário Werneck, 1685, Belo Horizonte, Brazil
Keywords: Causal Inference, Educational Data Mining, e-Learning.
Abstract: Understanding the reasons that leads students to succeed during their course is a challenge for every
Institution of Education, independently of the modality of teaching and learning adopted. In this paper we
use the theory of Causal Inference for analyzing the main factors that causes the success, or failure, of an
engineering student enrolled in an online course of Algorithm . We used data extracted from the Learning
Management System Moodle and, after preprocessing the dataset, analyzed the actions performed by the
students during the six months (20 weeks) that the online course lasted. We concluded that before
submitting an evaluation activity to be assessed, it is important that students analyze the problem
thoroughly. Students that took a little bit longer to submit their work got more chances to be approved.
1 INTRODUCTION
Over the last years a new application of Data Mining
has been emerged and it has been object of studies
for many researchers, the Educational Data Mining
(EDM). This interdisciplinary area of Data Mining
has as its main goal to analyze data from the
education sector in order to solve problems related
to education. According to Romero and Ventura
(2010), although EDM focus on educational data, it
uses techniques of traditional Data Mining.
The Handbook of Educational Data Mining
organized by Romero et al. in 2011 presents some
applications of EDM. Among them, it is possible to
emphasize improvement in quality of the courses,
the opportunity in modeling the profile of students,
increasing performance of students, predicting
performance and others that can improve the quality
of the process of teaching and learning.
Baker and Carvalho (2011) presents a taxonomy
of EDM divided in five sub areas: i) predicting; ii)
clustering; iii) relationship mining; iv) distillation of
data for human judgment; and v) discovery with
models. On the third subarea, Relationship Mining,
according to the authors, the goal is to discover
relationship between variables, being most common
kinds of relationship association, correlation,
sequential pattern and causal mining. In this article
the focus will remain on the causal association
among variables.
Besides the taxonomy, another issue pointed out
by Baker and Carvalho (2011) is the opportunity for
researchers that combine online education and
Educational Data Mining aiming to improve the
process of teaching and learning. This opportunity
emerges from the growth of this modality of
education and the use of Learning Management
System (LMS) or e-learning systems such as Moodle
(https://moodle.com/), Eliademy
(https://eliademy.com/) and others.
In 2011 Judea Pearl won the Alan Turing Award
“For fundamental contributions to artificial
intelligence through the development of a calculus
for probabilistic and causal reasoning.” By causal
reasoning Pearl means that it is necessary to look for
root causes of an event and the importance of
dissociate correlation and causality. After all,
correlation doesn't imply in causation.
The three pillars of Causal Inference theory are
Baysean Network, also created by Pearl in 1985,
structural equation model and "do" operator which
makes possible to make interventions and to
simulate the model. From these pillars and using
454
Ferreira de Carvalho, W., Roberto Gonçalves Marinho Couto, B., Ladeira, A., Ventura Gomes, O. and Zarate, L.
Applying Causal Inference in Educational Data Mining: A Pilot Study.
DOI: 10.5220/0006792504540460
In Proceedings of the 10th International Conference on Computer Supported Education (CSEDU 2018), pages 454-460
ISBN: 978-989-758-291-2
Copyright
c
2019 by SCITEPRESS – Science and Technology Publications, Lda. All rights reserved
some concepts such as interventions and
counterfacts Pearl proposed the Structural Causal
Model that make possible to identify main cause (or
causes) of an event (Pearl, 2009a; Pearl, 2009b).
In this scenario, the main goal of this article is,
from data extracted from a LMS, analyze the causes
of success or failure of students in an Algorithm
course using a LMS to support their online activities.
2 METHODS
This section of the paper presents the theoretical
background of Causal Inference, sections 2.1 to 2.3,
and the materials used to develop this work.
2.1 Causal Inference
Finding the root cause of a problem is a challenging
task for most of professionals and researchers in
many fields of knowledge such as health, education
and other socials fields. Traditionally used along the
years, the concept of association does not answer the
question raised by those areas.
In this sense, Causal Inference Theory has
emerged with the main goal of supporting the search
for the cause of an event based on Artificial
Intelligence.
The theory introduced by Pearl (2009) is a
bilingual language as shown in figure 1. From one
side, this language uses graph theory (G) to show the
data observed and its causal relationship. By other
side, the model applies queries (Q) that make
possible interventions and simulations on the model.
Figure 1: The bilingual structural causal model extracted
from the lecture Eight Pillars of Causal Wisdom presented
by Judea Pearl in 2017.
2.2 Bayesian Network
A graph (G) is a structure that consists on a set of
vertices (V) and set of edges (E) that links those
vertexes. In Causal Inference, the set of vertices is
composed by the variables, explanatories and
outcomes. Edges are represented by the link between
two variables.
An edge in a graph can be directed or undirected.
Directed edges, represented by an arrowhead, can
also be bidirected. In a Causal Graph the direction of
the arrow indicates which node (variable) causes the
other, in other words, the graph represents the cause
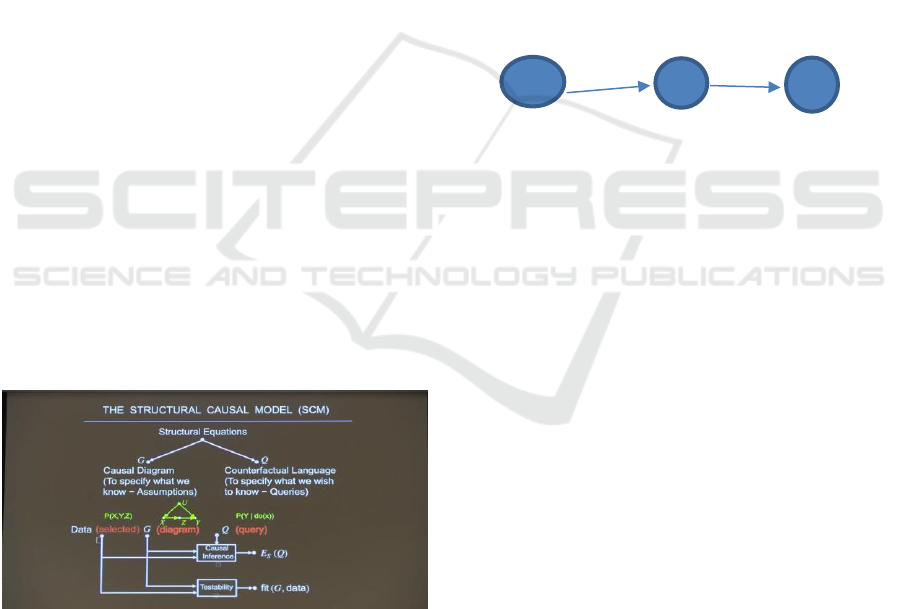
effect relationship. Figure 2 show a directed edge
linking nodes X and Y, in this case, X is the cause of
Y.
Bidirected means that the two nodes have some
common cause that were not observed, this common
cause is known as confounder.
When there is no arrowhead linking the nodes of
the graph, the graph is undirected. This structure is
called skeleton of the graph (G).
A path is a sequence of edges from a node to
another. For example, the path from X to Z is
((X,Y),(Y,Z)).
Figure 2: Represents a DAG linking the variables (X,Y,Z).
If all paths of a graph are directed, such as figure 2,
we have a directed graph. Besides directed, if the
graph has no cycle, the graph is called a DAG, short
for Directed Acyclic Graph.
DAGs are known as Bayesian Network, term
coined by Pearl in 1985, and have been used to
represent causal or temporal relationship. One
important aspect of adopting Bayesian Network in
representing causal relationship is that DAG
maintain the reliance on Bayes´s conditional as the
basis for updating information.
Bayes´s conditional states that given a set of n
variables (x
1
, x
2
, x
3
,…,x
n
), the probability of joint
event can be written as the product of n conditional
probabilities:
j
jjn
xxxPxxP
111
|(),,(
Eq.1
Considering that one variable, x
j
, may not depend on
all its predecessors, we can say that the variable
depends on the subset of its predecessors PA
j
. This
set of variables that compound PAj represents the
minimal set of predecessors that renders X, called
Markov Parents or only Parents. The definition of
Markovian parents’ states that:
)|()|(
11
jjjj
xXxPPAxP
Eq.2
X
Y
’
Z
Applying Causal Inference in Educational Data Mining: A Pilot Study
455

This definition of Markovian Parents may be
represented as a DAG. Considering two nodes
representing the variables X
1
and X
2
, an arrow from
X
1
to X
2
is constructed if, and only if, the variables
are dependent. If, another variable, X
3,
is
independent of {X
1
, X
2
} no arrows are drawn
linking the variables. Otherwise, it is analyzed the
dependence between X
3
and X
1
and between X
3
and
X
2
in order to draw directed edges.
When this recursive procedure reaches the j
th
stage, the minimal predecessors of PA
j
is
constructed according to the equation 2. At the end,
the result is a Bayesian Network consistent with the
Markov Parents Definition. This DAG simplifies the
complexity of the Equation 1.
Another important advantage of using Bayesian
Network to represent the causal relationship is the
possibility of doing interventions on the model,
using the “do” operator presented by Pearl (2009). It
is viable simply to remove one edge linking two
variables as if this variable were turned off the
model. And after that, simulates the new model
without considering this removed variable.
2.3 Structural Causal Model
Structural Causal Model (M), Causal Model for
short, is a 4-tuple <V,U,F,P(u)> which V represents
observable variables also known as endogenous
variables, U is the set of background variables also
known as exogenous variables, F are functions
which determines V and P(u) is a distribution over
U.
The functions, F, are equations structured as
shown in Eq 3, considering x as a variable of the set
of vertices V.
),(
iiii
uPAfx
Eq. 3
Being PA
i
, as shown in section 2.2, is the set of
variables responsible for causing x
i
and u
i
are
exogenous variables or disturbances on the model.
According to Pearl (2009), it is possible to apply
three queries from the model: i) predicting; ii)
interventions and iii) counterfactuals
Predicting is related to observing and answers
questions such “what it is?” and “How seeing X
would affect my believes in Y?”.
Interventions are used to simulate scenarios
through the “do” operator. This kind of query aims
to answers questions such “What if I do that?”. This
intervention set variable x constant and generate a
mutilated model M
x
.
Counterfactuals are related to the question “What
if had been different?”, the main goal of this query is
answer “why”.
The generation of the mutilated model from
interventions and counterfactual is considered one
big law of the Causal Inference. Other significant
law is d-separation which considers the conditional
independence.
2.4 Dataset and Algorithm
Data used in this article were extracted from the log
of access of an online algorithm course offered to
students of engineering in the traditional face to face
modality of teaching. The amount of 229 students
that have taken the course during the second
semester of 2016 produced a database with 75,948
instances and 11 attributes.
The Learning Management System used to
support students and teachers during the
development of activities such as assessments,
assignments, forums, chats and other actions was
Moodle - Modular Object-Oriented Dynamic
Learning Environment (https://moodle.org/).
The outcome variable analyzed was the final
grade of student. If the student got a grade higher or
equal to 70, he was approved otherwise the student
failed the course.
The explanatories variables evaluated were
access data onto Moodle, quantitative and qualitative
(generated by access log of users). Box I describes
all analyzed activities performed by the students.
Box I: activities registered by the Moodle log system.
Activity
Meaning
Assign
submit
Student is performing an evaluation
activity: user has closed an evaluative
activity, that was saved on Moodle to
continue later and that was not yet
sends for correction.
Assign
submit for
grading
Student is finishing an evaluation
activity: user has finished an evaluative
task and sent it for correction.
Assign view
Student is performing an evaluation
activity: user has visualized the main
page of evaluative task.
Assign view
all
Student has clicked on the link that lists
all the evaluative tasks of a course
Assign view
feedback
Student accessed the teacher feedback
of an evaluative task.
Assign view
submit
assignment
form
User has viewed an evaluative task that
was already submitted to be corrected
by teacher. It is not permitted to edit
anymore.
CSEDU 2018 - 10th International Conference on Computer Supported Education
456

Box I (cont.): activities registered by the Moodle log
system.
Activity
Meaning
Chat report
User has viewed the chat report of all
previous conversation.
Chat view
User has viewed the history of previous
conversations on a chat.
Course view
User has viewed the main page of the
course to study or preparing to study
some content.
Forum add
discussion
For the first time, user has inserted a
comment in a forum
Forum add
post
User has posted on a forum.
Forum mark
read
User has opened the forum and clicked
on any post.
Forum search
User has used a text search tool in a
forum, to lok for some information.
Forum
update post
User has updated posts on a forum.
Forum view
discussion
User has viewed the forum posts.
Forum view
forum
User has viewed the forum main page.
Forum view
forums
User has viewed the forum main page.
Page view
User has clicked on the page resource
link, a custom html page that was
displayed by the teacher. Student is
studying or preparing to study some
content.
Quiz attempt
Student is performing an evaluation
activity: user has started an evaluative
task, however the results are not yet
saved on the 3Moodle.
Activity
Meaning
Quiz close
attempt
Student is performing an evaluation
activity: user has finished an evaluative
task that was saved on the Moodle.
Quiz
continue
attempt
A questionnaire can be started and
saved so that the student can continue
to carry out the activity later. In this
case the student is giving up for
continuity to the questionnaire that
moment.
Quiz review
Student is performing an evaluation
activity: user has edited an evaluative
task that is saved on the Moodle but not
yet finished.
Quiz view
Student is performing or preparing to
do an evaluation activity: user has
viewed the main screen of a evaluative
questionnaire.
Quiz view
summary
User has clicked a specific link to see if
all questions of an evaluative
questionnaire were answered.
URL view
Student is studying or preparing to
study some content: user has clicked on
a url resource link and was directed to
another page out of the Moodle system.
User update
User has update his data.
The method used to identify the causal relationship
among the variables was PC algorithm, which name
stands for the initials of its inventors Peter and Clark
(Spirtes, Glymour, Scheines, 2000). The IDE
(Integrated Development Environment) used in this
work was GeNIe version 2.2.2204.0 (32-bit
Academic).
The PC algorithm, a structured learning/causal
discovery algorithm that allows for learning
Bayesian networks from data, is composite of four
main stages (Spirtes, Glymour, Scheines, 2000). In
the first step the algorithm generates an undirected
graph using all variables, outcome and exploratory,
as vertices of the graph.
The goal of the second stage of algorithm is to
identify the conditional independence, using Bayes
Conditional, of the subset of adjacent vertices given
a significance level. During this phase, the edges
linking nodes conditionally independent are
removed. The outcome of this stage is the skeleton
of the graph.
To calculate the condition independence, the
significance level (alpha) for the individual
conditional independence tests used in this paper
was 0.05.
The third stage of PC consists in the creation of
the v-structure of graph, directing the edges
according to the causal effect identified by the
conditional independence.
In the fourth and last step of PC algorithm, it is
possible to orient the edges which still were not
directed sincedirections could not be inferred in the
prior steps.
The outcome of PC Algorithm is a completed
partially directed acyclic graph (CPDAG) that
describes the conditional independence information
in the data, in which every edge is either undirected
or directed.
Once that the estimated CPDAG represents the
equivalence class of DAG model describing the
causal structure, the outcome of the PC Algorithm
presents a relationship of causality between the
variables that compose the DAG (Kalisch et al.,
2012).
Applying Causal Inference in Educational Data Mining: A Pilot Study
457

3 RESULTS
At the beginning, the dataset had 75,948 instances
and 11 attributes from a sample of 229 students.
Each instance meaning an action realized by one
student, so, in average, were performed 331.65
actions per student.
After the stage of pre-processing, the number of
instances was reduced to 229 (number of students)
and the number of attributes increased to 42, one
representing the student’s identification and others
41 representing the actions that the students
performed at Moodle.
After organizing the dataset, we applied
statistical methods to analyze each attribute and the
behavior of the students related to the action
represented by the variable.
As a result of this analysis, it was discovered that
some attributes did not have meaningful variation on
the final result of the students. Another important
point identified was that some attributes had a great
number of missing values. These two issues lead us
to discarding those attributes.
Therefore, the final dataset used had 229
instances and 20 attributes. And from the sample of
students, 135 were successful and 94 failed on the
course, this means that 41% of the students did not
succeed to be approved.
From Table 1 it is possible to observe that the
actions most performed by the students are “course
view”, “assign view” and “quiz view”. Besides,
from Table 1, is also possible to observe the big
standard deviation of those attributes.
Table 1: Access mean and standard deviation for each
action performed by the 229 students at Moodle during 20
weeks.
Action
Mean
Standard
Deviation
assign submit
6.3
3.88
assign submit for grading
3.9
2.38
assign view
58.5
44.72
assign view all
1.0
2.24
assign view feedback
0.4
1.14
assign view submit assignment
form
8.4
5.05
chat report
0.2
1.70
chat talk
0.1
0.69
chat view
0.4
1.15
chat view all
0.1
0.50
course view
127.4
98.18
forum view forum
1.7
3.99
page view
24.8
24.90
quiz attempt
10.6
4.56
quiz close attempt
10.4
4.63
quiz continue attempt
14.8
7.82
quiz review
4.6
7.38
quiz view
35.9
21.17
quiz view summary
12.0
5.69
url view
6.8
9.53
Grade
56.9
29.22
Figure 3 presents the DAG generated by the PC
Algorithm using the reduced dataset. From the
Bayesian Network presented in Figure 3 it is also
possible to observe that “quiz attempt”, “assign view
submit assignment form” and “assign view” all has
relation with grade once they are parents of grade.
From table 2 it is observed that the variable “assign
view all” has a weak coefficient of correlation with
the attribute Grade and the others have moderate to
high correlation.
Table 2: Matrix of correlation among four attributes
emphasized by the DAG with significantly relationship of
causality with the attribute Grade.
assign
submit
assign
submit
for
grading
assign
view
assign
view
all
assign submit
for grading
0.82
1.0
assign view
0.66
0.59
1.0
assign view
all
0.18
0.17
0.11
1.0
assign view
submit
assignment
form
0.86
0.76
0.65
0.23
quiz close
attempt
0.72
0.66
0.60
0.05
Grade
0.77
0.74
0.61
0.12
4 CONCLUSIONS
Regarding to the main goal of this article that were
to discovery the root cause of success or failure of a
CSEDU 2018 - 10th International Conference on Computer Supported Education
458
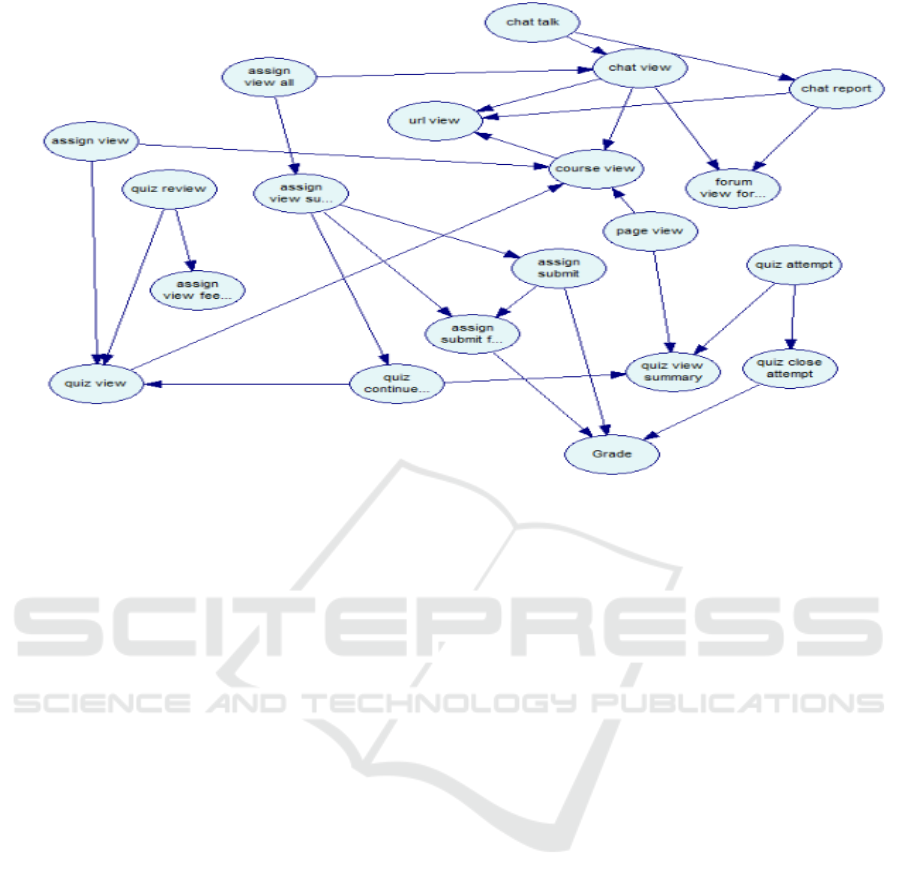
Figure 3: Variables with causal relationship direct with the outcome grade. Three actions represent the success or failure of
the students: quiz close attempt, assign submit and assign submit for grading.
student in an online course, it was possible to
conclude that the three variables/actions that have
more effect on the final grade were quiz close
attempt, assign submit and assign submit for
grading.
From the description of these attributes on Box
1, it can be deduced that students that, before
submitting an activity to be evaluated, starts the
assignment without sending it to be assessed, get
more chances to succeed in the final of the course.
Therefore, it is reasonable to conclude that students
that start doing an assignment earlier and reflect on
the task get more chances to be approved on a
course.
The third attribute, quiz close attempt, that
cause the performance of the student according to
this analysis is also related to the attempt of the
student before sending his final assignment to be
assessed.
It is important to highlight that regardless of
being the most performed tasks, course view, assign
view and quiz view are not cause of the performance
of the students.
Crossing the results of the Bayesian Network,
figure 3, and the correlation Matrix, table 2, it is
possible to observe that despite the weak correlation
between the attributes grade and assign view all, the
latter is a cause of the former.
Causal Inference and Educational Data Mining
are two areas of Computer Science that are growing
in interest for the last years. Combined, these two
subjects can help solving problems in the process of
teaching and learning such as improving the
performance and the capacity of learning of the
students, identifying the most efficient
methodologies of teaching and others.
In spite of some obvious results of this paper
such as the act of submitting an assignment become
a cause of performance, due to the nature of position
paper that has in its description that it is not
necessary to be a completed research and
considering the relevance and the novelty of the
Causal Inference, we believe that this paper has
much to contribute on 10
th
International Conference
On Computer Supported Education.
As future work, we recommend interventions
and simulations on the model to analyses the degree
of causality of each variable on the performance of
students. In other words, once this paper limited to
the left side of figure 1, it worth to explore the right
site of the bilingual model introduced by Pearl
(2009).
REFERENCES
Baker, R.S.J.d., Isotani, S., de Carvalho, A., 2011.
Mineração de Dados Educacionais: Oportunidades
para o Brasil. Revista Brasileira de Informática na
Educação, 19 (2), 3-13.
Applying Causal Inference in Educational Data Mining: A Pilot Study
459

Kalisch, M., Maechler, M., Colombo, D., Marloes, H.,
Maathuis, P.B., 2012. Causal Inference Using
Graphical Models with the R Package pcalg. Journal
of Statistical Software, 47(11), 1-26.
Pearl, J., 2009a.Causality: Models, Reasoning, and
Inference. Cambridge University Press, New York, 2
nd
edition.
Pearl, J., 2009b. Causal inference in statistics: An
overview. Statist. Surv., 96-146. doi:10.1214/09-
SS057.
https://projecteuclid.org/euclid.ssu/1255440554
Pearl, J., Eight Pillars of Causal Wisdom. Youtube, April
2017, Avaliable in https://www.youtube.com/
watch?v=8nHVUFqI0zk . Acesso em: 04 dec. 17.
Romero, C., Ventura, S., 2010. Educational data mining: a
review of the state of the art. IEEE Transactions on
systems, man, and cybernetics, part C: applications
and reviews, 40(6), 601–618.
Romero, C., Ventura, S., Pechenizkiy, M., Ryan, S. J. D.
(Eds), 2011. Handbook of educational data mining and
knowledge discovery series. Chapman & Hall/CRC,
Florida.
Spirtes, P., Glymour, C., Scheines, R., 2000. Causation,
Prediction, and Search. Adaptive Computation and
Machine Learning, 2nd edition. MIT Press,
Cambridge.
CSEDU 2018 - 10th International Conference on Computer Supported Education
460
