
Impact of LMS Selection on Students’ Activity
Students’ Activity Evaluation Problems in Moodle and Open edX Learning
Management Systems
Viktors Zagorskis and Atis Kapenieks
Distance Education Study Centre, Riga Technical University, Kronvalda 1, Riga, Latvia
Keywords:
LMS, MOODLE, Open edX, UX.
Abstract:
The quality of youth education, in general, is worsening (Coppola and O’Higgins, 2015). Some of the reasons
for such a statement are (i) the current changes of educational systems in general, (ii) eventually unreasonable
switching between ephemeral learning trends and tools. Despite the use of learning management systems,
learners or educators, face today a real and increasing difficulty in finding optimal communication for the
learning coalition between the students and the teachers. In this research, students’ activity in two popular
learning management systems (LMS): MOODLE and Open edX are analyzed. We examine both platforms by
measuring and comparing the students’ activity from the learning-time aspect. The novel – CAST algorithm
is proposed to reduce the overestimated learners’ activity measuring errors, caused by unterminated WEB
sessions. We conclude that Open edX engage students more, therefore, educational institutions should move
forward to modern eLearning platforms.
1 INTRODUCTION
Today, in the era of global networking the interaction
between students and instructors is organized mostly
in a blended form - in class and through eLearning
systems (LMS).
Organizational aspects of teaching have effects on
learners. Strategies that require students to be acti-
vely engaged with the learning material produce bet-
ter long-term retention than the passive act of reading
(TULVING and Craik, 2000), (Benjamin, 2011). Si-
multaneously, there is need for some difficulties in le-
arning (Bjork, 1994).
The educational institution is responsible for in-
vention and support of learning strategies – inclu-
ding blended learning, class organizational approa-
ches, and platform(s) for e–learning.
At Riga Technical University (RTU), Moodle
LMS (Romero et al., 2008) since the year 2007, is
recommended for application in hundreds of lear-
ning courses. The Distance Education Study Cen-
tre (DESC) is responsible for the supervision of the
subject ”Basic Business”. Every academic year from
2013 to 2017, this course was conducted for more
than one hundred first–year students. More than 600
learners in the five year period were addressed.
Thanks to the DESC staff qualification, new hori-
zons for education using modern communication de-
vices together with multi-screen learning technolo-
gies (Kapenieks, 2013) were presented. At the mo-
ment Open edX is the primary open source appli-
cation to support MOOCs (Massively Open Online
Courses) (Pijeira D
´
ıaz et al., 2016). The commu-
nity using Open edX is growing. During the last two
academic years (2016, 2017) the subject ”Basic Busi-
ness” was reconstructed and is maintained entirely on
Open edX LMS.
Learning, in general, is a stochastic process to-
ward the learning goals. Some theories (Mosteller,
1958) for decades are used to model such proces-
ses. Among the authors, Bartholomew’s work on sto-
chastic processes provides the theoretical foundation
for stochastic models of learning (Ifenthaler and Seel,
2012).
In spite of guided training in blended learning
(Seel, 2012), controlling the students’ diversion of at-
tention from the learning content is still problematic.
Also, impact of random, hidden factors decreases by
attractive and personable learning content (Cornelius-
White and Motschnig, 2012).
Today, in modern massive online LMSs like
UDEMY, UDACITY, COURSERA, EDX, etc. stu-
dents are often engaged using intuitive, user expe-
rience (UX) oriented navigation, short text or video-
Zagorskis, V. and Kapenieks, A.
Impact of LMS Selection on Students’ Activity.
DOI: 10.5220/0006810205050512
In Proceedings of the 10th International Conference on Computer Supported Education (CSEDU 2018), pages 505-512
ISBN: 978-989-758-291-2
Copyright
c
2019 by SCITEPRESS – Science and Technology Publications, Lda. All rights reserved
505

based learning content (Cennamo, 2012) (Maniar,
2012), gaming based (Seel, 2012) learning contents,
as well as regular following the obtained scores.
Among others, the earned scoring observation is good
motivation factor to learn.
In blended learning, such an approach motivates
students to use eLearning tools more, although it can
lead to mental overload of the learner. Interaction
with an increasing number of networked devices, ap-
plications, and web services; learner attention is the
new bottleneck in computing (Okoshi et al., 2015) and
the learning domain too.
Since the knowledge items in MOODLE and
Open edX are for sure presented technically diffe-
rently (styles, forms, the interface of access, etc.), we
realize that objective comparing of systems is a tough
problem. Although, we are motivated to know more
about user behavior difference in various LMS.
Our goal of this research is to explore the impact
of switching from Moodle to Open edX on students’
activity, keeping the learning content (number of to-
pics, problems, assignments, and assessments) un-
changed. To achieve that, we study and analyze data
retrieved from both LMS by:
1. mapping students’ activity to the learning-time,
2. applying of approximation algorithm that reduces
learning-time overestimation problems,
3. comparing user behavior in both LMS using ex-
ploratory analysis.
The paper is organized as follows: Section 2 intro-
duces the data acquisition principles, tools, formats,
and limitations. Research models, methods, and pro-
posed algorithms are classified in Section 3. Section
4, which is the core section of this paper, provides an
analysis of results of learner activity computation.
Finally, Section 5 offers the conclusions of the re-
search.
2 DATA GATHERING
We start with decision-making regarding the appro-
priate strategies, tools and methods for learners data
gathering and analysis based on application domain.
2.1 Application Domain
Since 2000, the data mining paradigm has been often
used. As stated (Kumar and Reinartz, 2006), ”data
mining provides businesses with the ability to make
knowledge-driven strategic business decisions”. In
our case, the business-application domain is ”Blended
Learning” (in class/self paced). The business decision
is about the selection of a more efficient e-learning
system from two available for experiment: Moddle
and Open edX. We also take into account the corre-
spondence of tools to automate some steps in the data
science process in the future.
2.2 Data Source Domain
Data, used for students’ activity evaluation was mined
from MOODLE, and Open edX log files. In our rese-
arch experiment, we used two consecutive hold cour-
ses (years 2015 and 2016). Courses were organized
in the period from 1 of September till 31 of Decem-
ber. LMS allowed access to the contents all day long
(24/7). Therefore, total course contents’ access time
(Course Period) physically was 2929 hours.
Each course had the same amount - 126 learning
objects. On average, course staff expect that students
could spend no more than five minutes attention to
each learning object observing it only once. So, the
time needed for students just to log into LMS, to stay
logged in, and introduce themselves to all the items is
about (126 items * 5 minutes = 10.5 hours) per whole
course contents. Here, we assume that each student
pay attention to all the objects – but only once. No-
tably that 10.5 hours of learner activity in the LMS
is the minimal expected value and is equal to 0.36 %
from the whole Course Period. In reality, we argue
that each learning object author expects that attention
to his/her creative work will be given more than once.
The number of students in Moodle was 114, whe-
reas 148 in Open edX. Moodle course students pro-
duced 22775 logged activity records versus 70175 in
Open edX (see Table 1).
Table 1: Data amount and producers.
Description Moodle Open edX
Course Period [hours] 2929 2929
Technical Length [hours] 10.5 10.5
Learning Objects 126 126
Number of Students 114 148
Logged Records 22775 70175
Since experimental courses, we are analyzing,
were organized using Blended Learning strategy, the
most time - 32 hours learners spent in the class. Here,
we had no ability to measure individual time used for
individual learning without LMS usage.
2.3 Data Source Model
LMS logged data follows the Time Series data source
concept. In general, Time Series analysis comprises
two methods: (1) to extract meaningful statistics of
CSEDU 2018 - 10th International Conference on Computer Supported Education
506

the data, (2) to forecast future values based on previ-
ously observed values. As modern direction in Time
Series studies is deep neural networks. Although,
such an approach is computational resource consu-
ming.
In this paper we study Time Series data using sta-
tistics based technique: data exploratory analysis and
visualization.
2.4 Data Analysis Tools
After LMS examination, we identify - the learners’
data is stored in ASCII type log files with access on
demand. Files’ sizes are a couple of ten megabytes in
compressed form. In this case, as a tool for data acqui-
sition, cleansing, presentation, and modelling we use
R programming language (Wickham and Grolemund,
2016).
2.5 Data Formats
In this subsection, we shortly introduce data formats
and their differences between Moodle and Open edX
before approximation algorithm is applied.
Logged Data from the LMS files are used. The
plain log files are keeping records, previously confi-
gured by LMS developers that were guided by archi-
tecture documentation.
We handle plain files that keep learners’ data logs.
The key features of Logged Data File formats for
either LMS are:
• Each record line corresponds to one logged acti-
vity produced by a learner or a staff member or a
system.
• Logged Data records for Open edX are stored in
JSON (JavaScript Object Notation) format files,
Each logged event is recorded as a new JSON list
object.
• Logged Data, generated by Moodle is structured
by the record position in a text line. Each logged
event is recorded as a new text line.
2.6 Pre-processing Data
Data, generated and recorded by the personnel, or
course staff, or system are to be dropped in the cle-
ansing process. To do that, we apply different data
acquisition techniques to the raw data. Processing
methods, borrowed from R programming language
documentation and best practices (Zumel and Mount,
2014) used to separate records and present them in a
one-dimensional vector form.
The data acquisition process begins similarly in
both LMS. Here, the single raw Logged Data File
record line is scanned, transformed, and represented
as ”moodle data” or ”edx data” into character type
vectors using R function scan.
Each (moodle data or edx data) vector element
consists of various character groups and LMS specific
separators. Pre-processing routines allows to trans-
form data to data tables suitable for further analysis.
Here, we show the example of a Computer Pro-
gram code in R that scans data and process into table:
moodle_data <- preprocess(scan(moodle_file))
edx_data <- preprocess(scan(edx_file))
As a result of pre-processing, we get clean data in
table format.
2.7 Data Structure
Moodle and Open edX have different data structures.
In our experiment we identified that Moodle LMS has
only 6 data categories, whereas Open edX has an ex-
tended structure consisting of 10 categories. Some
Open edX categories have ”context” consisting of 7
subcategories. Obviously, Open edX wins by the
amount of data logged.
2.8 Data Precision
Example formats of time stamps for both LMSs are
given in the following code lines:
Moodle: 2017,January,23,07:21
Open edX: 2017-01-23T07:21:17.048129
The significant potential of Open edX is revealed
through more precise event time stamp logs in a com-
paring with Moodle. Here, we find that Open edX is
better not only in the case functional analysis of lear-
ners’ interaction style with video-based content, but
also is ready for more precise methods’ invention.
2.9 Summary
Comparing of Data structures from both LMS we
conclude:
• Open edX has more distinct log record categories
out of the box: 16 vs. 6 for Moodle,
• the data format used in Open edX is JSON, which
makes further data searching, separation, and ana-
lysis more efficient due to simple coding.
• time events logging precision for Open edX has a
resolution expressed in microseconds.
• logging of interactions with video content has no-
table intelligence, allowing to provide further spe-
cialized user behavior analysis.
Impact of LMS Selection on Students’ Activity
507
3 TOWARDS LEARNER
ACTIVITY MODEL
In this section we describe the data gathering work-
flow along with the developed algorithm that help
us to verify the positive impact of switching from
Moodle to Open edX on learners activity.
Firstly, using raw Logged Data Files from both sy-
stems, we apply some methods to obtain, clean, and
transform learners’ activity information from Time
Series into similarly structured (data frames). Next,
we apply in Section 3.2 proposed CAST algorithm to
pre-processed data. The output of the algorithm ope-
ration is a new data set EDS (Estimated Data Set).
The EDS set is exploratory ready and contains our es-
timations. EDS has data that takes into account user
behaviour uncertainties that in WEB environment can
not be explicitly identified. More precise, we are mo-
delling user activity interruption without the identify
of WEB session end. So, computed EDS contains a
number of estimated activity paths for each student.
Then, we apply some visual data exploring methods
to obtain scatter plots and histograms from EDS data.
Finally, we evaluate statistical differences between
users’ sessions in Moodle and Open edX.
Although, the trivial learner activity model - using
WEB sessions’ beginning and ending records, seems
to be applicable, this assumption can lead to the seri-
ous model errors. Overestimation is the main reason.
3.1 Overestimation Problem
By observing students working at the computer in
class, we conclude, that after opening the session to
LMS, learners often – after a couple of minutes, turn
their thoughts to other life events. Therefore, stu-
dents, as stated (Okoshi et al., 2015), reduce cumu-
lative, learning content oriented attention due to some
uncontrollable reasons.
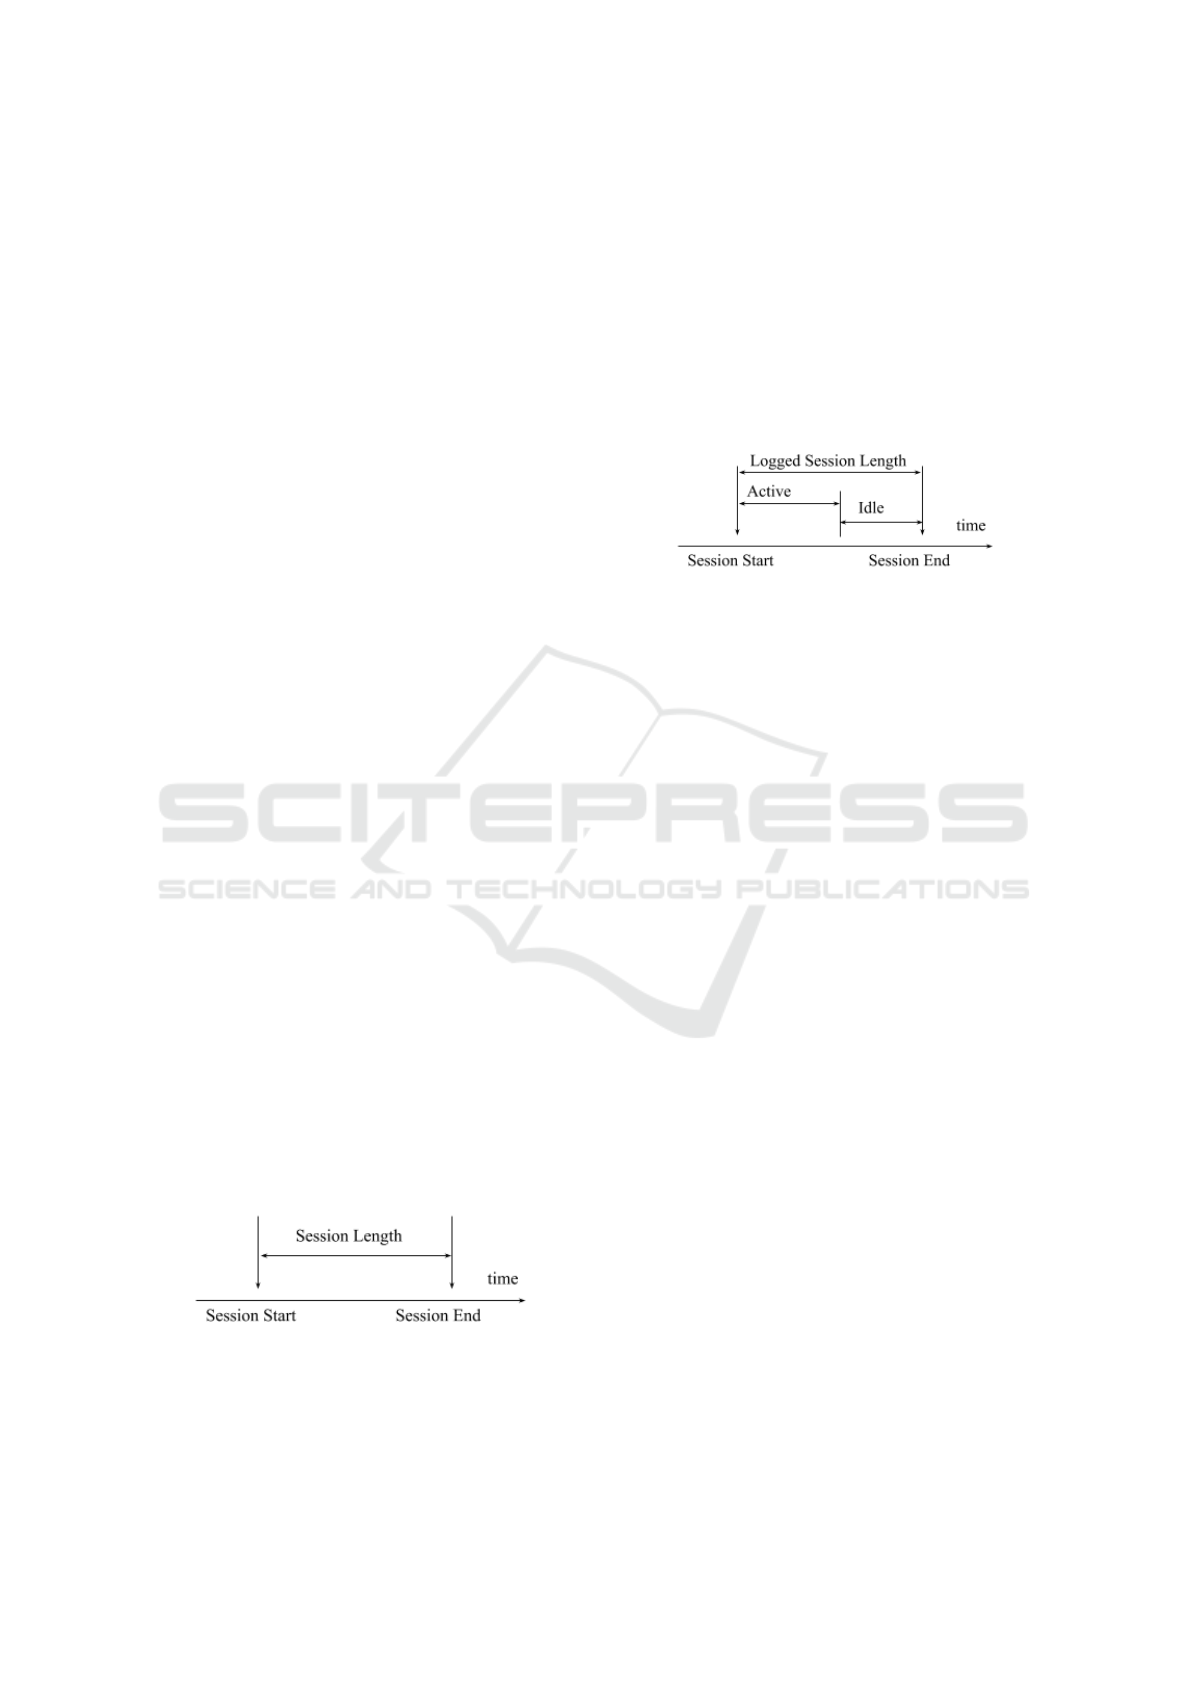
By simple approach, students’ online activity time
spent in the LMS can be measured using uncomplica-
ted session time-delta computation (Figure 1).
Figure 1: Log record based session length computation.
If all the time that students are sitting in the front
of the computer we are taking into account, learners
activity becomes overestimated. In addition, we attri-
bute distracted user behavior to learning apart of the
group.
Therefore, we assume that straight reflecting of
online web session length, computed by identification
of session start-stop logged facts is misleading. The
main argument is learner distraction observed in class,
also mentioned in the previous paragraphs (Okoshi
et al., 2015).
In the following example, the session is split into
Active and Idle parts (Figure 2).
Figure 2: Session reduction due to learner distraction.
The given figure reflects the simplest possible
case. In reality, different idle part patterns can be wit-
nessed: (a) student behavior patterns, and (b) techni-
cal issues, like connection lost, battery downtime, etc.
To avoid students’ activity time overestimation
preparing data for analysis, we introduce a novel al-
gorithm, named CAST.
3.2 Introduction to CAST Algorithm
We propose the CAST algorithm that computes Cu-
mulative Activity and Session Time approximation
for the eLearning environment. In the case of unter-
minated WEB sessions (Sikos, 2011) the CAST algo-
rithm is suitable for estimating the learners’ activity.
The main idea of CAST estimation algorithm is
looping through all students’ records creating indivi-
dual learner activity profile (see Algorithm1).
The CAST algorithm ignores possible ’Session
End’ records. The session length for the investigated
learner is computed using an invented vector with the
fake ’Session End’ values. The algorithm counts the
learner sessions and marks sessions in output table as
terminated based on user activity in the system.
The CAST algorithm has two Input groups of pa-
rameters. The algorithm analyses already cleansed
LMS Log Data, that is the first group for the Input
data (see Figure 3). The second data component is
the artificially created Maximum Session Length vec-
tor (MSL). MSL vector has numeric values can be va-
ried by the algorithm operator to cover the full range
of approximated learner activity model in the LMS.
The Out put of The CAST algorithm is the Estima-
ted Data Set (EDS), consisting of two data frames H
and G. The H data frame is the output of first CAST
CSEDU 2018 - 10th International Conference on Computer Supported Education
508

Figure 3: CAST Algorithm Inputs and Output.
algorithm method A. The intermediate result of met-
hod A computes the set of approximated data for each
user individually. The G data frame is produced by
second - sequentially executed method B that avera-
ges data for the whole learners’ group. The G data
frame stores nine data vectors that summaries lear-
ners’ group activity in the LMS through (a) number
of counted activity periods - named sessions, and (b)
cumulative activity time over the whole course period.
Table 2 shows G data frame column names. Here, we
use following notation: CATH stands for ”Cumulative
Activity Time, expressed in Hours”.
Table 2: G data frame column names.
Name Description
MSL maximum session length
CSA
min
min of counted sessions
CSA
max
max of counted sessions
CSA
mean
counted sessions mean
CSA
median
counted sessions median
CAT H
min
min cumulative activity time
CAT H
max
max cumulative activity time
CAT H
mean
cumulative activity time mean
CAT H
median
cumulative activity time median
Either LMS (Moodle or Open edX) has it’s own
EDS data set on output.
The newly computed EDS subsets (H and G)
helps to reveal the most reliable session length by ap-
plying some general statistical analysis methods, dis-
cussed in the next Section 4.
3.3 CAST Algorithm Description
We assume that learners produce the principal amount
of logged events by simply clicking the mouse on
the different computer or mobile device screen area.
LMS stores event logs. CAST algorithm use these
events later in EDS data computation.
Firstly, for CAST operation we create the MSL
vector with Maximum Session Length parameters. As
a trade-off, to safe computation time and get visually
figured out data, we use steps of 5 minutes. In practice
we use the range between 5 and 40 minutes storing
these values in the R ”vector” MSL:
MSL <- c(5, 10, 15, 20, 25, 30, 35, 40)
Next, we load the chosen LMS Log Data into the R
”dataframe”, namely the CourseData. Now, we de-
fine the course time boundaries: StartDate, EndDate,
and compute the Course Technical Length (CT L) as
the difference between the course start and course end
dates. After computation, we get the course length
equal to 2929 hours.
Now, we identify records for time-series events’
study. Finally, we create two vectors with 114
(Moodle) or 148 (Open edX) unique learners’ (user)
names (see Table 1).
The first method A(M, S, E) of CAST algorithm
(Algorithm1) needs three input parameters to operate.
The first - M have to be created by the operator of the
algorithm. The S (list with unique students’ names)
and E (logged activity events) are prepared from log-
ged data.
Algorithm 1: CAST algorithm.
Method:
Input: S : the set with unique students’ names
E : the set of logged events’ time-series
M : the MSL vector M = {5, 10, . . . , 40}
Output: H : set of individual approximated data
/* Step 1. compute estimated data for all users*/
1: for all m ∈ M do
2: for all s ∈ S do
3: cat ← 0 cumulative activity time
4: k ← 0 activity periods’ counter
5: τ ← 0 present period length
6: for all e ∈ E do
7: t ← Di f f (E
n
− E
n−1
)
8: if t < m then
9: τ ← τ + t
10: else
11: τ ← 0
12: k ← k + 1 count the session
13: end if
14: cat ← cat + τ add to total time
15: end for
16: H[s] ← s[cat][k] estimated cat and k
17: end for
18: H[s][m] ← m store data at given MSL
19: end for
20: return H
Method: B(H)
Input: H : the set of individual estimations
Output: G : the summary on group of learners
/* Step 2. compute summary/average estimators */
21: G[s][summary] ← S ummary(H) like min, max
22: G[s][average] ← Average(H) mean, median
23: return G
Impact of LMS Selection on Students’ Activity
509
Applying the first method A, the CAST algorithm
computes estimated activity data for all users in the
list S by the given M vector value.
The outcome of the A method is a data frame
H[s][m], containing estimated data [s] for each student
in the S list at the given M set value. The [s] data con-
sist of two subsets: cumulative activity time cat, and
counted activity periods k (line: 16).
The key of the algorithm is the inner loop (lines:
6 to 15). By iterate all recorded events, algorithm me-
asures the time difference (inter-event-time) between
logged activities (line: 7). If a current time difference
between nearby events is less than the suggested MSL
value, we assume that a student is still active. We
increase student’s present-active time period by the
value of the time difference measured from the pre-
vious event (line: 9). If a student has not renewed
his activity for more then given MSL value, we count
student’s session as terminated (line:12) and reset pre-
sent activity time, making ready for usage in the next
session.
After the application of all student specific re-
cords, taken from the logged events, the student’s
approximated activity expressed through cumulative
operation time measured in hours (CATH) and ap-
proximated number of activity periods (or sessions)
is stored in output data set H (line: 16).
Looping through the MSL values let us to store
all the users’ behaviour profiles as a function of MSL
(line:18).
By applying of B method to the H data, we get sta-
tistical summary G data set that helps us to compare
Moodle and OpenedX LMS.
4 DISCUSSION OF THE RESULTS
In this section the EDS data is presented through the
visualization of H data subset using statistical evalu-
ations, and as scatter plots, revealing G data subset.
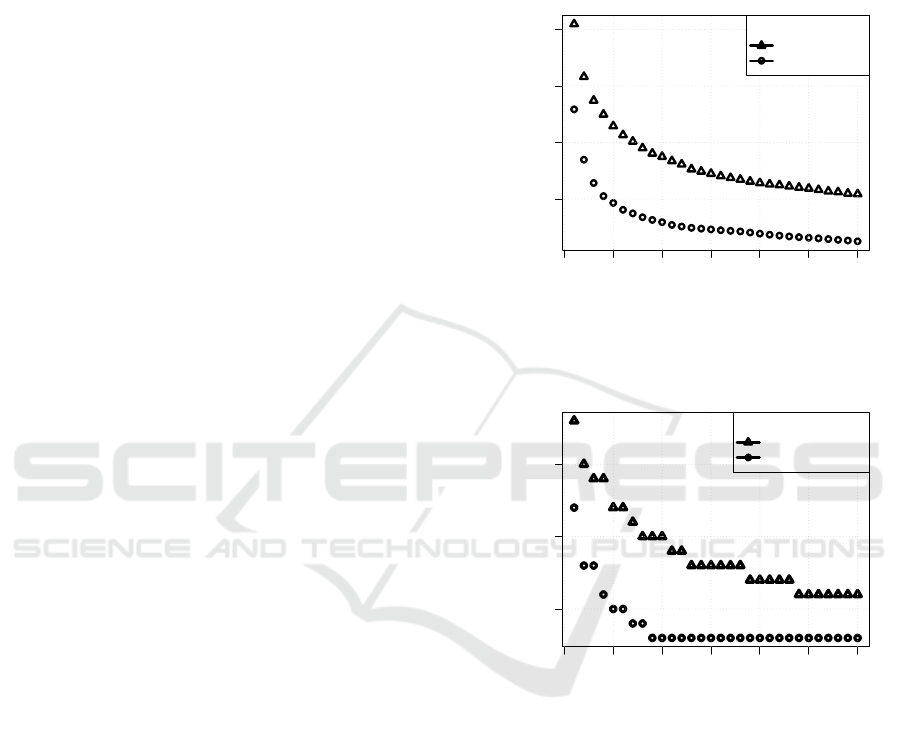
4.1 Sessions’ Count
The plot visually depicts G subset as ”mean” of the
number of counted sessions of the whole course ver-
sus the modeled MSL value (Figure 4). Here, we
assume that the expectation about the errors is sym-
metric. The ”median” of data is also used later as a
consistent estimator and is less sensitive to extreme
observations (DeGroot and Schervish, 2013).
From Figure 4, we can identify that Open edX is
used more. The numeric difference is computed from
G data subset and is (in average) per five sessions
more in the comparison to Moodle LMS.
We use median estimator in Figure 5 for explo-
ring the experiment data under the assumption of the
existence of extreme data observations. Here, we in-
tuitively find by the median estimator depicted time
boundary of Moodle usage - no more than 20 minutes
on average.
0 10 20 30 40 50 60
15 20 25 30
Maximal Session Length (MSL) [min]
Counted Sessions (by CAST)
MEAN values:
edX
MOODLE
Figure 4: Mean value of counted sessions (from subset G)
as a function of a modeled MSL value.
0 10 20 30 40 50 60
10 15 20
Maximal Session Length (MSL) [min]
Sessions Counted by CAST
MEDIAN values:
edX
MOODLE
Figure 5: Median value of counted sessions (from subset G)
as a function of a modeled MSL value.
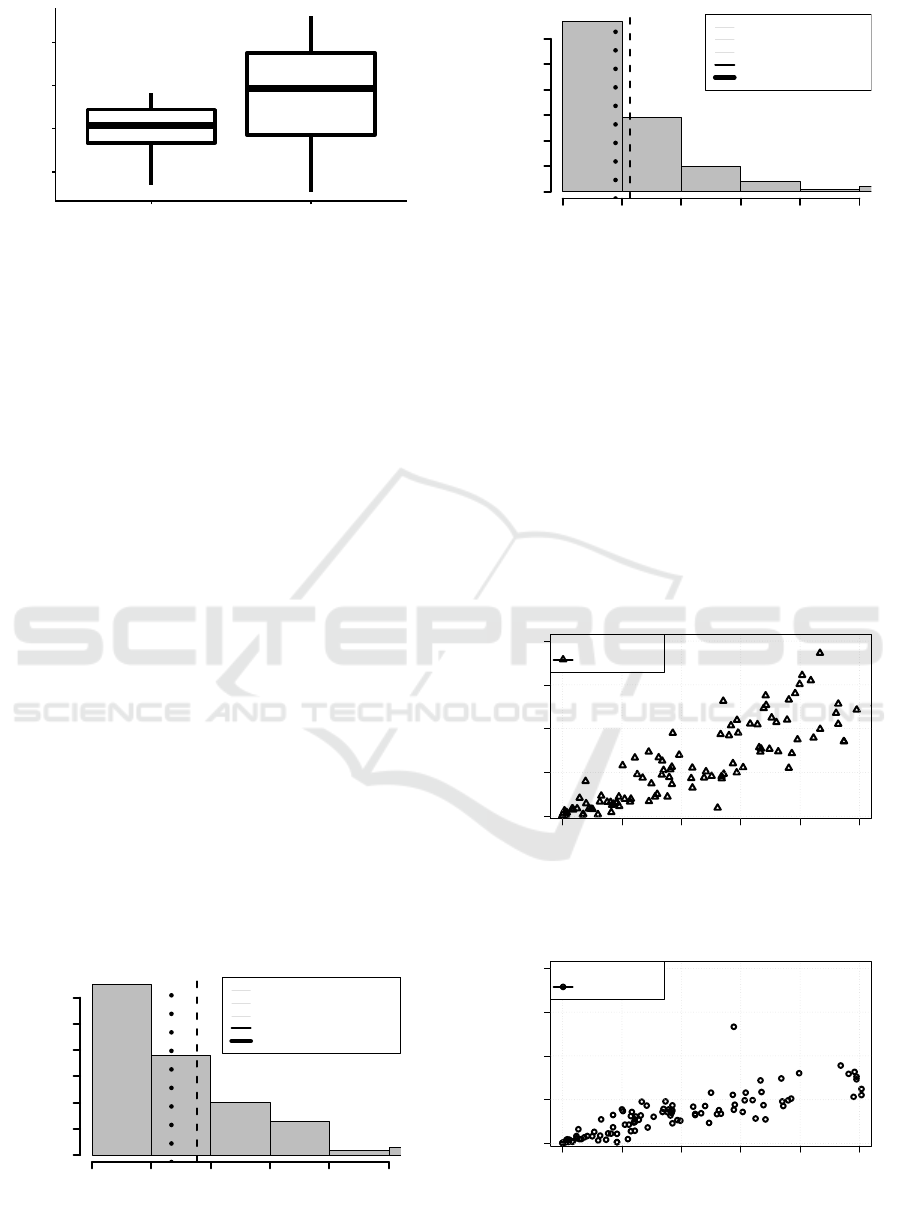
4.2 Comparing the Means
We compare two independent data groups: Moodle
and Open edX. For comparison of means of G data
subset (Table 2, column CAT H
mean
), we visualize
vector data using box plots (Figure 6), and are going
to use parametric unpaired two samples T-test to get
statistical evidence on the difference of data.
From the output (Open edX p-value = 0.2542, and
Moodle p-value = 0.4058), the two p-values are gre-
ater than the significance level 0.05 implying that the
distribution of the data are not significantly different
from the normal distribution. Here, we can assume
CSEDU 2018 - 10th International Conference on Computer Supported Education
510
1
2
3
4
Moodle Open edX
Cumulative Activity Time [hours]
Figure 6: CAT H - Cumulative Activity Time [hours] repre-
sented as second and third quartiles of both LMS.
the normality. Do the both CATH
mean
data sets have
the same variances? We use F-test to examine for
equality in data variances. The result is p-value =
7.839e-05. This result lead us to decline t-test met-
hod to compare data sets.
As an alternative, we use Wilcoxon rank sum test
for testing the equality of two distributions. We have
following results. We can conclude that CAT H
median
of Moodle LMS is significantly different from Open
edX CAT H
median
with a p-value = 0.006051.
We also test, whether CATH(Moodle) is less than
the median CATH(Open edX). The result is: Open
edX CAT H
median
is greater than Moodle CAT H
median
.
The visual observation of the box-plot (Figure 6)
also clearly show: (1) the significant difference bet-
ween CAT H data of Moodle and Open edX, and (2)
notable inequality in data variances.
4.3 Comparing Distributions
Two following figures (Figure 7 and Figure 8) give the
simple insight into the statistical data difference bet-
ween the Moodle and Open edX data using the histo-
grams of the CATH – Cumulative Activity Time ex-
pressed in Hours. The analysis shows that median and
mean average activity of users in Open edX is approx-
imately per 50 % better comparing to Moodle data.
Cumulative Activity Time per User [Hours]
Frequency
0 2 4 6 8 10
0 10 20 30 40 50 60
MSL < 40 min
MIN = 0
MAX = 29.2
MEAN = 3.5
MEDIAN = 2.7
Open edX, MSL < 40 [min]
MIN = 0
MAX = 29.2
MEAN = 3.5
MEDIAN = 2.7
Open edX, @MSL = 40 [min]
MIN = 0
MAX = 29.2
MEAN = 3.5
MEDIAN = 2.7
Figure 7: Open edX. CATH Histogram.
Cumulative Activity Time per User [Hours]
Frequency
0 2 4 6 8 10
0 10 20 30 40 50 60
Moodle, @MSL = 40 [min]
MIN = 0
MAX = 11.2
MEAN = 2.3
MEDIAN = 1.8
Figure 8: Moodle course. CATH Histogram.
4.4 Clicks and Activity Time
Figure 9 and Figure 10 depict how the number of
produced events (simply clicks) relates to estimated
Cumulative Activity Time of the learner. On canvas,
each point depicts one learner.
By comparing of both figures, we identify that
clicking and time that spent in the system, corre-
late. The correlation coefficients of produced logged
events and activity time periods are 0.8020837 (Open
edX), and 0.8931734 (Moodle). Since both values are
rather close to 1, we can conclude that the variables
are positively linearly related.
0 1 2 3 4 5
0 200 400 600 800
Cumulative Activity Time [hours]
Number of Clicks per User
MSL = 40 [min]
edX
Figure 9: Open edX. Number of Clicks produced by the
learner as a function of Cumulative Activity Time.
0 1 2 3 4 5
0 200 400 600 800
Cumulative Activity Time [hours]
Number of Clicks per User
MSL = 40 [min]
Moodle
Figure 10: Moodle. Number of Clicks produced by the le-
arner as a function of Cumulative Activity Time.
Impact of LMS Selection on Students’ Activity
511

5 CONCLUSIONS
In general, only the one specific LMS can be analy-
zed efficiently using the proposed CAST algorithm.
The wide range of uncontrollable factors (samples
from two different students’ groups, dissimilar in-
terfaces, etc.) significantly reduce the precision of
quantitative detected user behavior difference in both
LMS. Despite the impact of uncontrollable factors,
the CAST algorithm reduces the overestimation of the
learners’ activity.
After the application of the CAST algorithm to
LMS data, we expect to work further in the derivation
of the ”machine learning” models, useful for LMSs’
automation and dynamic adaptation to students’ and
teachers’ needs.
The trend to use Open edX more versus Moodle
can be easily verified by visual data analysis. This
lead to the categorical conclusion that students in the
Open edX environment in comparison with Moodle
LMS are more active.
Some other, not discussed in the paper benefits of
Open edX (as Python assessments coding or LaTeX
formulae writing options) implies more engaged stu-
dents, and better-trained employees in the future. This
is the strategic business decision.
ACKNOWLEDGEMENTS
This research has been supported by a grant from
the international European ERA-NET Project Futu-
rICT2.0 funded under the FLAG-ERA Joint Transna-
tional Call 2016.
REFERENCES
Benjamin, A. (2011). Successful Remembering and
Successful Forgetting: A Festschrift in Honor of Ro-
bert A. Bjork. Taylor & Francis.
Bjork, R. (1994). Memory and meta-memory considerati-
ons in the training of human beings.
Cennamo, K. S. (2012). Learning from Video, pages 1876–
1879. Springer US, Boston, MA.
Coppola, G. and O’Higgins, N. (2015). Youth and the Cri-
sis: Unemployment, Education and Health in Europe.
Routledge Studies in Labour Economics. Taylor &
Francis.
Cornelius-White, J. H. D. and Motschnig, R. (2012).
Person-Centered Learning, pages 2596–2599. Sprin-
ger US, Boston, MA.
DeGroot, M. and Schervish, M. (2013). Probability and
Statistics: Pearson New International Edition. Pear-
son Education Limited.
Ifenthaler, D. and Seel, N. M. (2012). Stochastic Models
of Learning, pages 3192–3194. Springer US, Boston,
MA.
Kapenieks, K. (2013). ebig3 system portal, available at:
http://ebig3.eu/v2/.
Kumar, V. and Reinartz, W. (2006). Customer relationship
management: a database approach. Wiley.
Maniar, N. J. (2012). Video-Based Learning, pages 3403–
3405. Springer US, Boston, MA.
Mosteller, F. (1958). Stochastic models for the learning pro-
cess. Proceedings of the American Philosophical So-
ciety, 102(1):53–59.
Okoshi, T., Ramos, J., Nozaki, H., Nakazawa, J., Dey,
A. K., and Tokuda, H. (2015). Reducing users’ per-
ceived mental effort due to interruptive notifications
in multi-device mobile environments. In Proceedings
of the 2015 ACM International Joint Conference on
Pervasive and Ubiquitous Computing, UbiComp ’15,
pages 475–486, New York, NY, USA. ACM.
Pijeira D
´
ıaz, H. J., Santofimia Ruiz, J., Ruip
´
erez-Valiente,
J. A., Mu
˜
noz Merino, P. J., and Delgado Kloos, C.
(2016). A demonstration of analyse: A learning ana-
lytics tool for open edx. In Proceedings of the Third
(2016) ACM Conference on Learning @ Scale, L@S
’16, pages 329–330, New York, NY, USA. ACM.
Romero, C., Ventura, S., and Garc
´
ıa, E. (2008). Data mi-
ning in course management systems: Moodle case
study and tutorial. Comput. Educ., 51(1):368–384.
Seel, N. M., editor (2012). Blended Online Learning, pages
465–465. Springer US, Boston, MA.
Sikos, L. (2011). Web Standards: Mastering HTML5, CSS3,
and XML. Apressus Series. Apress.
TULVING, E. and Craik, F. (2000). The Oxford Handbook
of Memory. Oxford Library of Psychology Series. Ox-
ford University Press.
Wickham, H. and Grolemund, G. (2016). R for Data
Science: Import, Tidy, Transform, Visualize, and Mo-
del Data. O’Reilly Media.
Zumel, N. and Mount, J. (2014). Practical Data Science
with R. Manning Publications Company.
CSEDU 2018 - 10th International Conference on Computer Supported Education
512
