
Applying Deep Learning Techniques to CAN Bus Attacks for Supporting
Identification and Analysis Tasks
Alfredo Cuzzocrea
1
, Fabio Martinelli
2
and Francesco Mercaldo
2
1
University of Trieste & ICAR-CNR, Trieste, Italy
2
Institute for Informatics and Telematics, National Research Council of Italy (CNR), Pisa, Italy
Keywords:
Automotive, CAN, OBD, Deep Learning, Security, Testing.
Abstract:
Cars are no longer only mechanical vehicles. As a matter of fact, they contain an ecosystem of several elec-
tronic units able to exchange data using the serial communication provided by the CAN bus. CAN packets are
broadcasted to all components and it is in charge of the single component to decide whether it is the receiver of
the packets, in addition the protocol does not provide source identification of authentication: these are the rea-
sons why the CAN bus is exposed to attacks. In this paper we design a method to identify CAN bus targeting
attacks. The proposed method takes into account deep learning algorithms i.e., the Neural Network and the
MultiLayer Perception. We evaluated our method using CAN messages gathered from a real vehicle injecting
four different attacks (i.e. dos, fuzzy, gear and rpm), obtaining encouraging results in attacks identification.
1 INTRODUCTION AND
BACKGROUND
CAN is a high-integrity serial data communication
technology developed in the early 1980s by Robert
Bosch GmbH
1
. The Engine Control Modules (i.e.,
ECUs) communicate with one another by sending
packets. These kinds of packets are broadcast to all
components on the bus and each component decides
whether it is intended for them, although segmented
CAN networks do exist (Martinelli et al., 2018; Kwak
et al., 2016; Martinelli et al., 2017; Bernardi et al.,
2018). In CAN packets there is not built-in source
identified or authentication: it is easy for components
to both sniff the CAN network as well as masquerade
as other ECUs and send CAN packets.
Drivers and passengers are strictly at the mercy
of the code running in their automobiles and, un-
like when their web browser crashes or is compro-
mised, the threat to their physical well-being is real
(Al-Kahtani, 2012; Samara et al., 2010), this is the
reason why there in an increasing interest in the auto-
motive security topic.
Considering that several deep learning approaches
have been proposed with the aim to model human be-
havior (Baccouche et al., 2011; Ding et al., 2018),in
this paper we apply deep learning algorithms in order
1
www.can.bosch.com
to discriminate between normal CAN messages (i.e.,
generated by the human driver) and injected ones (i.e.
messages generated by attacker).
The paper poses the following research questions:
• RQ1: is it possible to identify a single-attack us-
ing CAN packets as a feature vector with deep
learning techniques?
• RQ2: is it possible to perform multi-attack iden-
tification using CAN packets as a feature vector
with deep learning techniques?
The rest of the paper is organized as follows: the fol-
lowing section illustrates the proposed features and
the designed detection technique; the third section
presents the results of the evaluation, and, finally, con-
clusion and future work are given in the last section.
2 ATTACK IDENTIFICATION
OVER CAN PACKETS
In this Section we describe the method we propose for
car attacks identification targeting CAN bus.
The CAN packets are contained in a message:
each message is composed by following values:
• Timestamp : recorded time (s);
• CAN ID : identifier of CAN message in HEX (i.e.,
03B1);
Cuzzocrea, A., Martinelli, F. and Mercaldo, F.
Applying Deep Learning Techniques to CAN Bus Attacks for Supporting Identification and Analysis Tasks.
DOI: 10.5220/0006835603130321
In Proceedings of the 15th International Joint Conference on e-Business and Telecommunications (ICETE 2018) - Volume 2: SECRYPT, pages 313-321
ISBN: 978-989-758-319-3
Copyright © 2018 by SCITEPRESS – Science and Technology Publications, Lda. All rights reserved
313

• DLC : number of data bytes, from 0 to 8;
• DATA[0 7] : data value (byte);
In order to discriminate messages injected by an
attacker by the normal ones, we consider the data
bytes of the CAN packet as the feature vector com-
posed in the following way:
• 1st byte represents F1 feature;
• 2nd byte represents F2 feature;
• 3rd byte represents F3 feature;
• 4th byte represents F4 feature;
• 5th byte represents F5 feature;
• 6th byte represents F6 feature;
• 7th byte represents F7 feature;
• 8th byte represents F8 feature.
We extracted the feature vector from four dataset
freely available for research purposes
2
including nor-
mal real-world CAN messages and four different
kinds of injected messages caused by following at-
tacks: dos attack (dos), fuzzy attack (fuzzy), spoofing
the drive gear (gear) and spoofing the RPM gauge
(rpm) (Martinelli et al., 2017). Dataset were con-
structed by logging CAN traffic through the OBD-II
(On-Board Diagnostics) port from a real vehicle while
message injection attacks were performing. Dataset
contain each 300 intrusions of message injection.
Each intrusion performed for 3 to 5 seconds, and each
dataset has total 30 to 40 minutes of CAN traffic.
We describe in details the four type of attacks:
• dos: it represent the denial of service attack, per-
formed by injecting messages of 0000 CAN ID
every 0.3 milliseconds. The 0000 CAN ID is the
most dominant, as depicted in the left box of Fig-
ure 1;
• fuzzy: injecting messages of totally random CAN
ID and DATA values every 0.5 milliseconds, as
depicted in the right box of Figure 1;
• gear/rpm: injecting messages of certain CAN ID
related to gear/rpm information every 1 millisec-
ond. The rpm (i.e., revolutions per minute) mea-
sures the number of revolutions completed in one
minute around a fixed axis. Running an engine at
a high RPM may cause damage to the engine and
reduce its expected lifespan.
Table 1 shows the overall number of messages for
the four dataset with the detail related to the injected
and the normal messages. The last row is related to
the full dataset, i.e. to the sum of all the messages
related to the other four dataset.
2
https://sites.google.com/a/hksecurity.net/ocslab/Data
sets/car-hacking-dataset
We designed an experiment in order to evaluate
the effectiveness of the feature vector we propose, ex-
pressed through the RQ1 and RQ2 research questions
stated in the introduction section.
More specifically, our aim is to verify if the eight
features are able to discriminate the four type of at-
tacks by the normal CAN messages.
We learn several deep learning classifiers with the
eight features.
The analysis goal is to verify if the considered fea-
tures are able to correctly discriminate between at-
tacks and normal messages. Two deep learning clas-
sification algorithms are used:
• NN: The Neural Network (NN) algorithm oper-
ates similar to the neural network of the brain.
The network closely resembles statistical meth-
ods such as curve fitting and regression analysis
(Schmidhuber, 2015). A neural network consists
of layers of inter-connected nodes. Each node is
called perceptron and it resembles a multiple lin-
ear regression. The perception feeds the signal
generated by a multiple linear regression into an
activation function that may be nonlinear;
• MLP: The Multilayer Perception (MLP) is a class
of feed-forward artificial neural network. An
MLP basically is a logistic regression classifier
where the input is first transformed using a learn
non-linear transformation. This transformation
projects the input data into a space where it be-
comes linearly separable. This intermediate layer
is referred to as a hidden layer (Villarrubia et al.,
2018). In a multi-layered perception, differently
from NN, perceptions are arranged in intercon-
nected layers. The input layer receives input pat-
terns, while the output layer contains classifica-
tions or output signals to which input patterns may
map.
These algorithms were applied to the eight fea-
tures (i.e., to the feature vector).
The classification analysis is performed using the
Weka
3
tool, a suite of machine learning software, em-
ployed in data mining for scientific research with the
deep learning library
4
.
3 EXPERIMENTAL EVALUATION
AND ANALYSIS
We used five metrics in order to evaluate the results
of the classification: Precision, Recall, F-Measure,
MCC and RocArea.
3
http://www.cs.waikato.ac.nz/ml/weka/
4
https://github.com/Waikato/wekaDeeplearning4j
SECRYPT 2018 - International Conference on Security and Cryptography
314
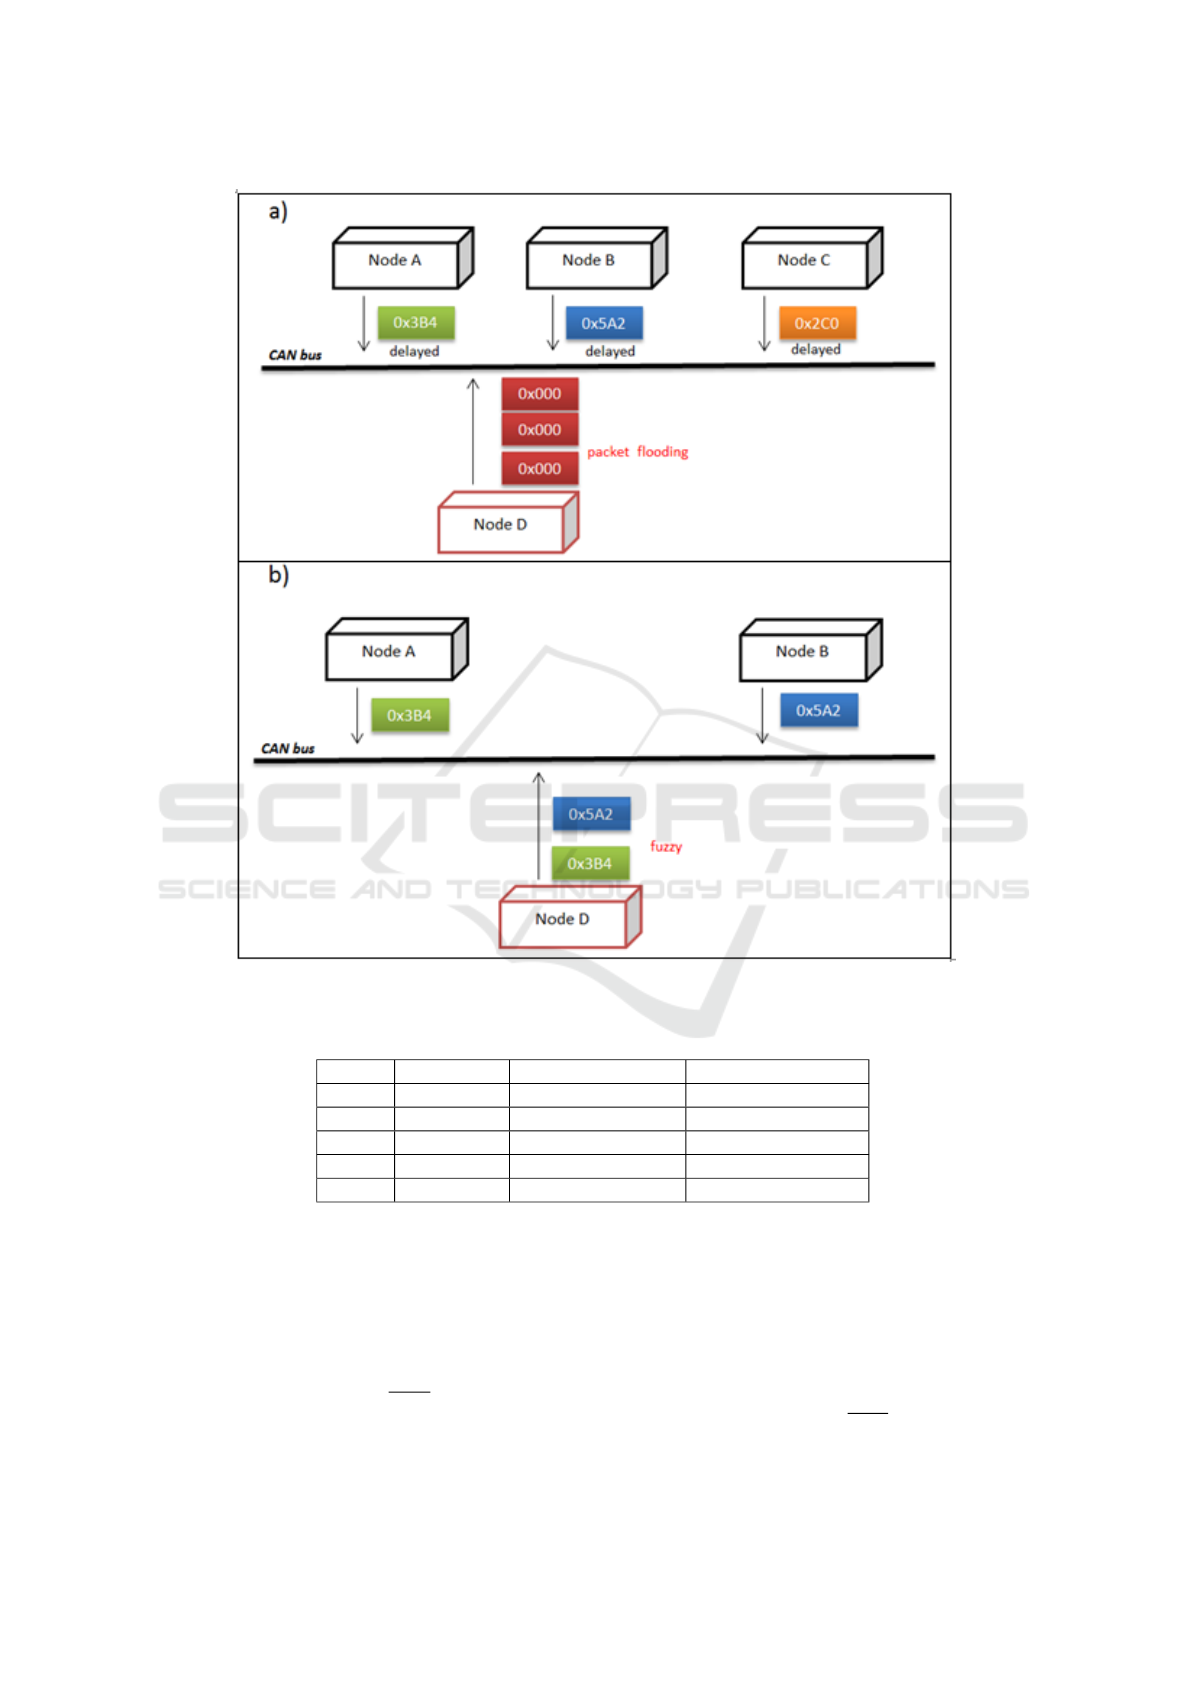
Figure 1: The dos (in the “a” box) and fuzzy (in the “b” box) attacks.
Table 1: Number of (total, normal and injected) messages in the four dataset. The last row is related to the full dataset, i.e. to
the sum of all the messages related to the other four dataset.
Attack # messages # normal messages # injected messages
dos 3,665,771 3,078,250 587,521
fuzzy 3,838,860 2,759,492 1,079,368
gear 4,443,142 2,766,522 1,676,620
rpm 4,621,702 2,290,185 2,331,517
full 16,569,475 10,894,449 5,675,026
The precision has been computed as the propor-
tion of the examples that truly belong to class X
among all those which were assigned to the class. It
is the ratio of the number of relevant records retrieved
to the total number of irrelevant and relevant records
retrieved:
Precision =
t p
t p+ f p
where tp indicates the number of true positives
and fp indicates the number of false positives.
The recall has been computed as the proportion
of examples that were assigned to class X, among all
the examples that truly belong to the class, i.e., how
much part of the class was captured. It is the ratio of
the number of relevant records retrieved to the total
number of relevant records:
Recall =
t p
t p+ f n
Applying Deep Learning Techniques to CAN Bus Attacks for Supporting Identification and Analysis Tasks
315

where tp indicates the number of true positives
and fn indicates the number of false negatives.
The F-Measure is a measure of a test’s accuracy.
This score can be interpreted as a weighted average of
the precision and recall:
F-Measure = 2 ∗
Precision∗Recall
Precision+Recall
MCC (i.e., the Matthews correlation coefficient)
is a measure related to the quality of binary (two-
class) classifications. It takes into account true and
false positives and negatives and is generally regarded
as a balanced measure which can be used even if the
classes are of very different sizes:
MCC =
t p∗tn−f p∗f n
√
(t p+f p)(t p+f n)(tn+ f p)(tn+ f n)
where tn is the number of true negatives.
The Roc Area is defined as the probability that a
positive instance randomly chosen is classified above
a negative randomly chosen.
The classification analysis consisted of building
deep learning classifiers with the aim to evaluate the
eight feature vector accuracy to distinguish between
injected and normal messages.
For training the classifier, we defined T as a set of
labeled messages (M, l), where each M is associated
to a label l ∈{IM, NM}. For each M we built a feature
vector F ∈ R
y
, where y is the number of the features
used in training phase (y = 8).
For the learning phase, we consider a k-fold cross-
validation: the dataset is randomly partitioned into
k subsets. A single subset is retained as the valida-
tion dataset for testing the model, while the remain-
ing k −1 subsets of the original dataset are used as
training data. We repeated this process for k = 10
times; each one of the k subsets has been used once as
the validation dataset. To obtain a single estimate, we
computed the average of the k results from the folds.
We evaluated the effectiveness of the classification
method with the following procedure:
1. build a training set T⊂D;
2. build a testing set T
0
= D÷T;
3. run the training phase on T;
4. apply the learned classifier to each element of T’.
Each classification was performed using 90% of
the dataset as training dataset and 10% as testing
dataset employing the full feature set.
The procedure was repeated for the four attacks
dataset (i.e., dos, fuzzy, gear and rpm) and for the full
dataset.
The results that we obtained with this procedure
are shown in table 2 for the single-attack identifica-
tion with the MLP algorithm, in table 3 for the single-
attack identification with the NN algorithm and in Ta-
ble 4 for the multi-attack identification.
With regard to the single-attack identification with
the MLP classification algorithm, we considered a
deep network with one hidden layer (depicted in the
the “b” box of Figure 2).
From the single-attack classification results with
the MLP classification algorithm (Table 2), we obtain
a precision weighed average ranging from 1 (for the
gear and the rpm attacks) to 0.983 (with the dos at-
tack), while the recall is ranging between 1 (for the
gear and the rpm attacks) and 0.982 (with the dos at-
tack). The F-Measure is ranging between 1 (for the
gear and the rpm attacks) and and 0.982 (with the dos
attack).
With the regard to the single-attack identification
with the NN classification algorithm, we considered
a deep learning network with one hidden layer (with
100 units).
From the single-attack classification results with
the NN algorithm (Table 3), we observe that the best
weighted precision is obtained in the rpm attack clas-
sification (i.e., equal to 1), while with the other attacks
the precision obtained is respectively equal to 0.994
(for the fuzzy attack), 0.991 (with the gear attack) and
0.913 (with the dos attack). The obtained weighted
recall is ranging between 1 (for rpm attack) and 0.886
(for the dos attack). The obtained F-Measure is rang-
ing between 1 (for the rpm attack) and 0.888 (for the
dos attack), while for the fuzzy attack is equal to 0.888
and for the gear one is equal to 0.991.
With regards to the single-attack identification, the
MLP and NN are able to identify all the single attacks.
From the performance point of view, we observe that
the MLP classification algorithm obtains better preci-
sion and recall with respect to the NN one.
RQ1 response: From the results of the single-
attack experiment, we demonstrate that the consid-
ered feature vector is able to discriminate between dif-
ferent kinds of attacks. Furthermore, the MLP clas-
sification algorithm is able to obtain better perfor-
mances (weighted precision ranging between 1 and
0.983 and weighted recall ranging between 1 and
0.982) if compared with the model built using the NN
classification algorithm (weighted precision ranging
between 1 and 0.913 and weighted recall ranging be-
tween 1 and 0.886).
With regard to the multi-attack identification, we
perform experiments using the NN and the MLP deep
learning algorithms, as in the single-attack identifi-
cation experiment (using the full dataset). Further-
SECRYPT 2018 - International Conference on Security and Cryptography
316

Table 2: Single-attack classification results with the MLP algorithm: Precision, Recall, F-Measure, MCC and RocArea
computed with the MLP (with one hidden layer) classification algorithms. With IM we label the impostor messages, while
with NM the normal messages.
Category Precision Recall F-Measure MCC Roc Area Class
1.000 0.972 0.986 0.963 0.985 NM
dos 0.955 1.000 0.977 0.963 0.985 IM
0.983 0.982 0.982 0.963 0.985 Weighted Avg.
0.996 1.000 0.998 0.981 0.993 NM
fuzzy 0,997 0.969 0.983 0.981 0.993 IM
0,996 0.996 0.996 0.981 0.993 Weighted Avg.
1.000 1.000 1.000 1.000 1.000 NM
gear 1.000 1.000 1.000 1.000 1.000 IM
1.000 1.000 1.000 1.000 1.000 Weighted Avg.
1.000 1.000 1.000 1.000 1.000 NM
rpm 1.000 1.000 1.000 1.000 1.000 IM
1.000 1.000 1.000 1.000 1.000 Weighted Avg.
Table 3: Single-attack classification results with the NN algorithm: Precision, Recall, F-Measure, MCC and RocArea, com-
puted with six different classification algorithms. With IM we label the impostor messages, while using NM the normal
messages.
Category Precision Recall F-Measure MCC Roc Area Class
1.000 0.818 0.900 0.792 0.978 NM
dos 0,766 1.000 0.867 0.792 0.978 IM
0.913 0.886 0.888 0.792 0.978 Weighted Avg.
0.993 1.000 0.996 0.967 0.999 NM
fuzzy 0.999 0.943 0.970 0.967 0.999 IM
0.994 0.994 0.993 0.967 0.999 Weighted Avg.
1.000 0.988 0.994 0.973 1.000 NM
gear 0.958 1.000 0.979 0.973 1.000 IM
0.991 0.991 0.991 0.973 1.000 Weighted Avg.
1.000 1.000 1.000 1.000 1.000 NM
rpm 1.000 1.000 1.000 1.000 1.000 IM
1.000 1.000 1.000 1.000 1.000 Weighted Avg.
more, we designed several network using the MLP
algorithm (i.e., the one that obtained the best perfor-
mances in the single-attack classification task), as de-
picted in Figure 2.
As shown in Figure 2, we consider six deep learn-
ing networks, whit a number of hidden layer ranging
from 0 to 5. In each network, the features are repre-
sented by the input layer (the green one), the labels
related to the considered attacks and to the normal
messages (i.e., dos, gear, rpm, fuzzy and the normal
class) are the output layer (represented in yellow in
2), while the hidden layers are between the input and
the output layers and are represented in red. In Fig-
ure 2 the “a” box does not exhibit hidden layers, the
one in the “b” contains one hidden layer, the one in
the “c” contains two hidden layers, the one in the “d”
contains three hidden layers, the one in the “e” con-
tains four hidden layers and the last one in the “f”
contains five hidden layers.
Table 4 shows the results of the multi-attack iden-
tification.
In Table 4 we consider seven different classifica-
tions: the first one (i.e., NN in Table 4) is related to
the NN deep learning network with one hidden layer
(with 100 units), while the remaining ones are related
to the classifiers built using the MLP algorithm: MLP
0 is related to the deep learning network with 0 hid-
den states (i.e. the network depicted in the “a” box of
Figure 2), MLP 1 is related to the deep learning net-
work with 1 hidden states (i.e. the network depicted
in the “b” box of Figure 2), MLP 2 is related to the
deep learning network with 2 hidden states (i.e. the
network depicted in the “c” box of Figure 2), MLP
3 is related to the deep learning network with 3 hid-
den states (i.e. the network depicted in the “d” box of
Figure 2), MLP 4 is related to the deep learning net-
work with 4 hidden states (i.e. the network depicted
in the “e” box of Figure 2) and MLP 5 is related to
the deep learning network with 5 hidden states (i.e.
the network depicted in the “f” box of Figure 2)
Applying Deep Learning Techniques to CAN Bus Attacks for Supporting Identification and Analysis Tasks
317
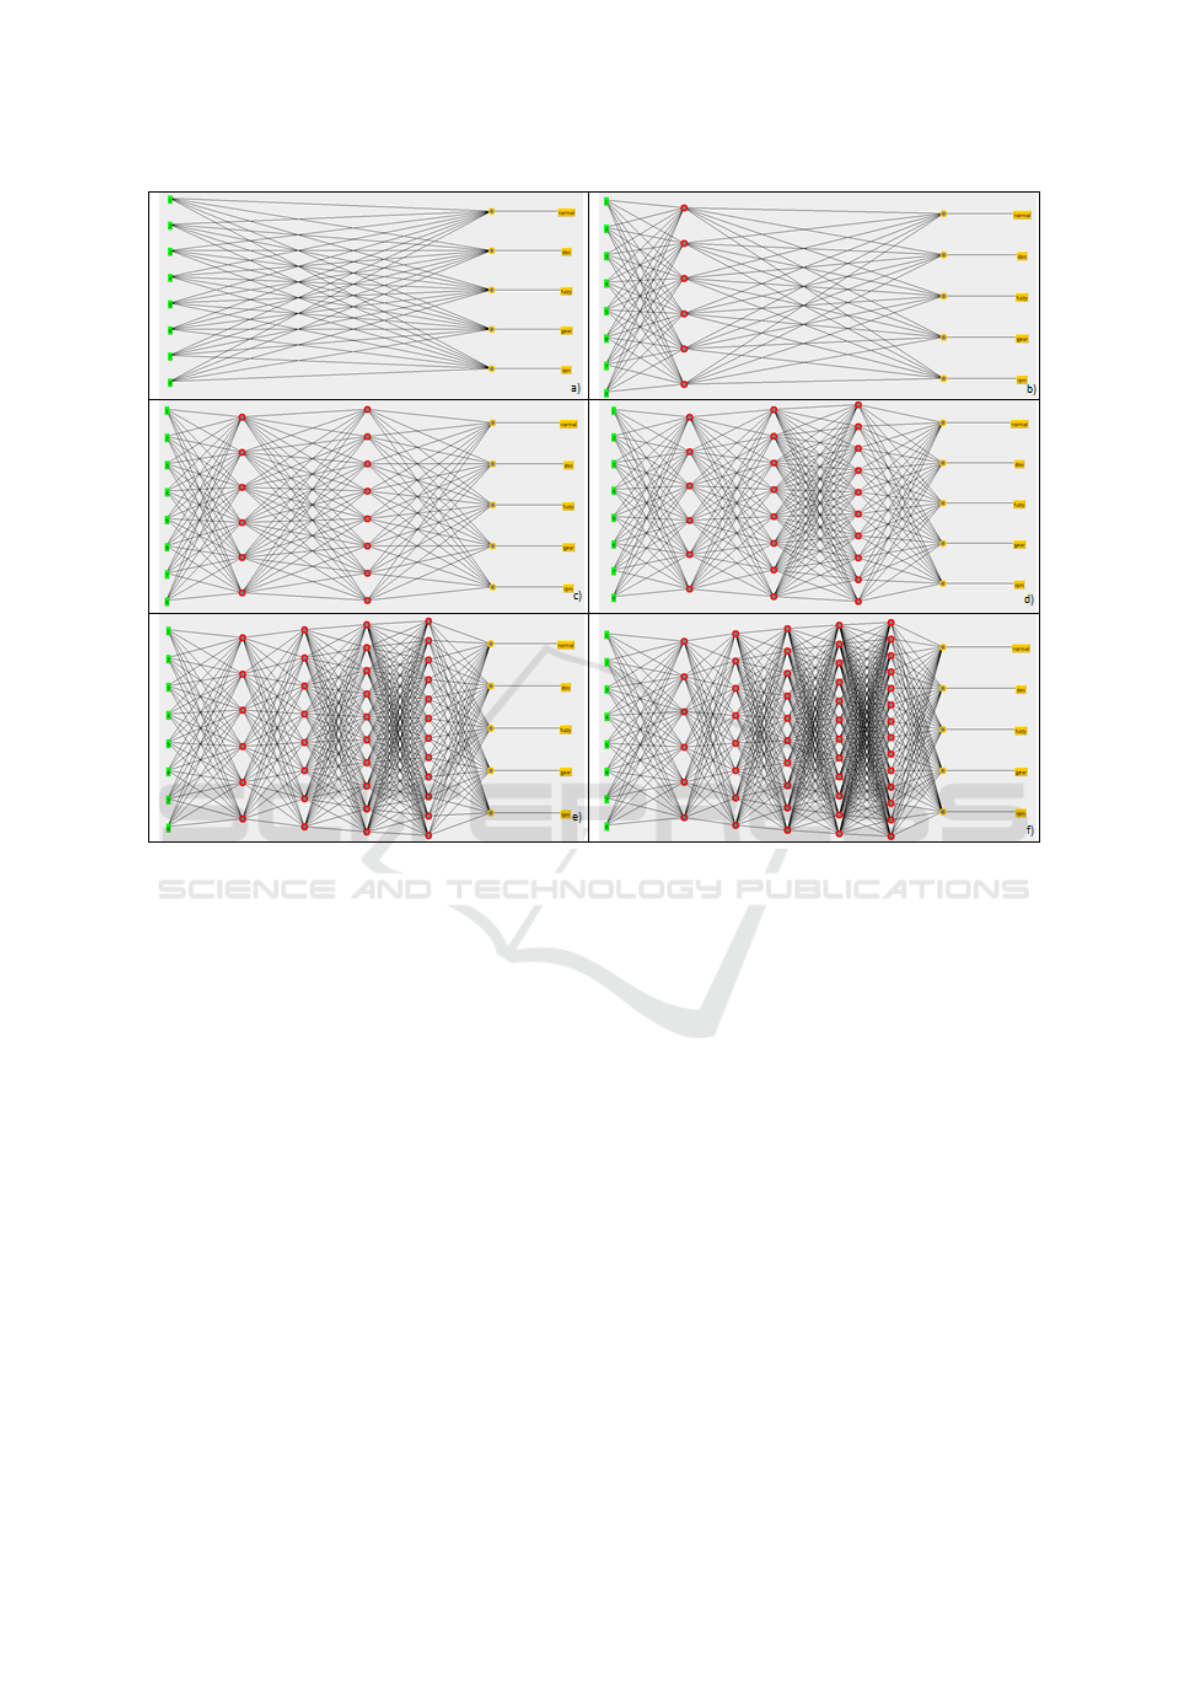
Figure 2: The deep networks considered with the MultiLayer Perception algorithm: the network in the “a” box does not exhibit
hidden layers, the one in the “b” contains one hidden layer, the one in the “c” contains two hidden layers, the one in the “d”
contains three hidden layers, the one in the “e” contains four hidden layers and the last one in the “f” contains five hidden layers.
From the results of the multi-attack classification,
we observe that the MLP networks obtain better per-
formances than the NN model (with the exception of
the MLP 5 model i.e., the MLP network with 5 hid-
den layers). As a matter of fact we reach a weighted
precision ranging from 0.587 (with the MLP 5 algo-
rithm) to 0.974 (with the MLP 1 and the MLP 3 clas-
sifications), while the average recall is ranging be-
tween 0.766 (with the MLP 5 algorithm) and 0.966
(obtained with MLP 1 deep learning network). Fur-
thermore, we observe that when we consider more
than 4 hidden states, the performances dramatically
decrease: as a matter of fact the precision and the re-
call is equal to 0 for all the considered attacks in the
MLP 5 classification.
In detail, in the multi-attack identification we ob-
tain:
• with regard to the NN classification, a precision
ranging between 0 (for the dos attack) and 1 (for
the rpm attack) and a recall ranging between 0 (for
the dos attack) and 1 (for the rpm one);
• with regards to the MLP 0 classification, a pre-
cision ranging between 0.738 (for the dos attack)
and 0.998 (for the rpm attack) and a recall rang-
ing between 0.4 (for the fuzzy attack) and 1 (for
the gear and rpm attacks);
• with regards to the MLP 1 classification, a pre-
cision ranging between 0.739 (for the dos attack)
and 1 (for the gear and the rpm attacks) and a re-
call ranging between 0.956 (for the fuzzy attack)
and 1 (for the dos, the gear and the rpm attacks);
• with regards to the MLP 2 classification, a pre-
cision ranging between 0.741 (for the dos attack)
and 1 (for the gear and the rpm attacks) and a re-
call ranging between 0.9 (for the dos and the gear
attacks) and 1 (for the rpm attack);
• with regards to the MLP 3 classification, a pre-
cision ranging between 0.740 (for the dos attack)
and 1 (for the gear and the rpm attacks) and a re-
call ranging between 0.934 (for the fuzzy attack)
and 1 (for the dos, the rpm and the gear attacks);
• with regards to the MLP 4 classification, a pre-
SECRYPT 2018 - International Conference on Security and Cryptography
318

Table 4: Multi-attack classification results: Precision, Recall, F-Measure, MCC, RocArea computed with the NN and MLP
classification algorithms. With regard to the MLP classification algorithm we considered six different deep learning networks.
Algorithm Precision Recall F-Measure MCC Roc Area Class
0.888 0.998 0.940 0.715 0.983 normal
0.000 0.000 0.000 0.000 0.972 dos
NN 0.999 0.882 0.937 0.937 0.999 fuzzy
0.966 1.000 0.983 0.982 1.000 gear
1.000 1.000 1.000 1.000 1.000 rpm
0.819 0.902 0.858 0.686 0.984 Weighted Avg.
0.922 0.977 0.949 0.766 0.982 normal
0.738 0.500 0.596 0.576 0.982 dos
MLP 0 0.953 0.400 0.563 0.611 0.975 fuzzy
0.994 1.000 0.997 0.997 1.000 gear
0.998 1.000 0.999 0.999 1.000 rpm
0.914 0.919 0.911 0.770 0.984 Weighted Avg.
0.998 0.957 0.977 0.912 0.990 normal
0.739 1.000 0.850 0.844 0.982 dos
MLP 1 0.991 0.956 0.973 0.972 0.991 fuzzy
1.000 1.000 1.000 1.000 1.000 gear
1.000 1.000 1.000 1.000 1.000 rpm
0.974 0.966 0.968 0.917 0.990 Weighted Avg.
0.979 0.962 0.970 0.877 0.953 normal
0.741 0.900 0.813 0.796 0.899 dos
MLP 2 0.994 0.957 0.975 0.975 0.987 fuzzy
1.000 0.900 0.947 0.946 0.955 gear
1.000 1.000 1.000 1.000 1.000 rpm
0.960 0.955 0.956 0.883 0.952 Weighted Avg.
0.998 0.957 0.977 0.911 0.989 normal
0.740 1.000 0.851 0.845 0.982 dos
MLP 3 0.997 0.934 0.964 0.964 0.984 fuzzy
1.000 1.000 1.000 1.000 1.000 gear
1.000 1.000 1.000 1.000 1.000 rpm
0.974 0.965 0.967 0.916 0.989 Weighted Avg.
0.864 0.991 0.923 0.623 0.843 normal
0.773 0.100 0.177 0.258 0.686 dos
MLP 4 0.887 0.737 0.805 0.804 0.953 fuzzy
0.950 0.700 0.806 0.807 0.860 gear
1.000 0.800 0.889 0.889 0.915 rpm
0.869 0.874 0.842 0.620 0.837 Weighted Avg.
0,766 1,000 0,868 0,000 0,491 normal
0,000 0,000 0,000 0,000 0,536 dos
MLP 5 0,000 0,000 0,000 0,000 0,483 fuzzy
0,000 0,000 0,000 0,000 0,472 gear
0,000 0,000 0,000 0,000 0,451 rpm
0,587 0,766 0,665 0,000 0,492 Weighted Avg
cision ranging between 0.773 (for the dos attack)
and 1 (for the rpm attack) and a recall ranging be-
tween 0.1 (for the dos attack) and 0.991 (for the
normal messages identification);
• with regards to the MLP 5 classification, a preci-
sion ranging between 0 (for the dos, the fuzzy, the
gear and the rpm attacks) and 0.766 (related to the
normal messages identification) and a recall rang-
ing between 0 (for the dos, the fuzzy, the gear and
the rpm attacks) and 1 (for the normal messages
identification).
RQ2 response: The considered features are able to
obtain good performances with the NN and MLP deep
learning algorithms in the multi-attack classification.
Considering that the MLP classification overcomes
the NN one from the performance point of view, we
Applying Deep Learning Techniques to CAN Bus Attacks for Supporting Identification and Analysis Tasks
319

designed several networks (with a different number
of hidden layers) with the aim to investigate whether
increasing the number of hidden layers we are able
to obtain better performances. The best classification
performances are obtained with the models trained us-
ing the MLP algorithm with 1 (MLP 1 in Table 4) and
3 hidden layers (MLP 3 in Table 4): the weighted pre-
cision obtained is 0.974 for both the classifiers, while
the recall is equal to 0.966 for the MLP 1 classifica-
tion and 0.965 for the MLP 3 one. The performances
dramatically decrease when are considered 5 hidden
layers.
4 CONCLUSIONS AND FUTURE
WORK
Nowadays the safety of cars and passengers relies
on the communication mechanism provided by the
CAN bus, a serial data communication to permits the
communication between the several components in-
side modern vehicles. In order to increase the safety
of modern cars in this paper we proposed a method
to identify attacks targeting the CAN bus exploiting
deep learning algorithms. We demonstrated the ef-
fectiveness of the proposed method evaluating a real-
world dataset containing CAN messages related to
four attacks (i.e., dos, fuzzy, rpm and gear) messages
and normal messages gathered from a real vehicle.
We obtained the best results using deep learning net-
works trained with the MLP classification algorithm
with 1 and 3 hidden layers, reaching a weighted preci-
sion equal to 0.974 and weighted recall equal to 0.966
for the MLP classification with one hidden layer and
equal to 0.965 for the MLP classification with three
hidden layers.
As future work we plan to evaluate the proposed
method to a more extensive set of attacks, to ver-
ify the effectiveness of the proposed method in the
identification of a more widespread set of attacks.
Furthermore, we will investigate the adoption of for-
mal methods with the aim to localize the attack CAN
packets with the aim to prevent the malicious injec-
tion. Another line consists in integrating the actual
framework with emerging big data trends (e.g., (Cuz-
zocrea et al., 2009; Cuzzocrea, 2006; Cuzzocrea et al.,
2013)).
ACKNOWLEDGMENTS
This work has been partially supported by H2020
EU-funded projects NeCS and C3ISP and EIT-Digital
Project HII and PRIN “Governing Adaptive and Un-
planned Systems of Systems” and the EU project Cy-
berSure 734815.
REFERENCES
Al-Kahtani, M. S. (2012). Survey on security attacks in ve-
hicular ad hoc networks (vanets). In Signal Process-
ing and Communication Systems (ICSPCS), 2012 6th
International Conference on, pages 1–9. IEEE.
Baccouche, M., Mamalet, F., Wolf, C., Garcia, C., and
Baskurt, A. (2011). Sequential deep learning for hu-
man action recognition. In International Workshop
on Human Behavior Understanding, pages 29–39.
Springer.
Bernardi, M. L., Cimitile, M., Martinelli, F., and Mercaldo,
F. (2018). Driver and path detection through time-
series classification. Journal of Advanced Transporta-
tion, 2018.
Cuzzocrea, A. (2006). Accuracy control in compressed
multidimensional data cubes for quality of answer-
based OLAP tools. In 18th International Conference
on Scientific and Statistical Database Management,
SSDBM 2006, 3-5 July 2006, Vienna, Austria, Pro-
ceedings, pages 301–310.
Cuzzocrea, A., Fortino, G., and Rana, O. F. (2013). Man-
aging data and processes in cloud-enabled large-scale
sensor networks: State-of-the-art and future research
directions. In 13th IEEE/ACM International Sympo-
sium on Cluster, Cloud, and Grid Computing, CCGrid
2013, Delft, Netherlands, May 13-16, 2013, pages
583–588.
Cuzzocrea, A., Furfaro, F., and Sacc
`
a, D. (2009). En-
abling OLAP in mobile environments via intelligent
data cube compression techniques. J. Intell. Inf. Syst.,
33(2):95–143.
Ding, L., Fang, W., Luo, H., Love, P. E., Zhong, B., and
Ouyang, X. (2018). A deep hybrid learning model to
detect unsafe behavior: Integrating convolution neural
networks and long short-term memory. Automation in
Construction, 86:118–124.
Kwak, B. I., Woo, J., and Kim, H. K. (2016). Know your
master: Driver profiling-based anti-theft method. In
PST 2016.
Martinelli, F., Mercaldo, F., Nardone, V., Orlando, A., and
Santone, A. (2018). Whos driving my car? a machine
learning based approach to driver identification. In
ICISSP.
Martinelli, F., Mercaldo, F., Nardone, V., and Santone, A.
(2017). Car hacking identification through fuzzy logic
algorithms. In Fuzzy Systems (FUZZ-IEEE), 2017
IEEE International Conference on, pages 1–7. IEEE.
Samara, G., Al-Salihy, W. A., and Sures, R. (2010). Se-
curity issues and challenges of vehicular ad hoc net-
works (vanet). In New Trends in Information Science
and Service Science (NISS), 2010 4th International
Conference on, pages 393–398. IEEE.
SECRYPT 2018 - International Conference on Security and Cryptography
320

Schmidhuber, J. (2015). Deep learning in neural networks:
An overview. Neural networks, 61:85–117.
Villarrubia, G., De Paz, J. F., Chamoso, P., and De la Prieta,
F. (2018). Artificial neural networks used in optimiza-
tion problems. Neurocomputing, 272:10–16.
Applying Deep Learning Techniques to CAN Bus Attacks for Supporting Identification and Analysis Tasks
321
