
The Operational Risk Research for Power Grid Using Electrical
Dissection Method
Cong Zhang
1,a
, Ming Li
2,b
, Zhen Liu
1,c
and Wenzhu Zhang
3,d
1
Shandong Zibo Power Supply Company, Zibo, China
2
State Grid Shan Dong Electric Power Research Institute, Ji’nan, China
3
Department of Electrical Engineering Shandong University, Ji’nan, China
a
51102522@qq.com,
b
lm_sdpj@163.com,
c
18366116537@163.com,
d
940024322@qq.com
Keywords: Power grid, risk analysis, electrical dissection.
Abstract: Operational risk analysis plays an important role in ensuring the safe and stable operation of power grid. A
novel electrical dissection approach was applied to analyse the operational risk for the grid. This method can
validly determine the power transmitted for each line between generator and load, and the application of the
new electrical dissection method is quantified according to the power transmission limitation of line. This
new method was tested by an IEEE 39-bus system, and the analysis results had proved the validity and
rationality of this proposed method.
1 INTRODUCTION
Power system risk analysis has gradually become a
widely researched work, because there are many
cascading failures caused by severe failures in recent
years. (Moore, 1999). The method for finding the
vital route or "fragile line" is significantly important
for warnings and protecting critical links (Smith,
1998).
Complex network method is one of the main
research methods at present. It analyses the grid risk
from the structure aspect (Datta, 2017; Gan, 2003;
Holmgren, 2006). The metrics are assumed to be the
shortest path, only studying structural risk in a pure
topological structure. Moreover, the power between
lines requires certain objective constraints and it is
difficult for the metrics to capture main features of
grids.
In (Rosato, 2007), Sensitivity analysis
technology is adopted to study power grids in the
operation status (Rosato, 2007). If the grid
parameters change, the method in(Rosato, 2007) can
capture the degree of influence of the system
parameters. But it only considers the circuit
parameters and load changes, so the result is one-
way.
To eliminate the defect in (Rosato, 2007), the
electrical dissection method has been studied in the
power grid risk analysis (Raza, 2017; Jankovic, 2017;
Tang, 2006; Tang, 2009; Shao, 2009). The grid risk
index is formed by using the electrical dissection
information of paths. Thus both the topological
structure characteristics in original network and
influence on system risk for operation state changing
can be considered. So the comprehensive power grid
risk can be accomplished.
The rest of this document is as follows. Section
II gives the electrical dissection method and defines
the risk index. Section III introduces the network
efficiency. Section IV presents the numerical
simulation results of an IEEE 39 bus text system
.Section V is the conclusion of full paper.
2 THE INTRODUCTION OF RISK
INDEX
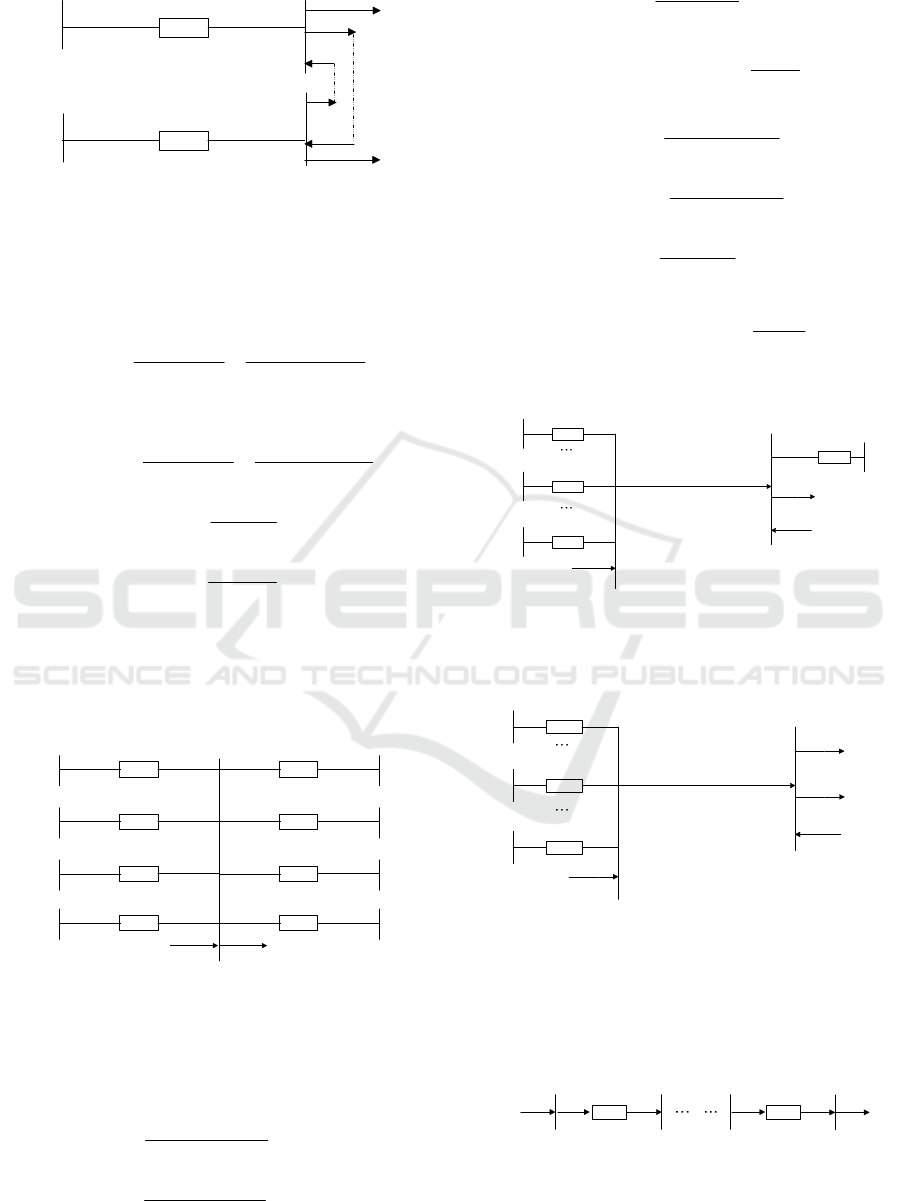
Figure.1 is an example of an AC code, which has
three branches, one is imputing flow branch and the
others are outputting flow branches. We use it to
dissect as an initial deduce.
T
E
T
Z
11
jQP +
22
jQP +
Figure 1: Simple example of an AC code.
648
Zhang, C., Li, M., Liu, Z. and Zhang, W.
The Operational Risk Research for Power Grid Using Electrical Dissection Method.
In 3rd International Conference on Electromechanical Control Technology and Transportation (ICECTT 2018), pages 648-651
ISBN: 978-989-758-312-4
Copyright © 2018 by SCITEPRESS – Science and Technology Publications, Lda. All rights reserved
T
E
'
T
Z
11
jQP +
T
E
'
1T
Z
)()(
'
11 xx
QQjPP Δ−+Δ+
'
22
jQP +
)()(
'
22 xx
QQjPP Δ++Δ−
x
jQ
22
jQP +
x
PΔ
Figure 2: Final dissected results of figure 1.
The resulting of dissected for figure.1 is shown
in figure.2. The parameters in figure.2 are as follows.
2
21 12
22 22
[]
x
QPQ PQ
PQ
P
PQ PQ
−
ΔΔ
Δ= =
Δ+Δ Δ+Δ
(1)
2
21 12
22 22
[]
x
P
PQ PQ
PQ
Q
PQ PQ
−
ΔΔ
Δ= =
Δ+Δ Δ+Δ
(2)
1
1
TT
x
P
Z
Z
PP
=
+Δ
(3)
2
2
TT
x
P
Z
Z
PP
=
−Δ
(4)
The general deduce to be dissected is shown in
figure.3.
There are n inputting and outputting branches in
sending and receiving end respectively. There is a
generator in sending end and a load in receiving end.
1T
Z
2T
Z
Tj
Z
Tm
Z
1
R
Z
2R
Z
Ri
Z
Rn
Z
1T
E
2T
E
Tj
E
Tm
E
1R
E
2
R
E
Ri
E
Rn
E
11 TT
jQP +
22 TT
jQP +
L
L
L
L
TjTj
jQP +
TmTm
jQP +
GG
jQP +
11 RR
jQP +
22 RR
jQP +
RjRj
jQP +
RnRn
jQP +
LL
jQP +
U
Figure 3: Ac code having n input and output branches.
Figure 4 and figure 5 show the final dissected
results of figure.3. Parameters in figure.4 and
figure.5 are listed below.
22
[]
() ()
Ri Ri
Rix
QPQ PQ
P
PQ
−
Δ=
+
(5)
22
[]
() ()
Ri Ri
Rix
PPQ PQ
Q
PQ
−
Δ=
+
(6)
Tji Tj
Ri Rix
P
Z
Z
PP
=
+Δ
(7)
()
T
Gi Gi G G
Ti
Z
PjQ PjQ
Z
∑
+=+
∑
(8)
22
[]
() ()
LL
Lx
QPQ PQ
P
PQ
−
Δ=
+
(9)
22
[]
() ()
LL
Lx
PPQ PQ
Q
PQ
−
Δ=
+
(10)
TjL Tj
LLx
P
Z
Z
PP
=
+Δ
(11)
()
T
LGLGG
TL
Z
PjQ PjQ
Z
∑
+=+
∑
(12)
1T
E
iT
Z
1
Tj
E
Tji
Z
Tm
E
Tmi
Z
GiGi
jQP +
)()(
RixRiRixRi
QQjPP Δ−+Δ+
Ri
Z
Ri
E
RiRi
jQP +
Rix
PΔ
Rix
jQ
Figure 4: Dissected note for output branch.
1T
E
LT
Z
1
Tj
E
TjL
Z
Tm
E
TmL
Z
GLGL
jQP +
)()(
LxLLxL
QQjPP Δ−+Δ+
LL
jQP +
Lx
PΔ
Lx
jQ
Figure 5: Dissected note for output load.
Paths connect various sources (generators) and
flows (loads). The grid risk is determined by
electrical parameters of the paths. So the grid risk
evaluation is to be formed by electrical dissection
information of the grid.
1
Z
i
S
p
P
,1
max),(1 l
P
j
R
max),(lk
P
pk
P
,
k
Z
Figure 6: Path between source and flow.
The Operational Risk Research for Power Grid Using Electrical Dissection Method
649
A path
p
L between iS (source) and iR (flow) is
demonstrated in figure.6. The branch in path may
have many sub-branches. The sub-branch risk
index for its original branch can be expressed:
2
,
(),
,
(),max
kp
kl p
iGjR
kl i j
P
B
PPP
∈∈
=
∑
(13)
where
,kp
P
is active power flow in the sub-branch
k of path
p
L between iS and iR . (),maxklP is the
maximize power limit of sub-branch
k . i
P
is
generator's output and
j
P
is the actual load value.
The results of electrical dissection illustrate the
fact that even different paths with different risks still
have the possibility of the same branches and sub-
branches. So, the branch risk can be treated as the
corresponding sub-branches risk. The risk index of
branch
l is as follows:
(),
1
n
lklp
p
BB
=
=
∑
(14)
So we can consider more information as much as
possible, such as the grid structure, grid operation
mode, power between generator and load by the
utilization of each line, and quantifies for using
relationship with the branch transmission power
limit in the new risk index by using electrical
dissection information.
2.1 The Grid Efficiency
For one source and a flow grid, the maximum power
flow is set to equal to the power transmission
capacity. To locate the critical sites and obtain the
overall performance of the grid, the transmission
capacity of the power grid is defined as the network
efficiency.
max
(, )EAC
ϕ
= (15)
where
max
ϕ
is the function for the network
maximum flow.
A
is the grid topology matrix. C is
the branch matrix.
Without taking into account of the frequency,
voltage, reactive power and other factors, the index
in this paper is only a rough estimate. However, the
rough estimate can find the relative size of the
critical line fault to the system, which is sufficient.
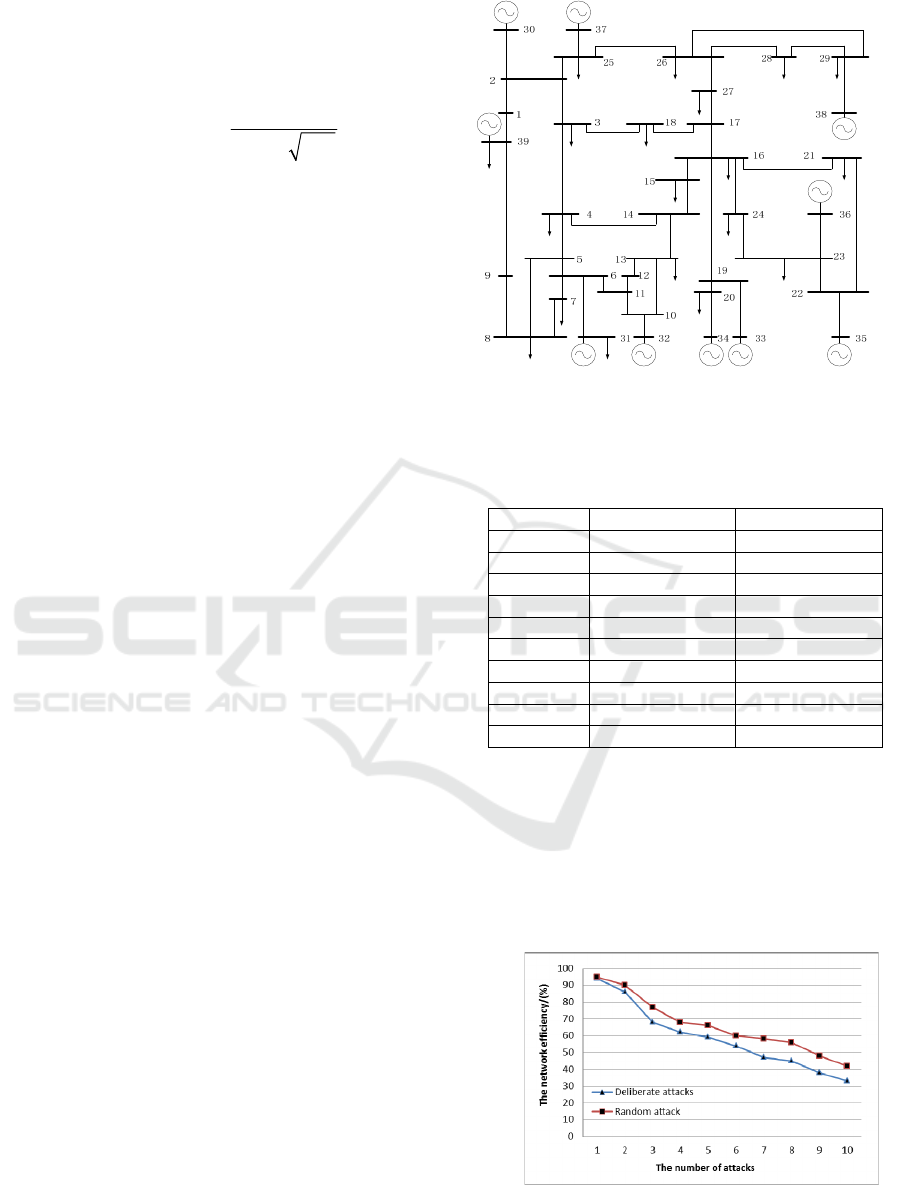
2.2 Numerical Results
An IEEE 39-bus test system shown in figure.7
illustrates this proposed method. It has 46 lines, 10
notes and 19 load notes.
Figure 7: IEEE 39-bus text system.
Table 1: The sorting of critical lines.
Number Name Index
1 25-26 1.616836
2 26-27 1.241098
3 1-2 0.875855
4 38-29 0.729488
5 21-22 0.711351
6 2-30 0.427853
7 25-37 0.381796
8 2-3 0.318535
9 22-35 0.307188
10 16-17 0.303296
The lines with 10 larger risk index are calculated
by using the proposed approach and are shown in
table 1.
To demonstrate accuracy of the sorting results in
table 1, the deliberate attack strategy that removes
any of 10 lines according to results in table 1 is used
to attack the grid. Figure 8 shows the network
efficiency after remove one line.
Figure 8: The effect of different strategy attacks on the
network efficiency.
ICECTT 2018 - 3rd International Conference on Electromechanical Control Technology and Transportation
650
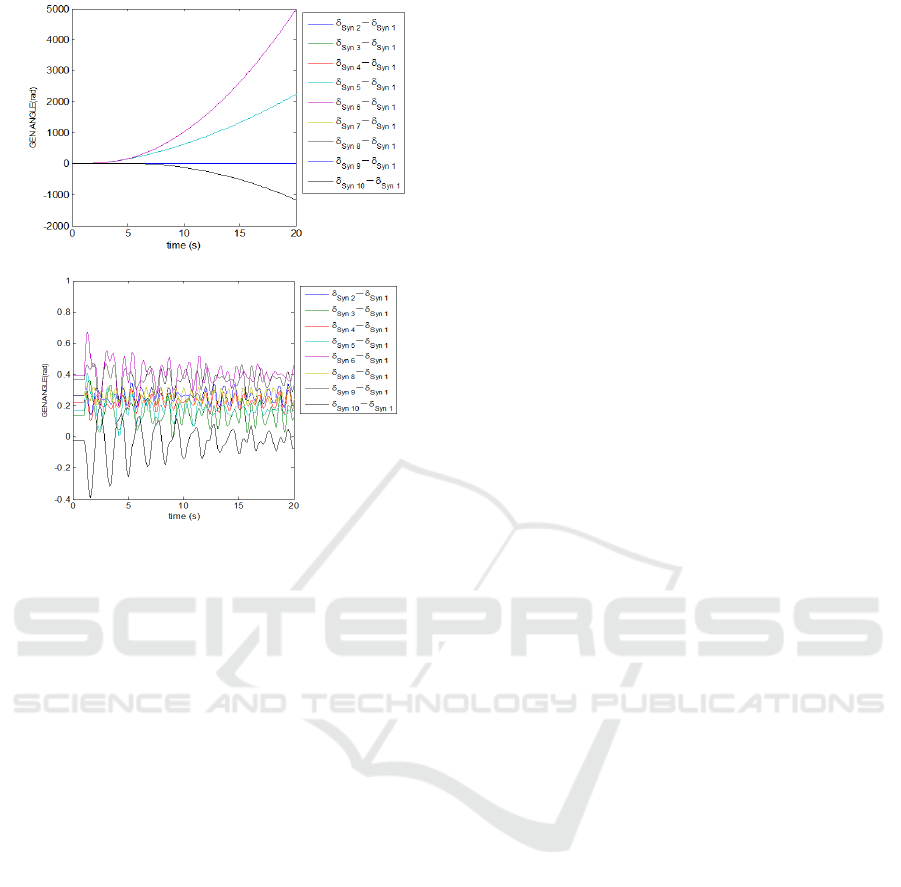
(a) Line 25-26 faults
(b) Line 15-16 faults
Figure 9: The generator power-angle curve.
At first, the two curves changed very little
because there was no cut set network. As the number
of attacks increases, the curve that is deliberately
attacked falls faster and faster. The lines in table 1.
play a hub role in forming cut set. The comparison
results show that the higher risk index line results in
more vulnerable for power system during attack.
In another aspect, the time domain simulation
that solves randomly selected three-phase short
circuit on the high voltage side of line 25-26 and line
15-16 is accomplished. Figure 9 shows the generator
power-angle curve. As shown in figure.9, the power-
angles of generator 3, 6 and 10 become larger as
time goes by and can not back to the normal status.
This proves that the system can not maintain
transient stability. However, power-angle curves in
figure 9(b) have only a little attenuation oscillation.
We can conclude that the system is transient
stability. This can further verify the validity of the
proposed method.
3 CONCLUSIONS
The paper presents an electric dissection method
used to analyse the risk of power grid. The proposed
risk index reflects not only the relatively static fixed
topology structure but also the operation state of
power grid. The relationship between the line
utilization ratio and the line limit is very intuitive
and can be quantified. This method can quickly
select relatively weak lines in the grid. Therefore,
the method proposed in this paper will be widely
used in power grid risk assessment in the future.
REFERENCES
Moore, R., Lopes, J., 1999. Paper templates. In
TEMPLATE’06, 1st International Conference on
Template Production. SCITEPRESS.
Smith, J., 1998. The book, The publishing company.
London, 2
nd
edition.
Datta, S., & Vittal, V. 2017. Operational risk metric for
dynamic security assessment of renewable
generation. IEEE Transactions on Power
Systems, PP(99), 1-1.
D. Q. Gan, J. Y. Hu, and Z. X. Han, J, 2004.Thinking of
several international power outages in 2003[J].
Automation of Electric Power Systems,28(3), pp: 1-4.
Holmgren, A. J. 2006. Using graph models to analyse the
vulnerability of electric power networks. Risk Analysis
An Official Publication of the Society for Risk
Analysis, 26(4), 955.
Rosato, V., Bologna, S., & Tiriticco, F. 2007. Topological
properties of high-voltage electrical transmission
networks. Electric Power Systems Research, 77(2),
99-105.
Hines, P., & Blumsack, S. 2008. A centrality measure for
electrical networks. 185.
Raza, S., Mokhlis, H., Arof, H., Laghari, J. A., &
Mohamad, H. 2017. A sensitivity analysis of different
power system parameters on islanding detection. IEEE
Transactions on Sustainable Energy, 7(2), 461-470.
Jankovic, N., Kryvchenkova, O., Batcup, S., & Igic, P.
2017. High sensitivity dual-gate four-terminal
magnetic sensor compatible with soi finfet
technology. IEEE Electron Device Letters, PP(99), 1-
1.
Tang, Y., & Yu, J. L. 2006. A new dissecting method for
AC power system. International Conference on Future
Power Systems (pp.6 pp.-6). IEEE.
Tang, Y., Wu, Y. J., & Li, Y. 2009. A proposal for
investment recovery of TCSC based on electrical
dissecting method. Power & Energy Society General
Meeting, 2009. PES '09. IEEE (Vol.25, pp.1-6). IEEE.
Shao, Y., & Ji-Lai, Y. U. 2009. Power grid vulnerability
assessment based on electrical dissection information
of the electric power network. Proceedings of the
Csee, 29(31), 34-39.
Yu, J. L., & Tang, Y. 2007. United electrical dissection of
ac branch and bus. Proceedings of the Csee, 27(16),
37-42.
Yi, T., Ji-Lai, Y., & Lin, L. X. (2004). An electrical
dissecting method of AC branch with FACTS for
ancillary service assessment.
The Operational Risk Research for Power Grid Using Electrical Dissection Method
651
