
Fatigue Life Prediction Model of Pavement Cement Concrete
under Multi-field Coupling Condition
Shengbo Zhou
1
, Junlin Liang*
2
, Jianping Xiong
3
and Hao Wei
4
1
Guangxi XINFAZHAN Communications Group;Key Laboratory of Road Structure and Materials of Guangxi, Nanning
,
China
;
Research and Development Center on Technologies,Materials and Equipment of High Grade Highway
Construction and Maintenance Ministry of Transport,PRC;Guangxi Transportation Research Institute Ltd, Nanning
,
China
;
2
College of Civil Engineering and Architecture,Guangxi University, Nanning,China; *Corresponding author
3
Key Laboratory of Road Structure and Materials of Guangxi, Nanning
,
China
;
Research and Development Center on
Technologies,Materials and Equipment of High Grade Highway Construction and Maintenance Ministry of
Transport,PRC;Guangxi Transportation Research Institute Ltd, Nanning
,
China
;
4
Guangxi Transportation Research Institute Ltd, Nanning
,
China
;
Keywords: Road Engineering; Residual Flexural Strength;Fatigue Life; Loading-High Temperature- Wetting-Drying
Cycle; Pavement Concrete
Abstract: Research on the residual flexural strength and fatigue life of pavement cement concrete in Guang Xi region
under loading-high temperature-wetting-drying cycle condition to obtain the pavement concrete fatigue
strength damage and the residual life prediction model. Based on defining fatigue strength damage variable
and constructing residual flexural strength model, the nonlinear mathematical equation between residual
flexural strength and such parameters as number of loading, placing time in high temperature and wetting-
drying environment is established. Results showed that it can better reflect the decreasing process of
pavement cement concrete strength after fatigue damage. The S-N curvilinear equation and failure
probability were introduced to analyze the fatigue life of pavement cement concrete, results indicated that
the single logarithmic equation can be used to predict the fatigue life accurately with different probability,
and it accord with the Weibull distribution. the specific double parameters in Weibull distribution function
was given for pavement concrete fatigue life in this multi-field environment.
1 INTRODUCTION
Cement concrete pavement isa linear structure
exposed to traffic loading and atmospheric
environment. The performance variation of
pavement during used has important reference
significance for the pavement maintenance, and the
durability of concrete pavement under long term
fatigue is a problem that people pay close attention
to all the time, for example Baluch(2002) et
al.[1],Shi (1990)[2],Li(2002)[3]. The United States
has set up a special committee to study the problem
of concrete fatigue in 1947.Shortly thereafter, China
Academy of Railway Sciences Li and Che(1999)[4],
Harbin Institute of TechnologyJia(2009)[5], Dalian
University of TechnologyMeng(2006)[6] and other
units Pan and Qiu(2006)[7],Meng and
Song(2009)[8],JOAN and CESAR[9],Chen et
al.(2005)[10],Zheng et al.(2007)[11]also carried out
a series of experimental research on concrete
fatigue. In recent years, it has become a mature
method to study the evolution of fatigue damage of
concrete by using damage mechanics theory. On the
basis of the theory that the damage of concrete is
assumed to be the progressive accumulation of
damage, the damage variable is introduced to
quantify the damage degree of concrete.
Guangxi is located in the subtropical monsoon
climate zone, the cement concrete pavement is
subjected to the fatigue failure of the loading, high
temperature and wetting-drying cycle for a long
time. The study on fatigue performance of cement
concrete pavement in high temperature and humid
area under loading, high temperature and wetting-
drying cycle has not been reported. In this paper, the
fatigue performance of pavement cement concrete
under loading, high temperature and wetting-drying
cycle is studied. Based on continuum medium
damage mechanics theory, the damage degree of the
concrete is evaluated by defining damage variable.
The fatigue damage evolution model to reflect the
damage degree of concrete and the residual flexural
tensile strength, and the prediction model of fatigue
life of cement concrete pavement under three factors
are established. These models provide the basis for
evaluating the fatigue damage mechanism and
predicting the remaining life of concrete pavement.
2 EXPERIMENTAL RAW
MATERIALS AND CONCRETE
MIXTURE RATIO
2.1 Raw Material
The experimental raw materials are Qinling P.O
42.5R, YaozhouChangcheng S95 powder,
DatangHancheng first grade fly ash, Chuangqi
crushed stone which maximum nominal size is
19mm, Kaidi SDSP-1 high performance water
reducer (26% water reduction rate), municipal tap
water..
2.2 Concrete Mixture Ratio
According to the design of the two kinds of traffic
grade pavement, the concrete with 28 day flexural
tensile strength of not less than 4.5 MPa and 5.0MPa
was prepared in this experiment. The concrete mix
ratio data through endurance performance
optimization is list in the Table1.
Table1: Optimum mix proportion of concrete based on durability.
Sample
number
Wat
er
binder
ratio
ceme
nt
Powd
er
fly
ash
water
coarse
aggregate
san
d
wate
r reducer
Kg/m
3
C1 0.34 315 63 42 0.8 1114 734 2.52
C2 0.34 285 57 38 129 1185 726 2.28
3 FATIGUE TEST METHOD
The test method based on “highway engineering
cement and cement concrete test code”.The flexural
tensile fatigue test was carried out for 90 days after
the standard maintenance of concrete specimens.
The fatigue testing machine is MTS-810 with a
maximum range of 10 tons, the loading fatigue level
is controlled to be 50% and 80% of the maximum
flexural strength, the loading scheme is a sine wave
three point loading, the loading frequency is set to
10HZ, the low stress ratio is 0.1, and the number of
fatigue cycle were 72 thousand times, 144 thousand
times and 216 thousand times respectively.
According to the climate zoning which is high
temperature and humidity in Guangxi. Select the
temperature difference is 32℃-40℃,the Humidity
difference is 60%-80%. The high temperature and
wetting-drying cycle corresponding to the fatigue
loading times were 1 months, 2 months and 3
months respectively. After the fatigue test, the static
tensile strength test was carried out on the universal
testing machine, and the fatigue damage evolution
model of the concrete was established based on the
residual flexural strength.
4 ANALYSIS OF RESEARCH
RESULTS
4.1 Definition Of Fatigue Damage
Variable
Fatigue damage of concrete is quantitatively
described by damage variable. In order to reflect the
fatigue damage evolution process of concrete
strength, the residual strength method is used to
define the damage variable, which is used to
characterize the residual bearing capacity of
concrete after fatigue. Under different conditions of

concrete application, Ravindrauses attenuation of
splitting strength of concrete under fatigue loading
to define damage variable, Lu et al.(2002)[12], Zhao
et al.(1999)[13] proposed static compressive residual
strength to define the damage variable, but the
control index of the mechanical properties of the
cement concrete pavement is the flexural tensile
strength. the results of the previous tests also
confirmed that the residual flexural tensile strength
of cement concrete pavement is decreasing under the
three factors of loading, high temperature and
wetting-drying cycle. Therefore, the residual flexural
strength of concrete is introduced as the damage
variable, and It is defined as the ratio of the concrete
flexural strength attenuation after a certain time to
the initial flexural strength of concrete. The formula
(1) is as follows:
0
0
f
ff
D
σ
σ
σ
−
=
(1)
σ f0: Flexural strength of concrete specimens in
initial state
σ f :Residual flexural strength of concrete
specimens subjected to damage
4.2 Residual Flexural Tensile Strength
Damage Model of Concrete Under
Loading ,High Temperature and
Wetting-Drying Cycle
4.2.1 Variation of Residual Flexural
Strength of Concrete Under Loading,
High Temperature and wetting-Drying
Cycle
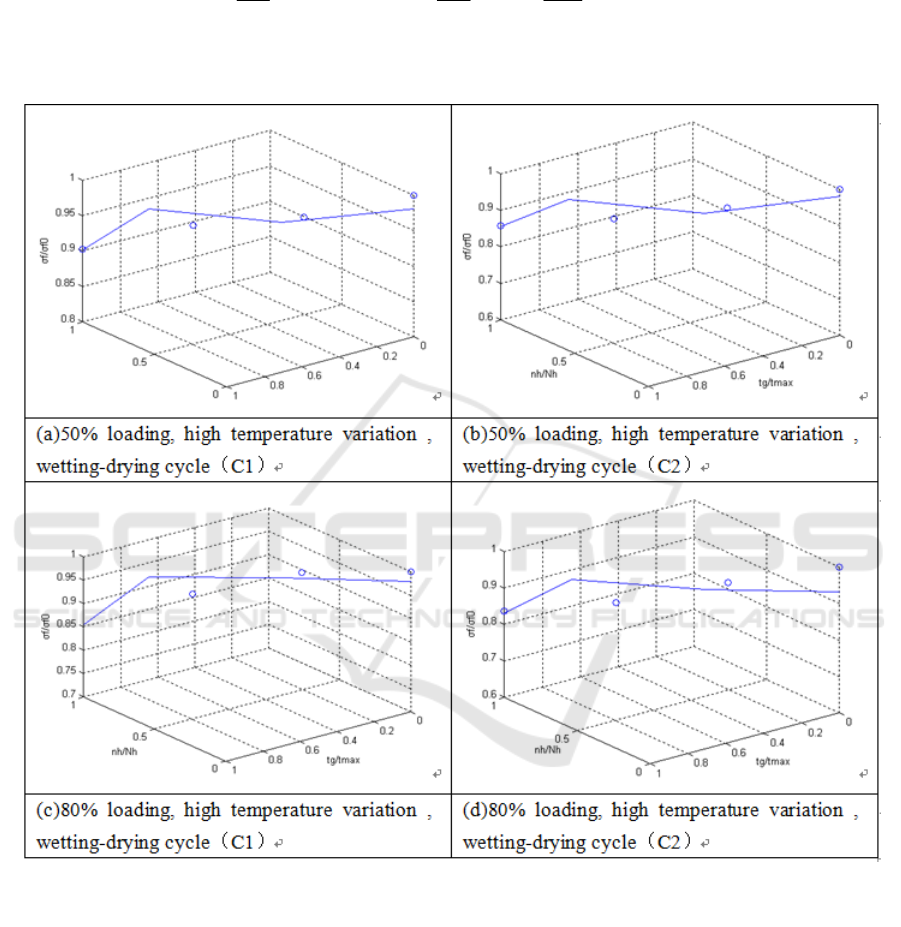
Scattered points distribution in Figure 1(a)-(d)
shows the variation law of the residual flexural
strength of C1 and C2 concrete under loading, high
temperature and wetting-drying cycle. Under this
condition, the flexural tensile strength of concrete
decreases with the increase of time, 80% stress level
significantly accelerated damage to concrete, the
lower the strength grade of concrete performance is
more significant. Under 50% and 80% stress level,
C1 concrete flexural strength decrease by 11.6% and
2.5% respectively, C2 concrete flexural strength by
10.4% and 4.8% respectively, compared with the
condition under loading of single factor. C1 concrete
flexural strength decrease by 33.4% and 3.4% lower
respectively, C2 concrete flexural strength by 31.9%
and 4.9% respectively, compared with the conditions
under loading and high temperature of double factor.
Compare the effects of the three factors, the order of
influence degree of concrete flexural tensile strength
is loading<high temperature<wetting-drying cycle.
When evaluating the mechanical properties value of
cement concrete pavement changing with time under
the condition of high temperature and wetting-
drying cycle,only consider the loading or consider
the effect of loading and temperature is not enough.
So it is necessary to introduce an influencing factor
to consider the humidity factor, and in the existing
two factors superimposed wetting-dryingcycle, will
produce a doubling damage effect.
4.2.2 Decreasing Model of Residual Flexural
Strength of Concrete Subjected to
Loading, High Temperature and
Wetting-Drying Cycle
Three variables of loading, high temperature and dry
wet cycle are needed in this model. Due to the
humidity and temperature have the characteristics of
adaptability and simultaneity,therefore, the residual
flexural tensile strength damage model of cement
concrete pavement is designed as two function
combinations: δ=F[f(nh), f(t)],n represents the
number of fatigue loading, t represents the time of
high temperature wetting-drying cycle.
The modeling idea is as follows: Query existing
literature, the concrete strength and the fatigue
loading approximate relation of power function.
Preliminary test indicates that there is a linear
relationship between the strength temperature,
humidity and the power exponent of time. Fatigue
damage formula under loading, high temperature
and wetting-drying cycle is as follows:(2)
(2)
δ/δf: The ratio of residual tensile strength to
maximum flexural tensile strength
nh/Nh: The ratio of loading times to fatigue life
t/tma: The ratio of the operating time and the
maximum test period under high temperature
wetting-drying cycle
Multiple regression analysis (Formula 3-6) was
used to calculate the results, the complex correlation
coefficient is above 0.88. Table 2 shows the
comparison between the experimental values and the
predicted values using regression models, the results
show that the maximum prediction error is below
cb
h
h
f
t
t
N
n
aD )()1(1
max
•−•=−=
σ
σ

6.5%. It shows that the model has high prediction
accuracy. Figure 2 (a) - (d), the curve indicates the
change in the predicted value.
Fig. 1: Effect of loading, high temperature and wetting-drying cycle on the residual flexural tensile strength of concrete
(R
2
=0.935)
(C1 concrete under 50% loading high temperature difference wetting-drying environment)(3)
(R
2
=0.854)
(C2 concrete under 50% loading high temperature difference wetting-drying environment)(4)
(R
2
=0.944)
028.0
max
012.0
)()1(989.011
t
t
N
n
D
h
h
f
•−•−=−=
σ
σ
048.0
max
017.0
)()1(975.011
t
t
N
n
D
h
h
f
•−•−=−=
σ
σ
001.0
max
018.0
)()1(983.011
t
t
N
n
D
h
h
f
•−•−=−=
σ
σ
(C1 concrete under 80% loading high temperature difference wetting-drying environment)(5)
(R
2
=0.833)
(C2 concrete under 50% loading high temperature difference wetting-drying environment)(6)
Fig. 2: The residual flexural tensile strength prediction of concrete underthe loading, high temperature and wetting-drying
cycle environment.
037.0
max
020.0
)()1(968.011
t
t
N
n
D
h
h
f
•−•−=−=
σ
σ
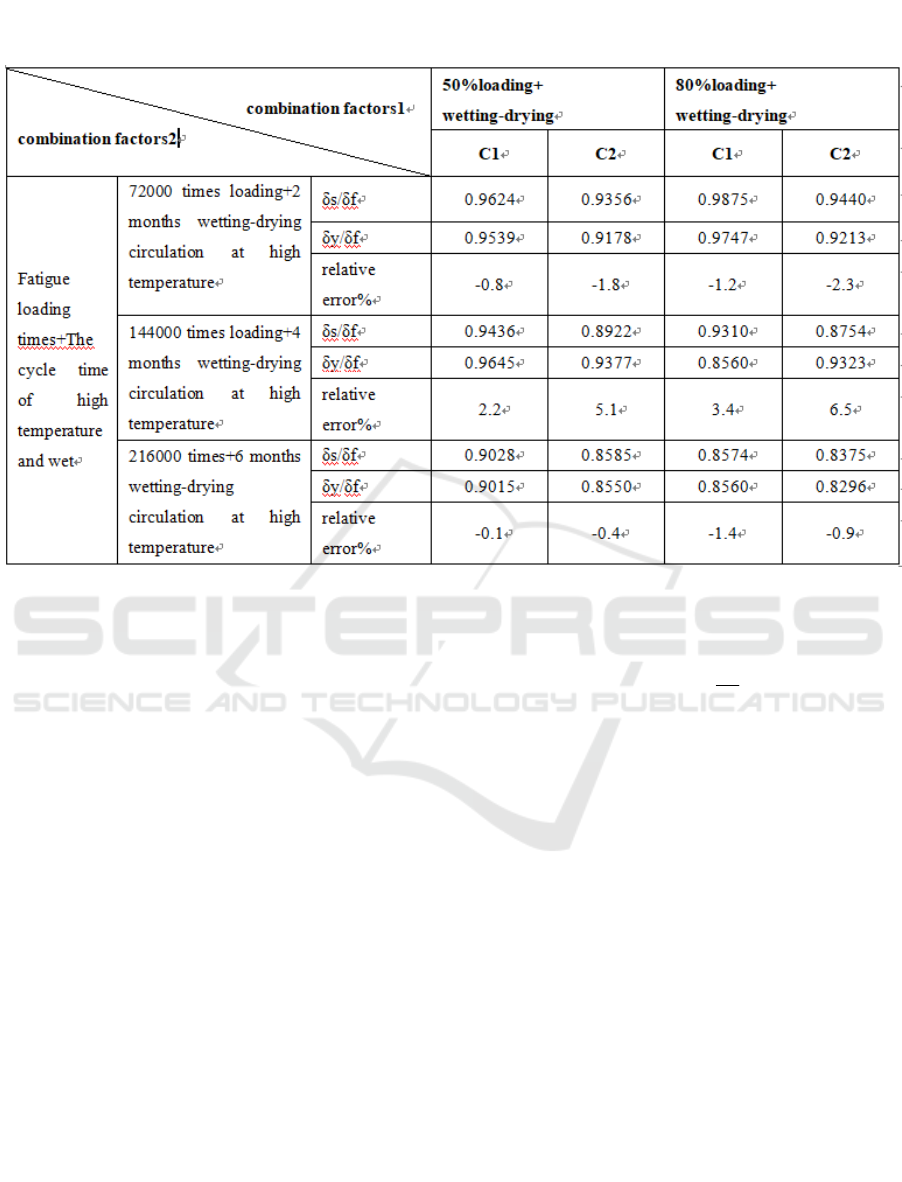
Table 2 Under the influence of three kinds of factors, such as loading, high temperature and wetting-drying cycle, the
predicted value of the damage model is compared with the experimental value.
Note:δsrepresents the flexural tensile strength of test, δy represents the predicted flexural tensile strength, δf represents the
ultimate flexural tensile strength
4.3 Fatigue Life Prediction Model of
Pavement Cement Concrete Under
Loading High Temperature and
Wetting-Drying Cycle.
In the 1850s, the German scholar Whǒler put
forward the concept of fatigue limit and characterize
the s-n curve equation of the fatigue life,. At present,
there are two expressions of concrete fatigue
equation (7) and (8), and the physical meaning of
each parameter is clear, so it is widely used.
However, due to the heterogeneity of concrete, the
fatigue life of discrete data is very large. In order to
model can better reflect the project objective
uncertainty, Weibull, a Swedish scholar, proposed a
two-parameter Weibull distribution function(9) with
a probabilistic physical quantity in 1939.Take
double logarithm of either side of the equation, if the
linear rule is satisfied, the test data are in accordance
with the Weibull distribution.
NbaS lg−=
(7)
NbaS lglg −=
(8)
⎥
⎥
⎦
⎤
⎢
⎢
⎣
⎡
⎟
⎠
⎞
⎜
⎝
⎛
−−=
α
u
N
NP exp1)( (9)
N represents fatigue life, s represents Stress
level, a represents Height of fatigue curve (The
higher the value, the better the fatigue performance
of concrete), b represents the fatigue curve of the
speed of change (The higher the value, the more
sensitive to the stress level), P (N) Failure
probability, α is the slope of the Weibull function at
the stress level S, u presents dimension parameters.
In this paper in order to better compare the
advantages and disadvantages of the model,
regression analysis was performed for each model.
At the same time, in order to improve the accuracy
of the equation, the experimental test of the three
factors condition is added when the level is 0.7,
And each condition choose five samples for fatigue
test, The formula for calculating the failure
probability is P=i/(k+1)(I is the ith failure sample
ordinal, K is the total number of samples).

Table 3 fatigue life equation of concrete under loading high temperature and wetting-drying cycle.
Table4. Concrete probabilistic fatigue equation under loading hightemperature and wetting-drying cycle
Under the three conditions of loading, high
temperature and wetting-drying cycle and based on
the least square method,the fatigue life equation of
concrete is obtained to calculate the failure
probability of concrete. The correlation coefficient is
between 0.8690-1.0000 shown in Table 3, which has
high prediction accuracy and Using single
logarithmic equation has higher precision of
prediction. Therefore, in this paper, the single log
equation is recommended to predict the fatigue life
of cement concrete pavement under the condition of
loading, high temperature and wetting-drying cycle.
By using the Weibull distribution function for
data regression analysis. The mathematical equation
between the probability and the fatigue life under
different stress levels is shown in Table 4.The linear

correlation coefficient is above 0.963. It can be seen
that the fatigue life of pavement cement concrete is
more consistent with the Weibull distribution
function under the conditions of loading, high
temperature,
dry - wet cycle. In order to evaluate the stress level
and fatigue life of concrete under the conditions of
loading, high temperature, dry-wet cycle and
different failure probability, the drawing of the S-N-
P curve is shown in Figure 3.
Figure 3 S-N-P curve of pavement cement concrete under loading, high temperature and wetting-drying cycle
5 CONCLUSIONS
Research and analysis of residual fatigue strength
model and fatigue life prediction model of cement
concrete pavement under under the conditions of
loading, high temperature, wetting-drying cycle, the
main conclusions are as follows.
(1)It is feasible to use the residual bending
strength as a fatigue damage variable to characterize
the mechanical properties of pavement cement
concrete.The maximum prediction error is less than
6.5% when using the nonlinear equation of fatigue
damage of concrete subjected to loading, high
temperature and dry wet cycles to predict the
residual flexural strength of concrete under fatigue
loading. It can better reflect the attenuation law of
fatigue strength of cement concrete pavement.
(2)The single-logarithmic S-N curve equation
has higher prediction accuracy when calculate the
fatigue life of pavement cement concrete under the
conditions of loading, high temperature and dry-wet
cycle.
(3)The fatigue life of pavement cement concrete
under the conditions of loading, high temperature
and dry-wet cycle conforms to Weibull distribution.
The correlation coefficient of failure probability and
fatigue life of concrete under different stress levels
is above 0.945.
ACKNOWLEDGEMENTS
This research was supported by Guangxi Natural
Science Foundation under Grant No. GUIKE
AB17292032,GUIKE AC16380109 and National
Nature Science Foundation of China(51278059).
REFERENCES
1. Baluch M H, Al Gadhib A H . Khan A R . et
a1.CDM model for residual strength of concrete
under cyclic compression [].Cement and Concrete
Composites,2002,25(12):503-512
2. Shi Xiao-ping. Study on flexural fatigue behavior of
cement concrete[J]. China Civil Engineering
Journal,1990,23(3):11-22.
3. Li Zhao-xia. Damage mechanics and its
application[M]. Beijing: Science Press. 2002:12-41
4. Li Yong-qiang,CheHui-min. Study on concrete fatigue
performance under constant amplitude repeated
stress[J].Journal of the China Railway
Society,1999,21(2):76-79
5. Jia Shao-wen. Continuum damage mechanics-based
fatigue damage model for concrete[D]. Harbin: Harbin
Institute of Technology,2009.
6. Meng Xian-hong. Experimental and theoretical
research on residual strength of concrete under fatigue
loadinging[D]. Dalian: Dalian University of
Technology, 2006.

7. Pan Hua, Qiu Hong-xing. Fatigue model of concrete
based on continuum damage mechanics[J]. Journal of
Southeast University(Natural Science Edition),
2006,36(4):605-608
8. Meng Xian-hong,,Song Yu-pu. Damage model for the
residua strength of concrete under compression fatigue
loadinging[J]. Journal of Harbin Institute of
Technology(New Series),2009,25(1):12-16.
9. JOAN R C.CESAR C M.Probabilistie response of
prestressed concrete bridges to fatigue[J]. Engineering
Structure,1998,20(11):940-947.
10. Chen Shuan-fa, Zheng Mu-lian, Wang Bing-gang.
Formulation and application of fatigue equation for
porous cement concrete[J], Journal of the Chinese
ceramic society, 2005,33(7):827-831
11. Zheng Mu-lian, Sun Jia-wei, Wang Bing-gang. Study
on formulation and application of fatigue equation for
lean concrete[J]. Journal of Xi’an University of
Architecture &Technology(Natural Science Edition),
2007,39(1):92-97.
12. LU Jing-zhou,LINGao,WANGZhe,XIAO Shi-yun. On
the reduction of strength of concrete and supersonic
inspection due to triaxial compressive loading
history[J].Engineering Mechanics.2002,19(5):52-57
13. Yong-li ZHAO,WeiSUN.Establishment of fatigue
damage equation of concrete materials[J].Journal of
Chongqing Jiaotong University,1999,18(1):17-22.
