
Factors to Increase Tourist Loyalty in North Sumatera
Onan Marakali Siregar, Selwendri and M. B. Abdillah
Department of Business Administration, Universitas Sumatera Utara, Jl. Dr. A. Sofian No. 1a, Medan, Indonesia
Keywords: Tourist Loyalty, Tourism Destinations, North Sumatera Province.
Abstract: North Sumatra Province is an area that has several attractions, both natural and cultural attractions. Some
well-known tourist objects from abroad to foreign countries such as Lake Toba, and Mount Lawang with
Sumateran orangutans. While is one of the gateways to reach tourist destinations in North Sumatra
Province, including the city that has the Maimun City Palace and the Great Mosque that represents the
history of the continuity of the Malay Kingdom, the Tjong A Fie House and the colonial colonial buildings
that have talked about for years. This study aims to analyze and determine how to encourage tourists,
destination images, and tourist satisfaction with tourist loyalty in North Sumatra Province. This research
uses quantitative methods with data analysis methods. Multiple linear regression because it is based on two
or more independent variables on variables, after that the data processing technique uses SPSS version 22 as
a tool. This study found that the results consisted only of motivation variables which did not have a
significant effect, while other variables had a significant effect on tourist loyalty. The results showed that
the independent variables consisted of motivation variables (X1), destination image variables (X2), and
satisfaction (X3) positively and significantly towards the variables supported by tourist loyalty (Y) visiting
the tourist area of North Sumatra Province. This study obtained results consisting of the majority of visitors
consisting of students aged 17 to 25 years. Lake Toba, Bukit Lawang, and Berastagi are the dominant
mainstay sectors, and the level of tourist visits to the Province of North Sumatra is still categorized as low.
1 INTRODUCTION
North Sumatera Province is an area that has some
interesting tourism objects, both natural and cultural
tourism. Even some of the tourism objects have been
widely known to foreign countries such as Lake
Toba, which is located in Simalungun District, with
a beautiful panorama of nature and in Langkat
district there is also Bukit Lawang with a unique
Sumateran orang utans, different from Borneo's
orang utan. The city of Medan itself as one of the
gates to various tourist destinations in Sumatra, has a
number of city attractions such as Maimun Palace
with Grand Mosque and Pond King, which is a
witness of the continuity of the Kingdom of Sultan
Melayu. Tjong A Fie with Kesawan area, and old
building that has been hundreds of years.
In the past, Medan was known as a trading city
where there stood a number of plantation company
headquarters such as Tobacco Deli and PT. London
Sumatera, which are famous to foreign countries.
According to data from BPS, the number of foreign
tourists who came to visit North Sumatra in
December 2017 reached 27,978 visits, experienced a
11.95 percent increase compared with the coming in
November 2017 reached 24,991 visits. Nevertheless,
compared with the same month in 2016, the number
of foreign tourists in December 2017 dropped 3.36
percent, from 28,950 visits in December 2016 to
27,978 visits. For the period of January to December
2017, the number of foreign visitors who came to
visit North Sumatera increased by 12.02 percent
compared to the same period in 2016, namely from
233,643 visits in the year 2016 to 261,736 visits in
2017.
Looking at the number of tourists who have
increased in the year 2017, the tourism sector can be
said to have great potential to be developed as one of
the regional sources of income. Utilization of
resources and tourism potential of the region is
expected to contribute to economic development.
Some of the tourist destinations above is a location
that is already known by tourists, there are still some
areas of tourism location again in North Sumatra.
This can certainly increase the regional revenue in
North Sumatera. But the head of the statistical (BPS)
Syech Suhaimi said the visit of foreign tourists to
Siregar, O., Selwendri, . and Abdilah, M.
Factors to Increase Tourist Loyalty in North Sumatera.
DOI: 10.5220/0010013901990204
In Proceedings of the 3rd International Conference on Social and Political Development (ICOSOP 3 2019) - Social Engineering Governance for the People, Technology and Infrastructure in
Revolution Industry 4.0, pages 199-204
ISBN: 978-989-758-472-5
Copyright
c
2020 by SCITEPRESS – Science and Technology Publications, Lda. All rights reserved
199

North Sumatera period of January-February 2018
down compared to the same period 2017 is 32,925
people, while January – February 2017, foreign
tourists in North Sumatera amounting to 37,916
visits. The tourists enter from several entrances in
North Sumatera, namely foreign tourists from
Kualanamu Airport in the period from January to
February 2018 as much as 32,437 from the same
period 2017 that as many as 34,137 people. From the
port Belawan also dropped to only 20 people from as
many as 2,795 people in the same period 2017.
While from Tanjung Balai Asahan lived 468 people
from the same period 2017 that 984 visits.
Chairman of the Association of travel Companies
or Asita North Sumatera, Solahuddin Nasution said,
referring to the number of visitors visiting at the
beginning of 2018, North Sumatera, it is very
difficult to reach the target. One million foreign
tourists visits. He also said the need for a more
vigorous promotion and continued. Enhance and
increase the number and quality of tourism objects
in the various areas of North Sumatera. Moreover,
Lake Toba that is being addressed by the
Government today is not able to attract maximum
visitors. This situation is very concern because
North Sumatera has a geographical advantage is not
able to increase foreign tourists visit. The efforts of
North Sumatra province in promoting the region
both overseas and to other provinces in Indonesia
have often been done. This business has not been
able to increase foreign tourists visit.
From the phenomenon, the decrease in the
number of tourists North Sumatera, but the
promotion has been conducted by the local
government, then the author wants to examine about
the motivation of traveling, the image of the tourist
area that becomes a unique attraction for tourists and
satisfaction Tourists who come to visit North
Sumatera. If you can see how the Travellers views
and satisfaction are perceived by tourists, this can
affect the number of tourists visiting North
Sumatera. The aim of the research done is to look at
and look for factors that can increase the loyalty of
tourists to visit back to tourist destinations in North
Sumatera.
2 THEORETICAL REVIEW
2.1 Tourist Decisions in Regional
Selection of Tourist Destinations
According to Mill (2000), the attraction is one of the
factors that greatly affects the tourists who come to a
tourist destination area. The function is to meet the
needs of tourists during their stay for a while in
Tourist destinations visited. The facility is a factor
that significantly affects consumers to be able to
purchase the products offered. With the availability
of means that will encourage potential tourists to
visit and enjoy the tourist objects with a relatively
long time, the accessibility is all that can provide
tourists to come to visit in a destination area
Tourism (DTW).
2.2 Tourists Motivation to Travel
Motivation is a key part of the travellers behavioral
process (Hsu, Cai and Li, 2009). Psychologically,
motivation arises when a consumer wants to fulfill a
need. Tensions are generated and arise from the need
to create a consumer effort to meet that need.
Crompton (in Nguyen, 2016) divides the motivation
factor of the journey into two groups namely push
factor and pull factor. He defines push factor/driving
factor (also referred to as sosio-psychological) as a
self-escape, self-exploration, relaxation, prestige,
regression, increased kinship, and interaction Social.
On the other hand, pull factor also referred to as
external motivation (Nguyen, 2016). Hsu et al.
(2009) adopted a model from gnoths, emphasizing
the relationship between hope, motivation, and
attitude (EMA's model) to explain the motivation of
the journey. They argue that:
1. Hope tourists to visit the tourist destinations out
of the country have a direct influence on their
motivation to visit the destination.
2.
The motivation of tourists has a direct effect on
their attitude towards visits to the destination.
3.
Travellers ' expectations for visiting an outbound
destination have a direct effect on their attitude
towards a visit to their destination.
4.
Motivation has the effect of mediation on the
relationship between hope and attitude.
2.3 Tourist Destination Imagery
The image of the destination area (perceived
destination image) is a person's impression of a
place, consisting of beliefs, ideas, and Prejudice
Lawson & Baud-Bovy (Nguyen, 2016). Imagery
will help travellers consider whether the destination
area matches their mental image and recreational
demands. According to Ahmed (Nguyen, 2016). The
concept of imagery evolved from organic imagery,
through induced imagery, to more complex imagery.
According to Gunn (Nguyen, 2016), the organic
ICOSOP 3 2019 - International Conference on Social Political Development (ICOSOP) 3
200
imagery deals with traveler's impressions of the
destination without visiting the place.
2.4 Quality of Tour Services
According to Supranto (1997) quality is a word for
service providers is something to be done well. The
application of quality as the nature of product
appearance or performance is a major part of the
company's strategy in order to achieve sustainable
excellence, either as a market leader or as a strategy
to continue to grow.
The dimension of service quality developed by
Parasuraman et.al (1988) identifies five dimensions
of service quality, namely:
1. Physical evidence (tangible), which describes the
physical facilities, equipment, and appearance of
the personnel as well as the presence of users.
2.
Reliability, which demonstrates the company's
ability to provide service accurately and reliably,
can be trusted, responsible for what it promises
to never deliver an excessive promise and always
meet Promise.
3.
Responsiveness (responsiveness), which includes
the desire to assist the customer in providing fast
and precise service, always give the right and
immediate attention, and about the customer.
4.
Assurance, which includes knowledge and
politeness of workers and the ability of workers
to provide services that give rise to the trust of
the customers. This dimension reflects corporate
competence, hospitality to customers and the
security of its operations.
5.
Empathy (empathy), which shows the degree of
attention given to each customer. This dimension
also reflects the ability of the worker to dive into
the feelings of customers as if the worker itself
experienced it.
2.5 Overall Satisfaction of Tourism
In particular, "tourism satisfaction" refers to the
emotional state of travellers after exposure to
opportunities or experiences (Baker and Crompton,
2000). When customers experience attributes of
hospitality experience, they form a set of
independent impressions on each one and compare
them with the expectation of the same attributes
(Pizam & Ellis, 1999 in Nguyen 2016). Consumer
Satisfaction Index (CSI) is very useful for corporate
internal purposes. Examples of this are monitoring
service improvements, employee's strikers and
bonuses as a description representing customer's
overall satisfaction level. CSI is used to thoroughly
determine the level of visitor satisfaction by looking
at the level of importance of product/service
attributes.
CSI is an index to determine the level of
customer satisfaction thoroughly with an approach
that takes into consideration the level of importance
of the measured attributes. The Consumer
Satisfaction Index (CSI) is very useful for corporate
internal purposes. Examples of this are monitoring
service improvements, employee's strikers and
bonuses as a description representing customer's
overall satisfaction level.
To know the magnitude of CSI, you can do the
following steps (Aritonang, 2005):
1. Determining the Mean Importance Score (IE)
each
variabel,
2. Create a Weight Factors (WF) per variable. This
weight represents the percentage of MIS values
per variable for the total MIS of all variables,
3. Determining the Mean Satisfaction Score (MSS)
of each attribute,
4. Create the Weight Score (WSk) of each variable.
This weight is a multiplication between WFk and
MSSk, and
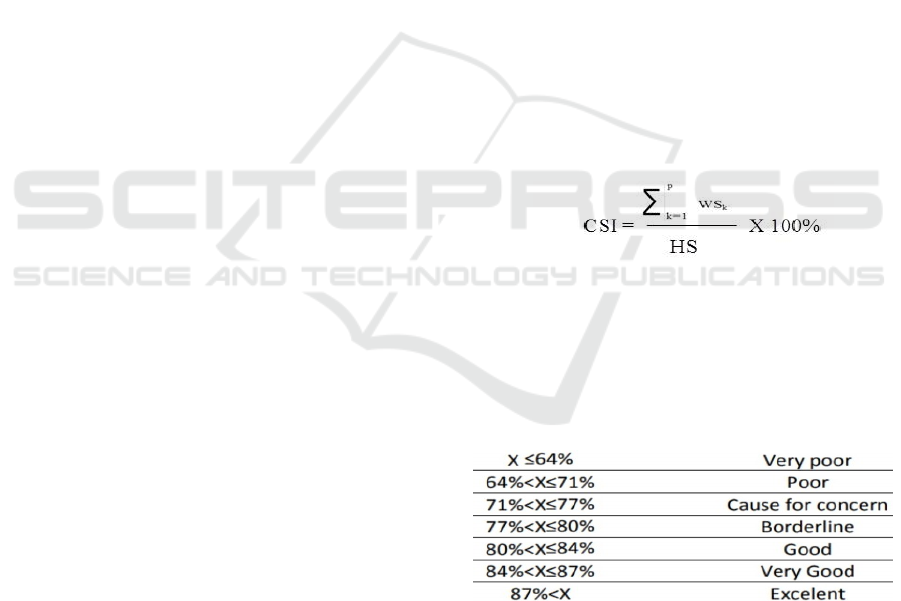
5. Determine Customer Satisfaction Index (CSI)
Figure 1: Equation CSI
where HS (Highest scale) = The maximum scale
used (Octaviani, 2006).
Table 1: Customer satisfaction index interpretation
number.
3 METHOD
The research methods used are quantitative and
causal research that aims to collect, analyze,
classify, and map data about the prevailing
conditions, practices, beliefs, processes, trends, and
cause and effect relationships. Research will be done
Factors to Increase Tourist Loyalty in North Sumatera
201

in four tourist sites of North Sumatra, namely Lake
Toba, Bukit Lawang, Berastagi and the city of
Medan. The population in this study is visiting
tourists and traveling to these locations where the
amount is not known for sure. In this study, formula
of assessment interval as follows according
Supramono and Haryanto (2003).
n
n
1,96
0,5
0,5
0,1
n96,04
Description:
N: Number of samples
Zα: The normal standard value of the amount
depends α
P: Estimator of population proportions
q: 1 – p
D: tolerated irregularities
Based on the above calculations, the minimum
number of samples in this study was 96.04. To
facilitate the calculation and retrieval of samples,
each region was taken a number of 30 samples, so
that the total sample for 4 research areas became 120
samples.
Regression analyses are used to measure the
strength of the relationship between two or more
variables, and to indicate the direction of the
relationship between the dependent variables and the
independent variables. Multiple Linear regression is
based on the influence of two or more free variables
against bonded variables. Here's a formula to see
multiple analyses:
Y = a + b_1 X_1+ b_2 X_2+ b_3 X_3 + e
Y = tourist loyalty
X
= Tourist Motivation
X
= Destination Imagery
X
= Tourist Satisfaction
a = constant
b1,b2,b3 = Regression coefficient
e = Standard Error
4 RESULTS AND DISCUSSION
4.1 Multiple Linear Regression
Analysis
Multiple linear regression analyses are used in this
study for the purpose of knowing whether there is an
influence on independent variables of motivation
(X1), Destination image (X2), and Satisfaction (X3)
for the dependent variable of Travellers loyalty (Y).
Table 2: Multiple linear regression.
Model
Unstandardize
d Coefficients
Standardize
d
Coefficients
T
Reserve
s the.
B
Std.
Error
Beta
1
(Constant)
2.315
1.105
2.09
4
.038
Motivation
-.019
.053 -.032 -.363 .717
Destination
image
.260
.058 .413
4.50
6
.000
Satisfactio
n
.155
.040 .353
3.90
7
.000
A. Dependent variables: Tourist loyalty
Source: Data processing results (2019).
According to the Table 2, the results if written in
the form of standardized of the equation regression
is as follows:
Y - 4,836 + 0.375 X1 + 0.322 X2
The multiple regression equation is described as
follows:
1. A positive constant () value of 2.315, shows that
positive effect is the free variable motivation,
destination image, and satisfaction. When a
variable is free to rise or influence in one unit,
the travellers loyalty variables will be increased
or fulfilled.
2. The value of the coefficient of X1 (B1) of –
(0.019) indicates that the motivation variable
negatively affects the travellers loyalty variables
or in other words if the demotivated value of 1%
will increase the travellers loyalty by 0.019.
3. The coefficient value of X2 (B2) of 0.260
indicates that the destination image variable has
a positive effect on a travellers loyalty variable
or in other words if an increased destination
image value of 1% will increase loyalty interest
Travelers of 0.260.
4. The coefficient value of X3 (B3) of 0.155
indicates that the satisfaction variable has a
positive effect on travellers loyalty variables or
in other words if the increased satisfaction value
of 1% will increase the interest of the tourist
loyalty of 0.155.
ICOSOP 3 2019 - International Conference on Social Political Development (ICOSOP) 3
202
4.2 Hypothesis Testing
4.2.1 Partial Test (Test T)
The decision making criteria is:
1. H0 is rejected if the count T value < T value of
table or sig value > 0.05 at = 5%
2. Ha accepted if the value of T count > t Value of
table or sig < 0.05 at = 5%
Error rate () = 5% and degrees of freedom (DF)
= (n-k)
n = number of samples, n = 120
k = number of variables used, k = 4
Free degrees (DF) = n – k = 120 – 4 = 116
So t the
table
used is t (5%) (116) or T 0.05 (116)
= 1.658.
Table 3: Partial test (Test T)
Model
Unstandardized
Coefficients
Standardized
Coefficients
T
Reserves
the.
B
Std.
Error
Beta
1
(Constant) 2.315 1.105
2.094
.038
Motivation -.019 .053 -.032
-.363
.717
Destination
image
.260 .058 .413
4.506
.000
Satisfaction .155 .040 .353
3.907
.000
A. Dependent variables: Tourist loyalty
Source: Data processing results (2019).
Based on the Table 3can be seen the influence
of each variable partially is as follows:
1.
Known to the significant value of the motivation
variable is sig. of 0.717 >0.05 and the
calculate
value of T – (0.363) < T
table
1.658 then H1 is
rejected.
2.
Known to the significant value of the destination
image variable that is sig. 0.000< 0.05 and the
calculated
T value of 4.506 > t
table
1.658 then H2
Received.
3.
Known to the significant value of satisfaction
variables i.e. sig. 0.000 <0.05 and the
calculated
T
value of 3.907 > t
table
1.658 then H3 is accepted.
4.
In accordance with the existing theory it is
apparent that the destination image variables and
satisfaction have significant effect on the
traveller's loyalty interests.
4.2.2 Simultaneous Test (F test)
The decision making criteria is:
1. H0 rejected if value F is calculated < F value of
table or sig value > 0.05 at = 5%
2. Ha is acceptable if the value of F count > The
value of F table or sig < 0.05 at = 5%
3. F
table
can be viewed at = 0.05
Degree of Pemtell = k – 1 = 4-1 = 3 degrees
denominator = n – k = 120-3 = 117. F
table
= 2.68
Table 4: Simultaneous test (ANOVA).
ANOVA
b
Model
Sum of
Squares
df
Mean
Square
F
Reserves
the.
1
Regression 167.149 3 55.716
30.898
.000
a
Residual 209.176 116 1.803
Total 376.325 119
Source: Data processing results (2019).
Based on Table 4, it can be seen the influence of
each variable can simultaneously be seen that the
value of Fcount (30.898) > Ftabel (2.68) or sig of
(0.000) < (0.05). Attributed to the existing theory, it
shows that the free variables consisting of
motivational variables (X1), Destination image
variables (X2), and Contentment (X3)
simultaneously have positive and significant effect
on the bonded variable that is loyalty Travellers (Y).
4.2.3 Test Determinations (R
2
)
The calculation of the Coefisien determination to
determine how much motivation, destination image,
and satisfaction towards travellers loyalty.
Table 5: Test Determinations (R
2
) X1, X2, X3 Y
Model Summary
b
Model R R Square
Adjusted
R Square
Std. Error of
the Estimate
1
.666
a
.444
.430 1.34285
A. Predictors: (Constant), satisfaction, motivation,
destination image
Source: Data processing results (2019).
According to the Table 5, it can be seen that R
value is 0.666 (66.6%), where the value of this
correlation coefficient indicates that the relationship
between motivation, destination image, and
satisfaction towards tourist loyalty Is strong. The
value of R Square or the value of the coefficient of
determination above shows that the tourist loyalty
variable 44.4% can be explained by the motivation
variable, destination image, and satisfaction, while
Factors to Increase Tourist Loyalty in North Sumatera
203

the remainder is 55.6% Influenced by other variables
not contained in this study.
5 CONCLUSION
Based on the results of the research, data processing
and analysis and discussion have been done as
follows:
1. Based on the results that of the three free
variables are motivation, destination image, and
satisfaction is seen that only Motivation
variables that do not have a significant influence,
while other variables have a significant effect on
the loyalty of tourists visiting the tourist areas of
North Sumatera province. Associated with
existing theories, simultaneous results indicates
that the free variables consisting of motivational
variables (X1), Destination image variables (X2),
and Contentment (X3) simultaneously have a
positive and significant effect on the bound
variable i.e. Travellers loyalty (Y).
2. Based on the research that the majority of
tourism visit North Sumatera province is
dominated by women with the highest
percentage whose activity is a student in terms of
age between 17 to 25 years.
3. Based on the research that the tourism site in the
province of North Sumatera in this case Lake
Toba, Bukit Lawang, and Berastagi is the
mainstay sector of tourism that is dominant in the
visit by tourists.
4. Based on the results of the study that the level of
visit to North Sumatera province tourism is
categorized low. This is why travellers are
difficult to decide on loyalty decisions for tourist
sites.
REFERENCES
Aritonang, L.R., 2005. Kepuasan pelanggan, PT
Gramedia Pustaka Utama. Jakarta.
Baker, D.A., Crompton, J.L., 2000. Quality, satisfaction,
and behaviour intentions, Annuals of Tourism
Research, 27(3) 785-804.
Baloglu, S., & McCleary, K.W., 1999. A model of
destination image formation, Annuals of tourism
research, 26(4), 868-897
Baloglu, S., 2001. Image variations of turkey by
familiarity index: informational and experiential
dimensions, Tourism Management, 22, 127 - 133.
Badan Pusat Statistik, 2018. Jumlah kedatangan
wisatawan mancanegara. Retrieved from
http://www.bps.go.id/pressrelease/2018/02/01/1468/ju
mlah-kunjungan-wisman-ke-indonesia-desember-
2017-mencapai-1-15-juta-kunjungan--html
Heath, E., Wall, G., 1992. Marketing tourism destinations,
a strategic marketing planning approach, John Wiley
and Sons, Inc. New York.
Hsu, C.H., Cai, L.A., & Li, M., 2009. Expectation,
motivation, and attitude: A tourist behavioral model.
Journal of Travel Research, 49(3).
Jeng, J., & Fesenmaier, D. R.,2002. Conceptualizing the
travel decision-making hierarchy: A review of recent
developments, Tourism Analysis, 7(1), 15-32.
Mill, R.C., 2000. Tourism, the international business.
(translated by Tri Budi Satrio), Raja Grafindo. Jakarta.
Nguyen, T.T., 2016. Medical tourism: studying the impact
of motivational factors, destination image on perceived
quality and overall satisfaction using sem analysis.
Thesis. California State Polytechnic University,
Pomona.
Parasuraman, A., Zeithaml, V., Berry, L.L., 1988.
SERVQUAL: A multiple-item scalefor measuring
consumer perceptions of service quality, Journal of
Retailing, 64(1), 12-40.
Parasuraman, A., Zeithaml, V., Berry, L.L., 1990.
Delivering quality service, The Free Press. New York.
Sirakaya, E., Woodside, A.G., 2005. Building and testing
theories of decision making by travellers, Tourism
management, 26(6), 815-832.
Septian, D., 2017. Jumlah wisatawan dunia diprediksi
capai 1,8 juta miliar pada 2030. Liputan 6. Retrieved
from http://www.liputan6.com/bisnis/read/2932632/
jumlah-wisatawan-dunia-diprediksi-capai-18-juta-
milyar-pada-2030
Sugiyono, 2012. Metode penelitian bisnis, Alfabeta.
Bandung.
Supranto, J., 1997. Pengukuran tingkat kepuasan
pelanggan untuk menaikkan pangsa pasar, Rineka
Cipta. Jakarta.
Supramono, Haryanto, 2003. Desain proposal penelitian:
Studi pemasaran, Andi. Yogyakarta
Tjiptono, F., 1998. Manajemen jasa, Andi Offset.
Yogyakarta.
Tjiptono, F., 2008. Prinsip-prinsip total quality service,
Andi Offset. Yogyakarta.
Yoeti, O., 2008. Pemasaran pariwisata, Angkasa.
Bandung.
ICOSOP 3 2019 - International Conference on Social Political Development (ICOSOP) 3
204
