
Project Portfolio Selection Considering Return-risk Evaluation and
Multiple-Criteria Decision Analysis
Guilherme Augusto Barucke Marcondes
National Institute of Telecommunications (INATEL), Santa Rita do Sapuca
´
ı-MG, Brazil
Keywords:
Project Portfolio Selection, Mean-Gini, Multi-Criteria Decision, PROMETHEE.
Abstract:
Companies often face a challenge when they need to select their projects for execution because the resources
are not enough for all of them. For supporting decision, they need to employ some form of selecting the
best portfolio to run. There are several proposals in the literature, many allowing an evaluation of efficiency
between expected return and risk. However, these proposals indicate a list of efficient portfolios, but not
the one best suited for execution. On the other hand, multi-criteria analysis methods allow a more specific
indication, but they are difficult to be executed when the number of projects increases. This work seeks to
cover this gap by proposing a selection method that combines the return-risk assessment using mean-Gini
approach, complemented by the application of the multi-criteria decision method PROMETHEE II. The result
is the objective indication of the best project portfolio to be executed by the company.
1 INTRODUCTION
Frequently, companies have a list of projects to be
executed. But, due to resource constraints, they are
forced to select a subset of them (Abbassi et al.,
2014). This need for decision has been one of the
critical problems of project management (Jafarzadeh
et al., 2015). Decision makers need to prioritize
projects and define the best subset to be executed
(Perez and Gomez, 2014). The subset of projects can
be viewed as a portfolio.
Portfolio analysis may manage the risk in a set of
assets to establish which one offers the greatest re-
turn for a certain level of risk or the lowest risk for
a defined level of return. These portfolios are called
efficients. Project portfolios can be evaluated in the
same way of asset portfolios (Eilat et al., 2006).
Markowitz (1952) was a pioneer in proposing an
optimum strategy for maximizing return and min-
imizing risk of portfolios candidates for selection.
Based on his work, an efficient frontier of portfolios
can be found by comparing expected return mean and
the correspondent variance for each portfolio (MV
portfolio). However, MV portfolio has reliable results
only when return are normally distributed or decision
maker utility function are quadratic (Feldstein, 1969).
In this way, while MV portfolio has been well ex-
plored by works as Levy and Levy (2014); Zopouni-
dis et al. (2014), other ones propose alternatives.
The work of Shalit and Yitzhaki (1984) presented
an alternative for portfolio selection by comparing
return mean and Gini coefficient of portfolios under
evaluation (MG portfolio). Its application is less re-
strictive than MV. Investment portfolio selection us-
ing MG can de viewed in Alessandra Cillo (2014).
The same approach applied to project portfolio selec-
tion was used in the works of Ringuest et al. (2004)
and Gemici-Ozkan et al. (2010).
Resources scarcity is a reality in companies (Perez
and Gomez, 2014). In the same sense, Dutra et al.
(2014) state that, in general, there is no enough re-
source for all projects. It highlights the importance
of selecting the best set of projects (portfolio) to be
executed.
Projects selection must be done, naturally, before
knowing their returns. Decision makers decide based
on estimations, which leads to uncertainty, even if
good tools are applied (Kitchenham and Linkman,
1997). In this case, it is important to consider uncer-
tainty in project portfolio selection (Marcondes et al.,
2017).
Project Management Body of Knowledge Guide
(PMBOK
R
) from Project Management Institute rec-
ommends triangular distribution for dealing with un-
certainty in projects (PMI, 2013). It allows consid-
ering worst-case, most-likely and best-case estima-
tion for projects, using a range of value in evalua-
tions (instead of point values). Still in PMI (2013),
264
Marcondes, G.
Project Portfolio Selection Considering Return-risk Evaluation and Multiple-Criteria Decision Analysis.
DOI: 10.5220/0007350802640269
In Proceedings of the 8th International Conference on Operations Research and Enterprise Systems (ICORES 2019), pages 264-269
ISBN: 978-989-758-352-0
Copyright
c
2019 by SCITEPRESS – Science and Technology Publications, Lda. All rights reserved

Monte Carlo simulation is indicated as a tool for
uncertainty evaluation, which is usually used when
mathematical model is difficult (or impossible) to
be treated (Bertrand and Fransoo, 2002; Better and
Glover, 2006).
In despite of return estimation based methods for
project portfolio selection, as in MV and MG portfo-
lios, in general, there are several conflicted criteria to
be evaluated. For supporting this kind of decision, the
literature offers the Multi-Criteria Decision Making
(MCDM) approaches (Behzadian et al., 2010). Pref-
erence ranking organization method for enrichment
evaluation (PROMETHEE) is an MCDM method for
ranking finite set of options under evaluation, among
conflicted criteria. Its application is increasing, based
on the number of published papers in literature (Be-
hzadian et al., 2010).
As PROMETHEE application compares, in all cri-
teria, options pair-by-pair, it can be cumbersome, de-
pending on the number of projects to be evaluated.
For instance, if one evaluates ten projects, there are
1,023 possible portfolios (not considering the option
of no project selected). If twenty projects, the number
of portfolios is 2,047.
Based on it, this work proposes a new method for
selecting a project portfolio to be executed. It applies
first MG portfolio to reach an efficient portfolio list
(the ones which are in MG efficient frontier), con-
sidering uncertainty of estimations by Monte Carlo
simulation (implemented by Python language). For
indicating the best option, over the efficient portfo-
lios, PROMETHEE II is applied. At the end, decision
maker has a ranking of portfolios, indicating from the
best to the worst, for choosing.
The research approach was based on simulation
with a real set of project. M
¨
akinen and Vilkko (2014)
and Marcondes et al. (2018) applied simulation as a
tool for portfolio selection.
The remainder of this paper is organized as fol-
lows. Section 2 presents MG portfolio selection and
PROMETHEE II method. Section 3 explains how to
use triangular distribution for considering uncertainty
in selection. Proposed method is presented in Section
4 and its application using a real projects dataset in
Section 5. Finally, Section 6 concludes this work.
2 PROJECT PORTFOLIO
SELECTION
2.1 Mean-Gini
Mean-Gini portfolio selection considers estimation
of portfolio return for indicating an efficient fron-
tier. Based on return distribution, one can calculate
its mean, indicating expected return, and Gini coeffi-
cient, indicating risk.
Expected return of a portfolio depends on ex-
pected return of each project included in it. Project
expected return is the expected value of its return ran-
dom variable. Portfolio expected return (R
P
) (or port-
folio mean), can be found by Equation (1).
R
P
=
N
∑
j=1
w
j
r
p
j
(1)
where:
• r
p
j
is the expected return of project j;
• w
j
∈ {0, 1} represents the decision of exclude or
include project j in portfolio, respectively.
Gini coefficient is a statistical dispersion measure.
In general, it is largely applied to measure inequality
in income distribution for nation’s residents. Shalit
and Yitzhaki (1984), although its original purpose,
presented an application of Gini coefficient for port-
folio risk analysis. Their application is an alternative
of variance application. Ringuest et al. (2004) state
Gini coefficient is a simple measure and easy to be
applied in decision making process.
Gini coefficient can be calculate by (Shalit and
Yitzhaki, 1984):
Γ = 2cov[R, F (R)] (2)
where:
• R is the portfolio return random variable;
• F (R) is its cumulative probability distribution.
R
P
i
and Γ
P
i
denote the return mean and Gini co-
efficient, respectively, for portfolio i, in MG sense, a
portfolio II is dominated by a portfolio I, if and only
if (Ringuest et al., 2004):
R
P
I
> R
P
II
(3a)
and
Γ
P
I
6 Γ
P
II
(3b)
where at least one of these two conditions (3a) or (3b)
must be satisfied as inequality.
Project Portfolio Selection Considering Return-risk Evaluation and Multiple-Criteria Decision Analysis
265

Non-dominated portfolios are kept in efficient
evaluation, and dominated ones discarded (not ef-
ficient, compare to any other portfolio). Non-
dominated portfolios are considered efficient. They
compose the efficient frontier.
2.2 MCD PROMETHEE
Often, decision makers must select among options
based on several criteria that can be conflicting. For
this situation, literature offers the Multi-Criteria Deci-
sion Making (MCDM) approaches (Behzadian et al.,
2010). Preference ranking organization method for
enrichment evaluation (PROMETHEE) is an MCDM
outranking method when evaluating, among con-
flicted criteria, a finite set of alternatives.
There are some PROMETHEE options.
PROMETHEE II is the chosen one when com-
plete ranking of alternatives is needed. It can offer
a final list of alternatives, ranked from the best to
the worst, based on the defined criteria and weights
assigned to them. The comparison for each criterion
must be made pair by pair, starting by calculating
the deviation (difference between their values). The
difference of each criterion must be applied to a
preference function (there are six basic types to be
chosen, depending on the kind of comparison is
done).
PROMETHEE II considers:
• A a set of n alternatives to be compared in j dif-
ferent criteria ( j = 1, ..., k);
• g
j
(a) the evaluation (value) of alternative a (a ∈
A) in criterion j;
• d
j
(a, b) the difference between alternatives a and
b (a, b ∈ A) in criterion j;
• F
j
[d
j
(a, b)] the result of preference function ap-
plied to d
j
(a, b);
• w
j
the weight of criterion j.
It is based on five steps, as following (Behzadian
et al., 2010):
1. Calculate the deviations between a pair of criteria
(pair by pair):
d
j
(a, b) = g
j
(a) − g
j
(b) (4)
2. Apply the preference function:
P
j
(a, b) = F
j
[d
j
(a, b)] for j = 1, ..., k (5)
3. Calculate the global preference index (π):
∀a, b ∈ A ⇒ π(a, b) =
k
∑
j=1
w
j
P
j
(a, b) (6)
4. Calculate the outranking flows (positive φ
+
and
negative φ
−
) for each alternative:
φ
+
(a) =
1
n − 1
k
∑
x∈ A
π(a, x) (7)
φ
−
(a) =
1
n − 1
k
∑
x∈ A
π(x, a) (8)
5. Calculate the net outranking flows for each alter-
native:
φ(a) = φ
+
(a) − φ
−
(a) (9)
After all steps, φ(a) for each alternative can be
compared. The higher the value of φ(a), the better
the alternative. At the end, the evaluation results in
the ranking among alternatives, facilitating the choice
for the decision maker.
PROMETHEE II is easy to be applied for rank-
ing projects criteria and its application is increasing,
based on the number of published papers in literature
(Behzadian et al., 2010). Based on it, it was chosen
for this work.
3 UNCERTAINTY ON PROJECTS
As Eilat et al. (2006), when proceeding portfolio se-
lection, uncertainty must be considered. A bad per-
formance on selection can occur due to parameters
uncertainty, mainly if it is considered that return esti-
mation is difficult (DeMiguel and Nogales, 2009). In
fact, the impact of estimation error in choosing the op-
timal portfolio was discussed in several works, show-
ing it represents an important role in project selection
(Lim et al., 2011; Marcondes et al., 2017).
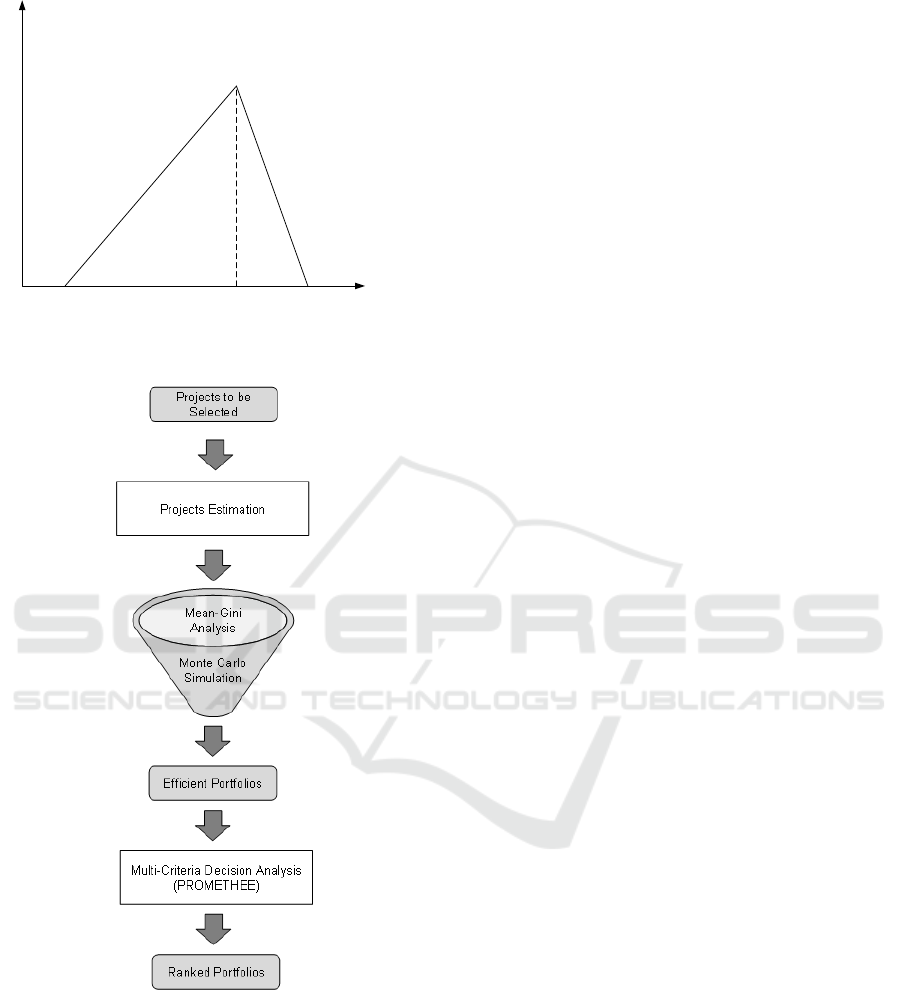
Three point estimation is recommended by PMI
(2013). For it, instead of estimating only one value,
they are three: worst-case (a), most-likely (b), and
best-case (c) outcomes. With them, one can construct
a triangular distribution, as presented in Figure 1, as
frequently applied in projects uncertainty evaluation
(Marcondes et al., 2018).
4 PROPOSED METHOD
The method proposed in this paper is based on MG
portfolio selection and PROMETHEE II. The purpose
is to indicate a portfolio to be executed by the com-
pany. There are some steps, as presented in Figure 2,
detailed described as following.
ICORES 2019 - 8th International Conference on Operations Research and Enterprise Systems
266
Probability Density Function
Random Variable
a bc
Figure 1: Triangular distribution based on three point esti-
mation.
Figure 2: Proposed Method.
1. Projects Estimation
Specialists use three-point estimation for estimat-
ing projects parameters and define worst-case,
most-likely, and best-case outcomes for return.
After that, for each project a triangular distribu-
tion is obtained.
They must also estimate information for
PROMETHEE II application, classifying the
projects in criteria as, for instance, strategic
importance, market position, innovation, and so
on.
2. Mean-Gini Analysis
All portfolio possibilities are identified and mean-
Gini comparison is started. Portfolios return mean
and Gini coefficient are calculated and compared,
using Monte Carlo simulation. If a portfolio is
identified as dominated (not efficient), it is dis-
carded for future comparisons.
At the end of this step, there will be a list of effi-
cient portfolios.
3. Multi-Criteria Decision Analysis
Over the list of efficient portfolios, PROMETHE
II is applied. φ(a) is calculated for each project,
and after that, for each efficient portfolio (by sum-
ming up all φ(a) of each project constituting it).
Then, the list is ranked (from the highest to the
lowest value of φ(a)) and the decision maker can
choose portfolio to be executed.
After mean-Gini evaluation, decision maker has a
list of efficient portfolio. However she/he must de-
cide for just one portfolio to be executed. Several
criteria must be consider for this decision. In the
proposed method, considering all criteria established
by the company, multi-criteria decision is applied for
ranking the portfolios. After these steps, decision
maker has a ranking for choosing the portfolio to be
executed.
5 APPLICATION IN REAL
PROJECTS
The method proposed in this paper was applied in
a real set of software development projects, from a
service provider company. The estimation process
involved three software engineers (specialists) with
more than 10 years of experience on software devel-
opment working as software architects and develop-
ers. Table 1 presents return three-point estimation for
eight projects.
For proceeding PROMETHEE II evaluation, the
following characteristics were defined, and a weight
distribution established:
• Competitiveness Improvement (weight - 0,5):
considering the capacity of project for improv-
ing company competitiveness (from 1 - low to 4
- high);
• Market Potential (weight - 0,3): considering the
capacity of project for improving market share or
market penetration (from 1 - low to 4 - high);
Project Portfolio Selection Considering Return-risk Evaluation and Multiple-Criteria Decision Analysis
267

Table 1: Projects Return Information.
Return
Project Worst-Case Most Likely Best-Case
A -19,830 10,420 20,760
B -20,540 5,170 9,930
C 4,990 31,080 59,870
D -20,510 10,120 19,490
E 9,920 30,260 49,790
F -3,120 10,480 30,750
G 0 20,000 40,000
H 9,950 29,680 49,640
• Degree of Innovation (weight - 0,2): considering
how innovative the project is (from 1 - low to 4 -
high).
Table 2 summarizes the specialists evaluation for
each project characteristics.
Table 2: Projects Characteristcs.
Characteristics
Project Comp. Imp. Market Pot. Innovation
A 1 1 4
B 1 3 2
C 4 2 3
D 1 1 1
E 2 4 3
F 4 2 3
G 2 3 2
H 3 2 1
Based on Tables 1 and 2 informations, the sim-
ulation was run. From a total of 255 portfolios, it
was selected 15 efficient portfolios. Figure 3 presents
a graphical with these partial result: all inefficient
portfolios in black circles, efficient portfolios in red
squares and efficient frontier in dashed line.
Figure 3: Efficient Frontier.
In the sequence, over these 15 efficient portfolios
PROMETHEE II was run. For each project, φ(a) was:
Table 3: Projects Characteristcs.
Project φ(a)
A -1.800
B -1.267
C 2.467
D -3.400
E 1.400
F 2.467
G 0.067
H 0.067
The final ranking of portfolio was (the sequence
of letters indicates which projects are included in the
portfolio):
1 CEFGH 9 FH
2 CEFH 10 F
3 ACEFGH 11 EGH
4 EFGH 12 EH
5 CEGH 13 E
6 EFH 14 ACDEFGH
7 EF 15 H
8 CDEFGH
The ranking indicates that portfolio CEFGH is the
best option for being executed. It is efficient (for its
level of return mean, there is no one with lower risk;
for its risk level, there is no one with higher return
mean) and it has the highest φ(a) value. Complimen-
tary, this portfolio has the fourth highest return mean
value and the best return/risk ratio.
6 CONCLUSIONS
Presently, define the project portfolio to be executed
is a challenge for companies. In general, they don’t
have enough resources to execute all projects.
Several project portfolio selection method are pro-
posed in literature. The ones based on efficient fron-
tier evaluation compares return and risk. Indicating a
list of efficient portfolios.
However, over this list, decision makers need to
choose only one. Several criteria must be applied
(highest return, best relation return/risk, strategic re-
sults, and so on). When several criteria must be con-
sidered at the same time, it is important to use a suit-
able tool for this.
Based on this, this work proposes a method for
project portfolio selection combining efficiency (re-
turn and risk) evaluation and multi-criteria decision
PROMETHEE II in a sequence. The first one works
as a pre-selection for applying the second one. The
ICORES 2019 - 8th International Conference on Operations Research and Enterprise Systems
268

result is an objective ranked list of portfolios to be se-
lected. Supporting decision maker in her/his decision.
For future works, the author has the following list:
• Before applying PROMETHEE II, over efficient
portfolios some filters can be used: minimum ex-
pected return, minimum return/risk rate, or other;
• Additionally to return and risk information, some
constraints must be considered: people limit, time
limit, equipment (or other resources) limit, and so
on;
• Survey with some companies about the use of this
method in project portfolio selection.
REFERENCES
Abbassi, M., Ashrafi, M., and Tashnizi, E. S. (2014). Se-
lecting balanced portfolios of R&D projects with in-
terdependencies: A cross-entropy based methodology.
Technovation, 34(1):54–63.
Alessandra Cillo, P. D. (2014). Mean-risk analysis with en-
hanced behavioral content. European Journal of Op-
erational Research, 239(3):764–775.
Behzadian, M., Kazemzadeh, R. B., and Albadvi, A. A. M.
(2010). Promethee: A comprehensive literature re-
view on methodologies and applications. European
Journal of Operational Research, 200(1):198–215.
Bertrand, J. W. M. and Fransoo, J. C. (2002). Operations
management research methodologies using quantita-
tive modeling. International Journal of Operations &
Production Management, 22(2):241–264.
Better, M. and Glover, F. (2006). Selecting project port-
folios by optimizing simulations. The Engineering
Economist, 51(2):81–98.
DeMiguel, V. and Nogales, F. J. (2009). Portfolio selec-
tion with robust estimation. Operations Research,
57(3):560–577.
Dutra, C. C., Ribeiro, J. L. D., and de Carvalho, M. M.
(2014). An economic-probabilistic model for project
selection and prioritization. International Journal of
Project Management, 32(6):1042–1055.
Eilat, H., Golany, B., and Shtub, A. (2006). Constructing
and evaluating balanced portfolios of R&D projects
with interactions: A DEA based methodology. Euro-
pean Journal of Operational Research, 172(3):1018–
1039.
Feldstein, M. S. (1969). Mean-variance analysis in the the-
ory of liquidity preference and portfolio selection. The
Review of Economic Studies, 36(1):5–12.
Gemici-Ozkan, B., Wu, S. D., Linderoth, J. T., and Moore,
J. E. (2010). R&D project portfolio analysis for
the semiconductor industry. Operations Research,
58(6):1548–1563.
Jafarzadeh, M., Tareghian, H. R., Rahbarnia, F., and Ghan-
bari, R. (2015). Optimal selection of project portfo-
lios using reinvestment strategy within a flexible time
horizon. European Journal of Operational Research,
243(2):658–664.
Kitchenham, B. and Linkman, S. (1997). Estimates, uncer-
tainty, and risk. IEEE Software, 13(3):69–74.
Levy, H. and Levy, M. (2014). The benefits of differen-
tial variance-based constraints in portfolio optimiza-
tion. European Journal of Operational Research,
234(2):372–381.
Lim, A. E., Shanthikumar, J. G., and Vahn, G.-Y. (2011).
Conditional value-at-risk in portfolio optimization:
Coherent but fragile. Operations Research Letters,
39(3):163–171.
M
¨
akinen, S. J. and Vilkko, M. K. (2014). Product portfolio
decision-making and absorptive capacity: A simula-
tion study. Journal of Engineering and Technology
Management, 32:60–75.
Marcondes, G. A. B., Leme, R. C., and de Carvalho, M. M.
(2018). Framework for integrated project portfolio se-
lection and adjustment. IEEE Transactions on Engi-
neering Management. In press.
Marcondes, G. A. B., Leme, R. C., Leme, M. S., and
da Silva, C. E. S. (2017). Using mean-Gini and
stochastic dominance to choose project portfolios with
parameter uncertainty. The Engineering Economist,
62(1):33–53.
Markowitz, H. M. (1952). Portfolio selection. Journal of
Finance, 7:77–91.
Perez, F. and Gomez, T. (2014). Multiobjective project port-
folio selection with fuzzy constraints. Annals of Op-
erations Research, 236:1–23.
PMI (2013). A Guide to the Project Management Body of
Knowledge. Project Management Institute, Atlanta,
EUA, 5 edition.
Ringuest, J. L., Graves, S. B., and Case, R. H. (2004).
Mean-Gini analysis in R&D portfolio selection. Eu-
ropean Journal of Operational Research, 154(1):157–
169.
Shalit, H. and Yitzhaki, S. (1984). Mean-Gini, portfolio
theory, and the pricing of risky assets. The Journal of
Finance, 39(5):1449–1468.
Zopounidis, C., Doumpos, M., and Fabozzi, F. J. (2014).
Preface to the special issue: 60 years following Harry
Markowitz’s contributions in portfolio theory and op-
erations research. European Journal of Operational
Research, 234(2):343–345.
Project Portfolio Selection Considering Return-risk Evaluation and Multiple-Criteria Decision Analysis
269
