
On the Role of Central Individuals in Influence Propagation
Rafael de Santiago
1
, Fernando Concatto
2
and Lu
´
ıs C. Lamb
3
1
Department of Informatics and Statistics, Federal University of Santa Catarina, Florian
´
opolis, Brazil
2
Laboratory of Applied Intelligence, Universidade do Vale do Itaja
´
ı, Itaja
´
ı, Brazil
3
Institute of Informatics, Federal University of Rio Grande do Sul, Porto Alegre, Brazil
Keywords:
Complex Networks, Influence Propagation, Centrality.
Abstract:
Recently, the influence of individuals in complex networks received the attention of several fields of science.
In the context of influence spreading, the understanding of the role and importance of each individual can
be used to control the spread of memes. By considering centrality measures as defining factors of individual
importance, this paper investigates the relationship between the importance of an individual and its role in the
propagation of influence within and over a network. In order to do so, we used degree measures, betweenness
centrality, closeness centrality, eigenvector centrality and clustering coefficient over four different real graphs.
The Min-SEIS-Cluster model was employed in order to simulate the spread of memes, which involve cutting
connections to minimize an epidemic. The results revealed a high correlation between individual importance
and prominence on influence propagation, and the potential to utilize centrality measures to identify which
connections should be cut off in specific application scenarios.
1 INTRODUCTION
Complex networks have been subject to extensive in-
vestigation in several domains. They are typically
modeled using the concepts from graph theory, which
pervades computer science and mathematics. How-
ever, many advances in the field have been influenced
other branches of science, mainly the social and nat-
ural sciences. Complex networks can be employed in
the analyses of a wide array of network-like structures
such as electrical power grids, the Internet, and so-
cial networks as well as in the analyses of phenomena
occurring within them, such as blackouts, computer
viruses and the spread of ideas in groups of individu-
als (Newman, 2004; Strogatz, 2001).
Many complex networks exhibit interesting pat-
terns. While some systems (mostly theoretical ones)
display elevated levels of regularity or randomness,
(Watts and Strogatz, 1998) demonstrated that a multi-
tude of real networks manifests the small-world prop-
erty, characterized by a low average shortest path
length and high clusterization. To measure how clus-
tered together the network is, Watts and Strogatz de-
veloped the clustering coefficient, which determines
how many neighbors of a node are also neighbors of
each other.
Other measures that evaluate the structure of net-
works have been developed and applied in multiple
studies. Examples include modularity, which evalu-
ates the division of the network in groups or commu-
nities (Newman, 2004); assortativity, which quanti-
fies the likelihood of similar or different individuals
to be connected to each other (Newman, 2003); and
centrality, which attempts to describe how important
or influential a (central) individual is.
Centrality has been studied in the context of hu-
man communications (Bavelas, 1948), trade routes,
and communication in city urban development plan-
ning (Pitts, 1965), organizations design (Beauchamp,
1965) and many other fields such as medicine, to
analyze and mitigate the spread of contagious dis-
eases, and psychology and sociology, to understand
leadership and influence, and also to comprehend the
diffusion of ideas and behavior between individuals,
known as memes (Dawkins, 1976).
Many different methods for measuring centrality
have been proposed in the literature. One of the sim-
plest and earliest methods is known as degree, which
represents the number of connections an individual
has with others. An individual that has an elevated
number of connections can be viewed as someone
with a high communication activity (Freeman, 1978).
Another measure, proposed by (Bavelas, 1948), de-
termines how strongly an individual acts as a “control
de Santiago, R., Concatto, F. and Lamb, L.
On the Role of Central Individuals in Influence Propagation.
DOI: 10.5220/0007358101030111
In Proceedings of the 11th International Conference on Agents and Artificial Intelligence (ICAART 2019), pages 103-111
ISBN: 978-989-758-350-6
Copyright
c
2019 by SCITEPRESS – Science and Technology Publications, Lda. All rights reserved
103

point” or “bridge” among others, i.e. how many paths
connecting two individuals pass through that individ-
ual; appropriately, it was named betweenness (Free-
man, 1978). An additional measure, described by
(Bavelas, 1948) and formally defined by (Sabidussi,
1966), calculates the sum of distances from each indi-
vidual to every other. This measure was named close-
ness, and represents how independent an individual is
(Freeman, 1978).
There are several works that analyze the so-
cial relationship among individuals in complex net-
works (Baldoni et al., 2015; Dhamal et al., 2015;
Duarte et al., 2015; Pathania and Karlapalem, 2015;
Tsang and Doucette, 2015). This work proposes
to apply metrics of centrality in the examination of
the dynamics of the spread of memes in complex
networks, modeled as undirected and unweighted
graphs, specifically in the context of minimizing the
spread of memes. Here, we aim at understanding the
correlation between the centrality of an individual and
her role in the propagation of influences, as well as ap-
plying centrality measures to develop techniques that
improve the process of contagion mitigation.
This remainder of the paper is organized as fol-
lows. Section 2 describes the epidemic model used
in this work and the measures used to evaluate the
importance of the individuals. Section 3 presents the
methods employed to analyze the spread of memes in
networks and the examination of the collected data.
Section 4 concludes this paper, offering a summary of
our results and directions for further investigation.
2 RELATED WORK
In the context of disease transmission networks, (Bell
et al., 1999) examined the applicability of centrality
measures using the following methods. In the analysis
of HIV infection probability, they applied a network
of 22 cocaine injectors and sexual partners who were
at risk of being infected with HIV. Their work com-
pared values of vulnerability and infectivity, which
determined the probability of being infected and in-
fecting others, to the centrality of the individuals, and
through simulations, detected that the correlation var-
ied significantly between measures and also as the
number of cycles of the simulation increased.
(Kimura et al., 2009) explored the problem of in-
fluence maximization. They used two models: Inde-
pendent Cascade and Linear Threshold, which sim-
ulated the propagation of influences in discrete steps
with a specific number of individuals initially active
(infected). In the Independent Cascade model, each
connection between individuals is given a weight, and
for each step, every active individual tries to spread
the infection to their neighborhood with a chance
given by the weight of each connection. In the Lin-
ear Threshold model, the parents of every individual
are given weight. At each step, every inactive individ-
ual has the sum of the weights of their active parents
computed, and if the value exceeds a specific thresh-
old, the individual becomes active. They proposed
an approximate algorithm based on bond percolation,
which obtained results very similar in quality to a con-
ventional hill-climbing algorithm in significantly less
time.
(Weng et al., 2013) studied how the structure of
a network affects the diffusion of memes, using data
collected from the microblogging Twitter. Their find-
ings suggest the capability to predict the virality of
memes is much higher when the community struc-
ture of a network is taken into account, and that viral
memes spread to multiple communities with relative
ease, like simple contagions.
(Noble et al., 2015) investigated the relationship
between centrality and the performance of individ-
uals in problem-solving systems through computa-
tional simulations. Their work used the agent-based
models Particle Swarm Optimization, Fully Informed
Particle Swarm, Memetic Networks and Dynamic
Search Range, and represented the problem as thirty-
dimensional real-valued functions. They identified a
high linear correlation between the centrality of an in-
dividual and its contribution to the resolution of the
problem, particularly when the agent can exploit her
position in the network.
2.1 The Min-SEIS-Cluster Epidemic
Model
The Min-SEIS-Cluster problem uses the infection
model SEIS (Susceptible, Exposed, Infected, Suscep-
tible) that is based on the states of SEIR, but instead
of removing the infected individuals, the individuals
become susceptible again (de Santiago et al., 2016).
This problem considers that each individual belongs
to one cluster. These clusters are used to represent the
infection and exposition for each social group within
the network. In groups of friends, the infection could
be spread more often than in groups composed of co-
workers.
The problem also uses a parameter k to define the
limit of relationships that must be cut off to lead to
minimal infection over the execution time. Therefore,
search methods can find the set of k edges that mini-
mize the infection when they are cut off.
The problem Min-SEIS-Cluster is defined as a tu-
ple (G,C, T,χ,φ,k, ε, λ), where G = (V,E) is the net-
ICAART 2019 - 11th International Conference on Agents and Artificial Intelligence
104

work composed of a set of individuals V and the set
of edges between them E; C is the set of all clusters
of the network, composed of disjoint subsets of V ; the
total time of spreading T , which is a natural number;
χ = {P
c
| c ∈ C} is the set of probability functions of
an individual infecting an adjacent when both are in-
side the same cluster i, where P
i
: t → [0,1] for each
P
i
∈ χ, where t ∈ [0,T ]; φ : t → [0, 1] is the probability
function of an individual infecting an adjacent when
they are not within the same cluster, where t ∈ [0,T ]; k
is the maximal number of edges that could be cut from
G; the exposition time function ε : t → Z
+
calculates
the Exposition state duration for each period, where
t ∈ [0, T ]; the infection time function λ : t → Z
+
cal-
culates the duration of the infection, where t ∈ [0, T ].
2.2 Measures and Centrality
The centrality of an individual in a network expresses
how important, powerful and influential they are con-
cerning others. Many different methods to determine
the centrality of an individual have been proposed in
the literature, but to the best of our knowledge, there is
no consensus about their quality and the relationship
between them (Noble et al., 2015). For this paper, we
selected five well-established techniques to evaluate
the centrality of the network’s individuals; their char-
acteristics and formal definitions are specified in the
next subsections.
2.2.1 Degree
Degree is a ubiquitous concept in graph theory. It is
defined for each vertex as the amount of vertices that
have edges incident with it (Bondy, 1976). Formally,
the degree of an individual α
i
is defined as follows:
DEG(α
i
) =
n
∑
j=1
ϕ(α
i
,α
j
), (1)
where ϕ(α
i
,α
j
) = 1 if the two individuals are con-
nected with each other and ϕ(α
i
,α
j
) = 0 otherwise.
2.2.2 Betweenness Centrality
The betweenness centrality of a node is defined by
(Freeman, 1978) as the frequency of shortest paths
(geodesics) between every node which pass through
the node being measured currently. It is defined for
an individual α
i
as:
BET (α
i
) =
∑
α
i
6=α
j
6=α
k
σ
α
j
α
k
(α
i
)
σ
α
j
α
k
, (2)
where σ
α
j
α
k
is the number of shortest paths between
α
j
and α
k
and σ
α
j
α
k
(α
i
)
is the amount of such paths
that pass through α
i
.
2.2.3 Closeness Centrality
Closeness indicates whether or not an individual de-
pends on others to receive or transmit messages, a
measure that is given by how small the distances
(shortest paths) between them and other individuals
are (Freeman, 1978). Mathematically, it is defined for
an individual α
i
as:
CLO(α
i
) =
1
∑
n
j=1
d(α
i
,α
j
)
, (3)
where d(α
i
,α
j
) is the distance of the shortest path be-
tween α
i
and α
j
.
2.2.4 Eigenvector Centrality
(Bonacich, 1972) proposed a measure of centrality
based on the adjacency matrix A of a graph, whose
values are a
i j
= 1 if the individuals α
i
and α
j
are
connected and a
i j
= 0 if they are not. The central-
ity of an individual α
i
is given by λx
i
, where λ is the
largest eigenvalue of the adjacency matrix A and x is
its corresponding eigenvector. Formally, eigenvector
centrality is defined for an individual α
i
as:
EIG(α
i
) = x
i
, Ax = λx. (4)
The author argues that eigenvector centrality
might offer a better assessment of the importance of
an individual, since unlike other measures, it takes
into account the importance of other individuals as
well (Bonacich, 2007).
2.2.5 Clustering Coefficient
Proposed by (Watts and Strogatz, 1998), the cluster-
ing coefficient is not strictly defined as a measure
of centrality. However, they have shown that infec-
tious diseases spread more rapidly in small-world net-
works; due to that result, we have chosen to include
clustering coefficient as a metric of the importance of
an individual. For simplicity, it is also referred to as a
centrality measure.
Clustering coefficient is defined as the fraction of
the number of connections existent in the neighbor-
hood of an individual α
i
over the total amount of
such connections that could exist, which is equal to
k
α
i
(k
α
i
− 1)/2 for undirected graphs, where k
α
i
is the
degree of the individual. Mathematically, this metric
can be defined as:
CCF(α
i
) =
2δ(α
i
)
k
α
i
(k
α
i
− 1)
, (5)
where δ(α
i
) denotes the number of neighbors of α
i
that are connected with each other.
On the Role of Central Individuals in Influence Propagation
105

3 EXPERIMENTS AND RESULTS
This section presents the methodology used in the
experiments. We carried out two main experiments.
The first one identified correlations between central-
ity measures of section 2.2 and the number of infec-
tions suffered or caused. In the second, we identified
methods to select connections in the network for re-
moval based on the centrality of the individuals and
examined the distinctions between these methods and
the original Min-SEIS-Cluster heuristic.
All our experiments used the real graphs of Ta-
ble 1. The column “Id” shows the reference id used
in this paper. The column ”Graph” shows the instance
name (Batagelj and Mrvar, 2006), the column ”#Clus-
ters” shows the number of clusters found in the in-
stance, and “#Nodes” and “#Edges” show the number
of nodes and edges of the instance, respectively. The
clusters used in the tests were obtained by the Lou-
vain method heuristic for Modularity Maximization
community detection problem (Blondel et al., 2008).
Table 1: Instances used in the experiments.
Id Graph #Clusters #Nodes #Edges
1 Karate 2 34 78
2 Dolphins 7 62 159
3 Celegansneural 6 297 3592
4 Email 43 1113 5451
3.1 Correlation of Centralities
In the first experiment, the Min-SEIS cluster heuristic
(de Santiago et al., 2016) was tested with the param-
eter k ∈ {0.1|E|, 0.5|E|} and T = 100. The data was
collected from 400 solutions. The results can be di-
vided into two different correlations. The first was
about the correlation between the centrality measure
and the number of infections received; and the sec-
ond investigated the correlation between the centrality
score and the number of caused infections.
The results of the first are shown in Table 2 and
Figure 1. Mainly in the largest instance, Table 2
shows positive correlations between the number of
infections suffered and the centrality measures. In
contrast, the clustering coefficient measure displays a
very strong negative correlation in the Celegans Neu-
ral instance. The scatter plots of Figure 1 shows each
individual, its centrality score, and the number of in-
fection suffered. For the two largest instances, it is
to corroborate the results from Pearson correlation
of Table 2. Except by the clustering coefficient, all
measures presented a positive correlation between the
number of suffered infections and the centrality score.
The results of the second kind of experiment are
shown in Table 3 and Figure 2. Table and Figure
show a similar result. For almost all measures, there
is a positive correlation between the number of infec-
tions caused and the centrality score. However, the
clustering coefficient once again displayed a negative
correlation.
These results show that individuals with a high
centrality score have a larger chance to be infected by
a meme, or pass an infection for their neighbors. So,
if we used this information in a network of individu-
als, what kind of behavior will the infection present?
Some experiments to find answers to this question are
described in the following subsection.
Table 2: Pearson’s r score between the centrality score and
the number of infections suffered by individuals.
k
/|E| 1 2 3 4
BET
(10%) 0.656 0.478 0.196 0.489
(50%) 0.585 0.422 0.226 0.527
CCF
(10%) -0.415 0.337 -0.800 0.053
(50%) -0.373 0.265 -0.831 0.033
CLO
(10%) 0.368 0.453 0.445 0.750
(50%) 0.297 0.458 0.489 0.792
DEG
(10%) 0.662 0.648 0.465 0.714
(50%) 0.482 0.634 0.517 0.751
EIG
(10%) 0.272 0.396 0.579 0.671
(50%) 0.077 0.499 0.635 0.735
Table 3: Pearson’s r score between the centrality score and
the number of infections caused by individuals.
k
/|E| 1 2 3 4
BET
(10%) 0.806 0.481 0.884 0.766
(50%) 0.796 0.440 0.902 0.774
CCF
(10%) -0.270 0.324 -0.568 -0.061
(50%) -0.272 0.214 -0.582 -0.063
CLO
(10%) 0.523 0.494 0.957 0.681
(50%) 0.559 0.610 0.969 0.689
DEG
(10%) 0.922 0.737 0.977 0.865
(50%) 0.933 0.738 0.989 0.872
EIG
(10%) 0.682 0.381 0.924 0.739
(50%) 0.713 0.619 0.938 0.748
3.2 Identifying which Connections to
Cut
In the original presentation of the Min-SEIS-Cluster
model, Santiago et al. (de Santiago et al., 2016) pro-
posed a heuristic to minimize the spread of infections
based on the Monte Carlo concept, which generated
random solutions (connections to be cut) of size k un-
til the terminating condition was reached. Although
ICAART 2019 - 11th International Conference on Agents and Artificial Intelligence
106
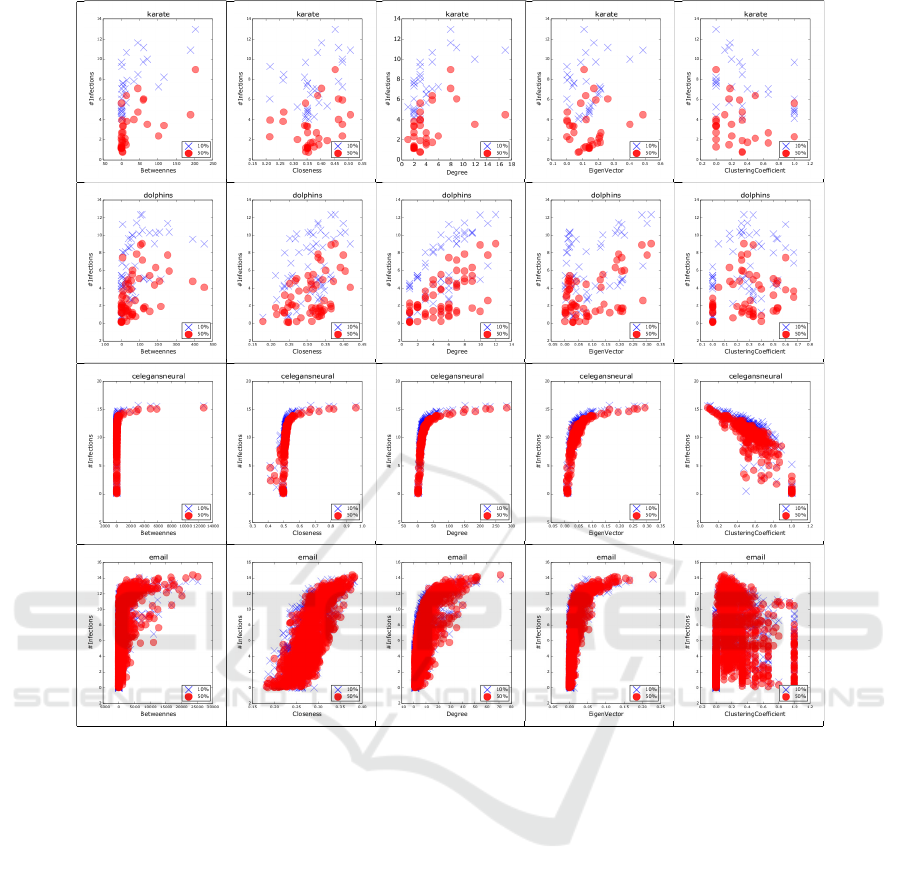
Figure 1: Correlation between centrality measures and the number of infections that each node suffered. The blue and red
marks are assigned to experiments with 10% and 50% of edges removed respectively.
that method produced interesting results, it was rather
unreliable, due to the following reasons: i) the com-
plete randomness of the search, which does not em-
ploy any criterion to determine which region of the
search space will be explored, an aspect that is es-
pecially harmful due to the large number of possible
solutions, which is given by
|V |
k
; and ii) the running
time of the algorithm, which needed to execute mul-
tiple simulations of the infection model for each ran-
domly chosen solution and did not offer any guarantee
of a minimum amount of iterations needed to improve
a solution.
Examining the notion of the centrality of indi-
viduals in a network, we have come to hypothesize
that centrality measures could be utilized to determine
which connections should be cut to minimize the
propagation of influence. Individuals with elevated
centrality values tend to be very prominent in the net-
work, either because they know many other individ-
uals, are situated in strategic positions or have very
dense neighborhoods; all of these properties might
be significant in the spread of an epidemic. We also
chose to investigate to what extent an individual is in-
volved in the spread of memes if it is not central.
Taking these observations into account, we pro-
pose an algorithm to select connections for re-
moval based on the centrality of each individ-
ual in the network, defined formally in Algo-
rithm 1. As inputs, the algorithm takes the net-
work, k (the number of connections to be se-
lected), measure ∈ {DEG,BET,CLO,CCF,EIG} and
ordering ∈ {ascending,descending}. Its output is the
set of selected connections to be cut from the network.
First, the set of connections solution is declared as an
empty set. Then, k connections are selected through
the procedure detailed in the following.
The centrality of every individual in the network
is calculated according to the measure parameter and
stored in the set C, composed by the individuals of
On the Role of Central Individuals in Influence Propagation
107
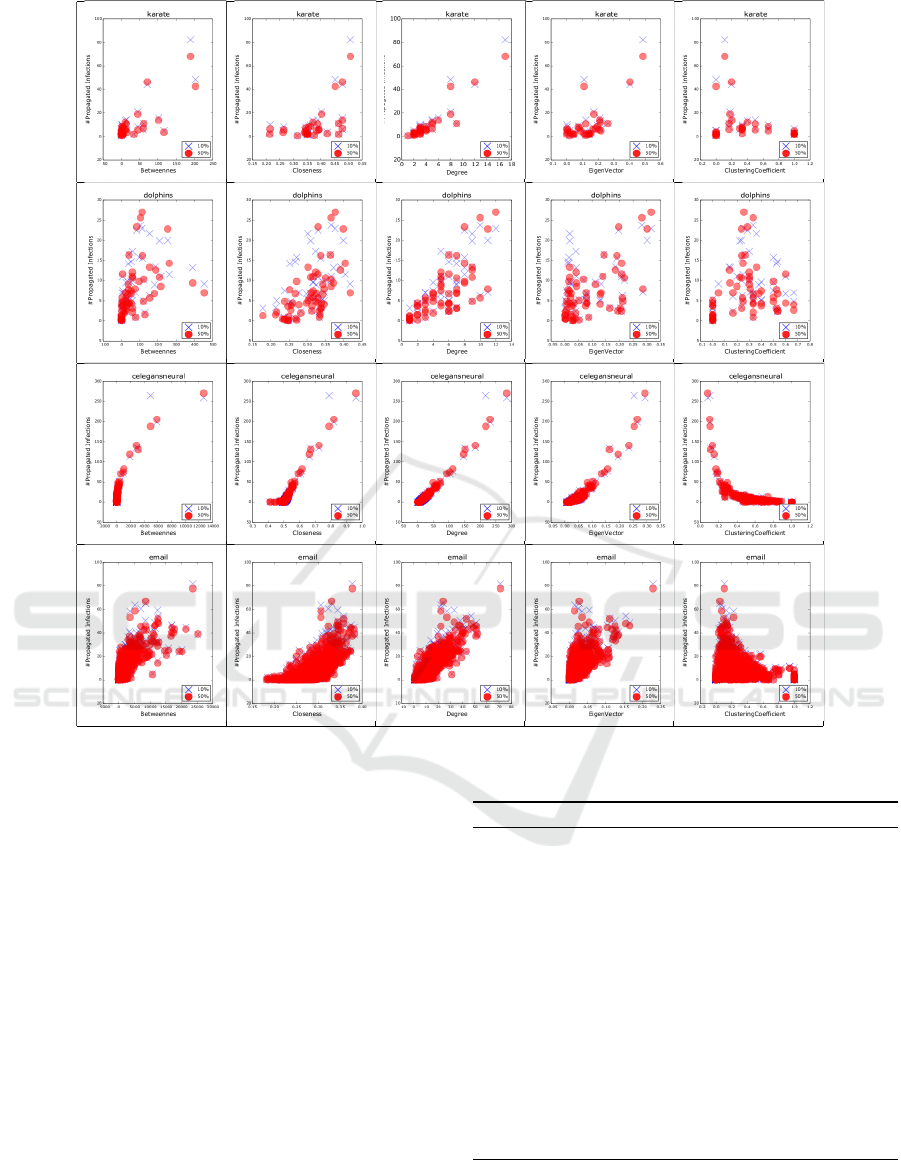
Figure 2: Correlation between centrality measures and the number of infections that each node caused. The blue and red
marks are assigned to experiments with 10% and 50% of edges removed respectively.
the network and their corresponding centrality. Then,
the set C is sorted in order of the centrality of the in-
dividuals, conforming to the parameter ordering: if
ascending order is chosen, then C
1
is the least central
individual of the network; otherwise, C
1
is the most
central individual. Afterward, we choose the first in-
dividual of C whose degree is greater than zero and
store it under the symbol α. This is the first extremity
of the connection selected for removal.
Next, the neighbors of individual α are assembled
into the set N, with the same structure as the set C.
Then, the set N is ordered in the same manner C was.
The second extremity of the connection is then estab-
lished as N
1
, the least or most central individual in
the neighborhood of α, depending on the parameter
ordering. This connection is thus inserted into the set
solution to be later removed from the network.
Algorithm 1: Solution generation based on centrality.
1: procedure GEN(network,measure,ordering,k)
2: solution ←
/
0
3: while k > 0 do
4: C ← calcCentrality(network, measure)
5: sort(C, ordering)
6: α ← first element of C with degree > 0
7: N ← neighbors(α)
8: sort(N,ordering)
9: connection ← (α,N
1
)
10: solution ← solution ∪ {connection}
11: k ← k − 1
12: end while
13: return solution
14: end procedure
ICAART 2019 - 11th International Conference on Agents and Artificial Intelligence
108

3.3 Analysis of the Algorithm
To validate the proposed method of generating solu-
tions based on the centrality of individuals, extensive
simulations were performed on the real networks pre-
sented in table 1 using the Min-SEIS-Cluster model.
Six sets of experiments were carried out utilizing the
five centrality measures described in subsection 2.2
and the conventional random method presented in
the original paper (de Santiago et al., 2016). Each
experiment was run with k ∈ {0.2
|
E
|
, 0.5
|
E
|
} and
ordering ∈ {ascending, descending} and was re-
peated 60 times for every method and value of k, and
for each experiment, 100 different sets of initially in-
fected individuals (n = 5) were randomly chosen, to-
talizing 6000 simulations per experiment. Since our
proposed method is deterministic and always gener-
ates the same solution given a network and a cen-
trality measure, the same solution was tested in all
60 runs; in the original version of the algorithm, 60
randomly generated solutions were tested. Every test
consisted of removing connections in the network as
determined by the solution and simulating the epi-
demic for 100 steps. The results obtained through
these experiments, described by the mean amount of
infections observed over the 60 runs together with its
standard error, are demonstrated in Figure 3 for both
values of k. The rightmost column displays the re-
sult obtained through the original random method; as
such, the distinction between ascending and descend-
ing order should be ignored.
3.3.1 Descending Order
We observed a rather unexpected outcome: in the ma-
jority of experiments, removing connections between
the most central individuals did not reduce the number
of infection events; rather, even more infections oc-
curred in comparison with the original method. This
behavior is particularly noticeable when the exper-
iments were executed with k = 0.2
|
E
|
, where for
three of the four networks, every measure employed
with the exception of clustering coefficient (CCF) dis-
played the aforementioned behavior. The only in-
stance where the distinction was less sharp was on the
“Dolphins” network, in which the usage of the mea-
sures of clustering coefficient and closeness centrality
(CLO) offered slightly better results, while between-
ness centrality (BET) presented an equivalent amount
of infections. In the instances “Email” and “Cele-
gansneural”, however, generating solutions based on
the clustering coefficient of the individuals offered
rather positive results, with approximately 21% less
infection events occurring along the simulations.
When k was set to 0.5
|
E
|
, slightly different re-
sults could be noted: in the “Email” network, solu-
tions generated through betweenness centrality (BET)
offered a much better reduction in the number of in-
fection events, surpassing the random method by ap-
proximately 22%; an even greater reduction was no-
ticed when using the measure of clustering coeffi-
cient (CCF), with 33% less infections than the random
method. On the other hand, for the “Celegansneural”
network, betweenness centrality continued to produce
worse results than the random method, but clustering
coefficient was exceptionally efficient, producing ap-
proximately 46% less infection events than the orig-
inal method. This result is likely related to the den-
sity of the “Celegansneural” network, which is signif-
icantly higher than the other three networks. A similar
distinction was also observed in the results obtained
in the experiments involving the correlation between
centrality and the suffering and causing of infections
(Section 3.1), where a sharply negative correlation
was observed. The effectiveness of betweenness cen-
trality (BET) could also be noted in the “Dolphins”
network, where a reduction of approximately 34% in
comparison with the random method was observed.
In the “Karate” network, the usage of the clustering
coefficient (CCF) also produced a significant reduc-
tion of approximately 33%, while the other measures
were not very useful.
3.3.2 Ascending Order
Perhaps the most surprising result was the perfor-
mance of the removal of connections between the
least central individuals. Except when using the mea-
sure of clustering coefficient (CCF), every single ex-
periment using measures of centrality presented bet-
ter results than the original, random method. In the
smaller networks (“Karate” and “Dolphins”), the im-
provement was not very pronounced when k = 0.2
|
E
|
,
with an average of approximately 13% less infec-
tion events. However, when k = 0.5
|
E
|
, the usage
of closeness centrality (CLO) in the “Karate” net-
work offered 38% less infections than the random
method, slightly outperforming clustering coefficient
in descending order; however, clustering coefficient
in ascending order produced unsatisfactory results,
causing more infections than the random method. In
the “Dolphins” network, every measure performed
reasonably well, including the clustering coefficient,
with an average of approximately 25% less infections.
For the larger networks (“Email” and “Cele-
gansneural”), the improvement obtained from remov-
ing connections between peripheral individuals was
even more accentuated. An interesting behavior
present in the “Celegansneural” network is that ev-
On the Role of Central Individuals in Influence Propagation
109

ery measure was very similar to each other in terms
of performance: for k = 0.2
|
E
|
, every measure except
clustering coefficient offered approximately 19% less
infections than the random method, while k = 0.5
|
E
|
produced a remarkable reduction of 48%. Also, these
values are very similar to the usage of the clustering
coefficient in descending order in this network. In
the “Email” network, when k was set to 0.2
|
E
|
, every
measure produced approximately 21% less infections,
with the exception of clustering coefficient, which of-
fered only 8% less infection events. Once again, us-
ing the clustering coefficient in descending order pro-
vided a reduction equivalent to the other measures
in ascending order. When k = 0.5
|
E
|
, the usage of
clustering coefficient provided a moderate reduction
of about 22%, while other measures produced a pro-
found reduction of 46% in comparison with the ran-
dom method.
Karate Karate
0
100
200
300
BET CCF CLO DEG EIG RND
Centrality Measure
# Infections
Order
Ascending
Descending
0
50
100
150
200
250
BET CCF CLO DEG EIG RND
Centrality Measure
# Infections
Order
Ascending
Descending
Dolphins Dolphins
0
100
200
300
400
500
BET CCF CLO DEG EIG RND
Centrality Measure
# Infections
Order
Ascending
Descending
0
100
200
300
BET CCF CLO DEG EIG RND
Centrality Measure
# Infections
Order
Ascending
Descending
Celegans Neural Celegans Neural
0
500
1000
1500
2000
BET CCF CLO DEG EIG RND
Centrality Measure
# Infections
Order
Ascending
Descending
0
500
1000
1500
2000
BET CCF CLO DEG EIG RND
Centrality Measure
# Infections
Order
Ascending
Descending
Email Email
0
1000
2000
3000
4000
BET CCF CLO DEG EIG RND
Centrality Measure
# Infections
Order
Ascending
Descending
0
1000
2000
3000
4000
5000
BET CCF CLO DEG EIG RND
Centrality Measure
# Infections
Order
Ascending
Descending
Figure 3: Number of infections by cutting 20% (left) and
50% (right) of edges from central (descending) and periph-
eral (ascending) individuals.
4 CONCLUSIONS
Centrality is an important structural attribute within
social network studies. In this paper, we investigated
the relationship between the centrality of an individ-
ual and its role in the diffusion of a meme through a
network and explored methods to mitigate diffusion.
In our experiments, we used real complex net-
works of individuals and the Min-SEIS-Cluster model
(de Santiago et al., 2016). We first investigated the
correlations between the centrality score and the num-
ber of infections suffered and caused. These results
showed that central individuals have an important role
in spreading of memes, with the highest correlation
values being observed in the largest networks when
the number of infections caused was analyzed. When
examining the clustering coefficient metric, we no-
ticed inconsistent correlation values, with some net-
works presenting negative results, others positive, and
even no correlation at all.
In the main experiments, we explored an improve-
ment to the Min-SEIS-Cluster algorithm by cutting
connections of individuals that were scored with more
and less centrality. The experiments showed that re-
moving the connections between the most central in-
dividuals did not result in less infection events, with
the exception of the usage of the clustering coeffi-
cient measure, which offered a significant improve-
ment over the original, random method, especially in
the larger networks. We suggest exploring the re-
lationship between the effectiveness of this measure
and the correlations explored in Section 3.1, since
a similar distinction was observed. When removing
the connection between peripheral individuals, how-
ever, we noticed a significant reduction of infection
events when employing every measure, except the
clustering coefficient, which offered little to no im-
provement. This method produced astounding results,
ranging from 13% to 21% less infections when 20%
of the connections were removed, and 17% to an im-
pressive 48% reduction when 50% of the connections
were removed. The improvement became more no-
ticeable as the size of the network increased.
These surprising results raised some interesting
questions and interpretations. At first, we hypothe-
sized that removing connections between central in-
dividuals would provide a significant reduction in the
number of memes being transmitted (referred to as
infections), as the conceptual descriptions of the cen-
trality measures suggested that these individuals are
connected with many others and have control over
the communication paths of the network. However,
this hypothesis was proved incorrect within the Min-
SEIS-Cluster model, as the epidemic did not depend
ICAART 2019 - 11th International Conference on Agents and Artificial Intelligence
110

on the connections between central individuals to af-
fect the whole network.
However, the epidemic was less successful when
the connections between peripheral individuals were
removed. To our understanding, this outcome was ob-
served due to the fact that there will be several indi-
viduals who are completely segregated from the rest
of the network, as individuals with few connections
tend to possess low centrality scores. Although the
number of infections was reduced, we introduced iso-
lation in the network, which could be very problem-
atic in a real-world context.
As further work, one could aim at designing ex-
periments to explore additional relationships between
central and peripheral individuals in the spread of
memes, investigate the role of communities in the
propagation of influences and examine how central
and non-central individuals can better find a solution
for an optimization problem by spreading memes to
their neighbors.
ACKNOWLEDGEMENTS
This work was partly supported by the Brazilian Re-
search Council CNPq and Federal University of Santa
Catarina.
REFERENCES
Baldoni, M., Baroglio, C., Chopra, A. K., and Singh, M. P.
(2015). Social Contexts and Social Pragmatics. In
Proceedings of the 2015 International Conference on
Autonomous Agents and Multiagent Systems, pages
1739–1740.
Batagelj, V. and Mrvar, A. (2006). Pajek datasets.
Bavelas, A. (1948). A Mathematical Model for Group
Structures. Human Organization, 7(3):16–30.
Beauchamp, M. A. (1965). An improved index of centrality.
Behavioral Science, 10(2):161–163.
Bell, D. C., Atkinson, J. S., and Carlson, J. W. (1999). Cen-
trality measures for disease transmission networks.
Social Networks, 21(1):1–21.
Blondel, V. D., Guillaume, J.-L., Lambiotte, R., and Lefeb-
vre, E. (2008). Fast unfolding of communities in large
networks. Journal of Statistical Mechanics: Theory
and Experiment, 2008(10):P10008.
Bonacich, P. (1972). Factoring and weighting approaches
to status scores and clique identification. The Journal
of Mathematical Sociology, 2(1):113–120.
Bonacich, P. (2007). Some unique properties of eigenvector
centrality. Social Networks, 29(4):555–564.
Bondy, J. A. (1976). Graph Theory With Applications. El-
sevier Science Ltd., Oxford, UK, UK.
Dawkins, R. (1976). The Selfish Gene. Oxford University
Press, Oxford, UK.
de Santiago, R., Zunino, W., Concatto, F., and Lamb, L. C.
(2016). A New Model and Heuristic for Infection Min-
imization by Cutting Relationships, pages 500–508.
Springer International Publishing, Cham.
Dhamal, S., K.J., P., and Narahari, Y. (2015). A Multi-
phase Approach for Improving Information Diffusion
in Social Networks. In Proceedings of the 2015 Inter-
national Conference on Autonomous Agents and Mul-
tiagent Systems, pages 1787–1788.
Duarte, G., Pereira, G., Prada, R., and Santos, P. (2015).
Exploring Social Power Intelligent Behavior. In Pro-
ceedings of the 2015 International Conference on
Autonomous Agents and Multiagent Systems, pages
1859–1860.
Freeman, L. C. (1978). Centrality in social networks con-
ceptual clarification. Social Networks, 1(3):215–239.
Kimura, M., Saito, K., Nakano, R., and Motoda, H. (2009).
Extracting influential nodes on a social network for
information diffusion. Data Mining and Knowledge
Discovery, 20(1):70.
Newman, M. (2003). Mixing patterns in networks. Physical
Review E, 67(2):026126.
Newman, M. E. J. (2004). Analysis of weighted networks.
Physical Review E - Statistical, Nonlinear, and Soft
Matter Physics, 70(5 2).
Noble, D. V., Grando, F., Ara
´
ujo, R. M., and Lamb, L.
d. C. (2015). The Impact of Centrality on Individ-
ual and Collective Performance in Social Problem-
Solving Systems. In Proceedings of the 2015 on
Genetic and Evolutionary Computation Conference
- GECCO ’15, pages 73–80, New York, New York,
USA. ACM Press.
Pathania, D. and Karlapalem, K. (2015). Social network
driven traffic decongestion using near time forecast-
ing. In Proceedings of the 2015 International Confer-
ence on Autonomous Agents and Multiagent Systems,
volume 3, pages 1761–1762.
Pitts, F. R. (1965). A Graph Theoretic Approach to His-
torical Geography. The Professional Geographer,
17(5):15–20.
Sabidussi, G. (1966). The centrality of a graph. Psychome-
trika, 31(4):581–603.
Strogatz, S. H. (2001). Exploring complex networks. Na-
ture, 410(6825):268–276.
Tsang, A. and Doucette, J. A. (2015). Voting with Social In-
fluence : Using Arguments to Uncover Ground Truth.
In Proceedings of the 2015 International Conference
on Autonomous Agents and Multiagent Systems, pages
1841–1842.
Watts, D. J. and Strogatz, S. H. (1998). Collective dynamics
of’small-world’ networks. Nature, 393(6684):440–
442.
Weng, L., Menczer, F., and Ahn, Y.-Y. (2013). Virality Pre-
diction and Community Structure in Social Networks.
Scientific Reports, 3:2522.
On the Role of Central Individuals in Influence Propagation
111
