
A Novel Features Set for Internet Traffic Classification using
Burstiness
Hussein Oudah, Bogdan Ghita and Taimur Bakhshi
Centre for Security, Communication and Network Research, Plymouth University, Plymouth, U.K.
Keywords: Traffic Classification, Tcptrace, Application Detection, C5.0 Algorithm.
Abstract: Traffic classification is an essential tool for network management and security. Traditional techniques such
as port-based and payload analysis are ineffective as major Internet applications use dynamic port numbers
and encryption. Recent studies have used statistical properties of flows to classify traffic with high accuracy,
minimising the overhead limitations associated with other schemes such as deep packet inspection (DPI).
Classification accuracy of statistical flow-based approaches, however, depends on the discrimination ability
of the traffic features used. To this effect, the present paper customised the popular tcptrace utility to generate
classification features based on traffic burstiness and periods of inactivity (idle time) for everyday Internet
usage. An attempt was made to train a C5.0 decision tree classifier using the proposed features for eleven
different Internet applications, generated by ten users. Overall, the newly proposed features reported a
significant level of accuracy (~98%) in classifying the respective applications.
1 INTRODUCTION
Traffic classification is considered significantly
important for operators in order to monitor the
network applications usage as well as an
enhancement in the areas of network management,
service discovery, routing and resource optimisation
(Auld et al., 2007b). Previous studies proposed two
approaches for Internet applications profiling and
classification, port-based and deep packet inspection.
The former relies on port numbers, and it is rarely
used due to the rapid growth in the Internet
applications that utilise dynamic ports (Moore and
Papagiannaki, 2005). The latter employs binary
inspection for the packet content that requires
computational overhead and additional resources,
also having the caveat of not being able to analyse
encrypted traffic (Finsterbusch et al., 2014). In
contrast, recent studies focused on employing the
statistical approach, which can characterise traffic
associated with an application based upon statistics
and information theory. In other words, it does not
rely on the content of the packet and can potentially
profile encrypted traffic (Valenti et al., 2013).
Usually, statistical approaches utilise machine-
learning algorithms to identify the patterns in the
communication and attempt to link them to specific
applications
(Ulliac and Ghita, no date; Buczak and
Guven, 2015; Bakhshi and Ghita, 2016a; 2016b). In
this context, the feature selection process is an
important step before the classification phase takes
place, as the selected features need to be sufficiently
discriminative in order to distinguish between
applications. Therefore, identifying the optimal
feature set of features for network applications
reduces the potentially large dimensionality and
might be useful to improve the system performance
(Hajjar et al., 2015). This paper focuses mainly on
identifying a set of additional robust features, mainly
based on the timing characteristics of inter-arrival
packets time and flows that can be used to
discriminate between network applications. The
identified set of features is tested against a packet
trace, and the results indicate that it does outperform
previous traffic classification-based application
studies.
The rest of the paper is organized as follows:
Section 2 discusses the state-of-the-art traffic
classification approaches in more detail to provide a
comprehensive review of the limitations of present
techniques. Section 3 highlights the proposed
method, analysis, and introduces the feature set.
Section 4 presents the results using C5.0 machine
learning algorithm, and conclusion is drawn in
section 5.
Oudah, H., Ghita, B. and Bakhshi, T.
A Novel Features Set for Internet Traffic Classification using Burstiness.
DOI: 10.5220/0007384203970404
In Proceedings of the 5th International Conference on Information Systems Security and Privacy (ICISSP 2019), pages 397-404
ISBN: 978-989-758-359-9
Copyright
c
2019 by SCITEPRESS – Science and Technology Publications, Lda. All rights reserved
397

2 BACKGROUND
The original approach for identifying network traffic
was the port-based method (Khater, 2015), based on
matching the port number in the packet header with
the table containing the port-applications, as defined
by (IANA) (Joe Touch; Eliot Lear, Allison Mankin,
Markku Kojo, Kumiko Ono and Lars Eggert, Alexey
Melnikov, Wes Eddy, 2013). During the rapid
development of Internet applications, the approach
became unreliable and inaccurate as applications are
utilising dynamic ports or moved towards a web-
based front-end (Moore and Papagiannaki, 2005). A
low performance was reported for this method to
identify applications, typically between 30-70% of all
traffic. To overcome this limitation, the Deep packet
inspection (DPI) approach, based on extracting the
packet payload to identify signatures of applications
or protocols, became the preferred solution
(Boukhtouta et al., 2016). Although it is entirely
accurate, the method requires more computational
effort to identify signatures due to either the
continuous expansion of applications and requires
continual updating due to the changes in application
content (Finsterbusch et al., 2014). Moreover, due to
the fact it requires access to the data content of the
packet, the method is unusable when traffic is
encrypted, or breaches the privacy of the users when
used in proxy scenarios (Barlet-ros, 2014). The
research community has therefore introduced two
techniques, focusing on host behaviour and statistical
methods, to avoid these limitations. The former
technique is based on the idea that hosts generate
different communication patterns at the transport
layer; by extracting these behavioural patterns,
activities and applications can be classified. Although
the method showed acceptable performance (over
90%) (Bashir et al., 2013) and it can detect the
application type, it cannot correctly identify the
application names, classifying both Yahoo or Gmail
as email (Park et al., 2013). In contrast, high accuracy
was achieved (over 95%) by applying the latter
approach (Crotti et al., 2007; Alshammari and Zincir-
Heywood, 2015; Vlăduţu et al., 2017), which uses
statistical features derived from the packet header,
such as number of packets, packet size, inter-arrival
packets time, and flow duration with the aid of
machine learning algorithms. The advantage of using
ML algorithms is that they can be used in real time
environment that provide rapid application detection
with high accuracy over 95%. For instances, the
author in (Moore et al., 2005) used the Naïve Bayes
techniques with the statistical features to identify
traffic. Other ML algorithms were utilized in this task
such as Bayesian neural networks and support vector
machines (Auld et al., 2007a), (Este et al., 2009). In
(Bujlow et al., 2012), the author utilized C5.0
algorithm to classify seven application with average
accuracy over 99%. However, selecting features,
which must be flexible to the network circumstances,
is the significant point to build a classifier (Hajjar et
al., 2015). Given this classification, the approach
outlined in this paper strengthens the second category
of methods (statistical) by considering the arrival
times of packets and flows as discriminating features
among applications. The authors in (Lazarou et al.,
2009) proved that there is a variability (burstiness) in
network traffic by using a measure called Index of
Variability. The hypothesis that timing can be used to
discriminate between applications was also put
forward in (Roughan and Sen, 2004), which
highlighted that applications generate different
behaviour based on statistical features relating to the
timing of packets arriving. The most recent studies
attempted to combine more than one method to obtain
superior accuracy of up to 99% (Park et al., 2013;
Yoon et al., 2015). Nevertheless, these studies suffer
from the complexity of analysis of using more than
one approach. To this end, it can be noticed that the
statistical approach is appropriate for traffic
classification as it can deal with encrypted traffic,
which nowadays becomes the dominant, and it can
adapt with real time traffic. Moreover, the possibility
of using this technique to add or propose new
statistical features based on timing.
3 PROPOSED METHOD
The previous section discussed the methods of traffic
classification, focusing on their limitations and
strengths. The dominant is the statistical approach as
it uses the packet header rather than payload to
identify applications and yielded high accuracy.
However, the success of this method depends highly
on the right features that precisely describe the
Internet traffic and have the immunity to different
network circumstances. This paper aims to identify an
additional set of features that can be used to
discriminate between network applications, based on
the statistical differences between inter-arrival times
for the packets that they generate. Among the possible
parameters, we focus on burstiness, which defines
data exchanges that are very close in time, such as
trains of packets or objects on the same page. Also,
idle time, which can be defined as pauses between a
group of data exchanges separated by longer
intervals, such as moving from one page to another
ICISSP 2019 - 5th International Conference on Information Systems Security and Privacy
398
when the user is browsing a website. Based on the
characteristics of the application, the size duration,
the distribution of the bursts, and the idle time
distributions would differ. The fact is that Internet
applications behave inherently different, generating
different amounts of data, creating various connection
and timing patterns between the generated packets
and flows. For instance, streaming a video on Netflix
versus e-mail checking or using social media would
lead to different packet arrival patterns. We believe
that each application would have a slightly different
burstiness signature. The following example explains
the concept of the burstiness and how it may be used
to discriminate the behaviour of Internet applications.
When a user is browsing an application, for instance,
the BBC news website (www.bbc.co.uk/news), the
session would consist of some pages that the user
chooses to visit. Within each page, the browser will
be requesting and downloading some objects. From a
timing perspective, the download of objects on a page
would appear as a burst of connections, followed by
a period of inactivity (idle time) while the user reads
the page until he/she decides to click on a link and
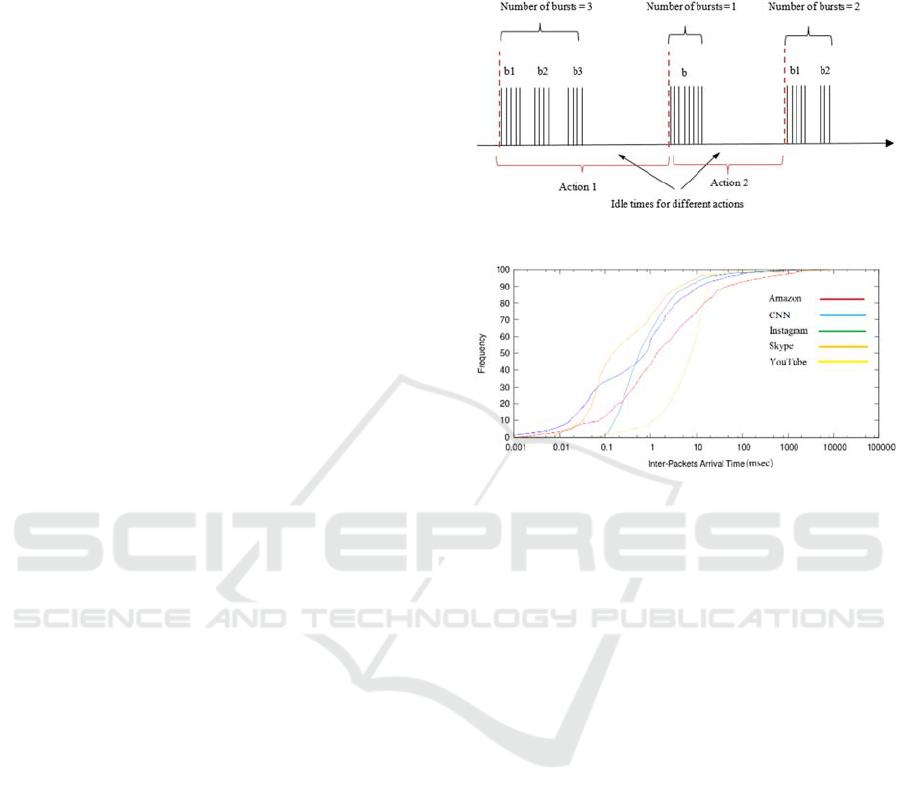
load another page. The definition of bursts can be
described as a group of consecutive packets with
shorter inter-packet gaps than packets arriving before
or after the burst of packets. Figure 1 shows how the
group of packets forms a burst based on inter-packet
arrival time. Moreover, the figure shows inactivity of
time between bursts. Two thresholds defining
whether two successive packets are part of different
bursts or different browsing sessions. Burst_threshold
is defined as the maximum size of inter-arrival packet
times to form a burst. While Idle_threshold is defined
the distance between groups of packets of inter-
arrival time at which could identify an idle time that
separates between different data exchanges. The idle
time could be varied according to the behaviour of the
user when he moves from one page to another. Prior
studies such as (Hofstede et al., 2014) utilized idle
time values typically range from 15 seconds to 5
minutes. Figure 2 shows the inter-packet arrival time
for five applications in (msec). Most distributions of
the inter-packet arrival time fall under 1 second
except for YouTube that falls under 0.5 second.
Accordingly, the burst_threshold could be set to 1
second, while the idle_threshold was set 10 second.
The pseudocode in figure 3 summarises the
estimation of bursts and idle time; this code was
written in C script inside tcptrace tool. After
calculating the inter-arrival packets time, if it is less
than burst_threshold, a a new burst is formed, and
some values would be accumulated such as current
burst and current session. Otherwise, if the inter-
arrival time greater than idle_threshold a new idle
time is formed and its value would be accumulated
each time.
Figure 1: Definition of bursts and idle time.
Figure 2: The distribution of inter-packet arrival times for
five applications.
burst_threshold= 1s
idle_threshold= 10s
initialise burst and idle time parameters
while packets arriving
do
calculate interarrival_time
if interarrival_time < burst_threshold
current_burst ++
current_session ++
else
burst_counter ++
current_burst = 1
if interarrival_time > idle_threshold
current_session = 1
session_counter ++
idle_time += interarrival_time
fi
fi
done
Figure 3: Estimation of packet bursts and idle time.
The possible features that could be extracted from
the pseudocode are as follows:
Bursts_a & Bursts_b: Total number of bursts for all
arriving packets or sending packets (each direction).
A Novel Features Set for Internet Traffic Classification using Burstiness
399

Packets_a & Packets_b: Total number of packets
that are in bursts and for each direction.
Packets_b /Packets_a: The ratio between numbers
of packets arriving from the server to the number of
packets sending from the client.
Burst_size_a & Burst_size_b: Total size of bursts in
bytes and for each direction.
Avg_burst_size_a & Avg_burst_size_b: Average
of bursts size divided by the total number of bursts for
each direction.
Burst_duration_a & Burst_duration_b: The
duration of total bursts in each direction.
Idle_time_a, idle_time_b: The accumulation of
inactive time in each direction.
A brief study was conducted as part of this research
to determine whether the distribution of arrival time
does indeed differ when using different applications.
As part of the study, a user interacted with eleven
applications (Amazon, BBC news, Bing, CNN,
Facebook, Gmail, Google, Instagram, Skype, Yahoo
mail, and YouTube) separately for 2-5 minutes for
each one. Using the captured packet traces, the arrival
time of packets and the inter-arrival delay were
calculated by setting up a threshold for one second to
compute the burst size. Figure 4 displays the boxplot
analysis of the eleven applications used for the
average burst size per flow. As it can be observed, the
distributions of the applications are slightly different.
A high-level architecture of the proposed system is
presented in figure 5 highlighting the key components
of application identification scheme. Firstly, the data
was captured using tcpdump from ten users that
browsed eleven applications, and each application
(traffic) was labelled. Afterwards, the traffic was
analysed by tcptrace to extract the burstiness and idle
time features. For each input feature, a further five
statistical parameters were calculated (minimum,
maximum, mean, median, and standard deviation).
The aim was to summarise the distribution of each
feature through these statistical parameters, to be used
as input for the classifier.
4 EVALUATION
The methodology of the proposed method in the
previous section was evaluated using C5.0 algorithm.
It is a development of C4.5 machine learning
algorithm that is based on decision trees. C5.0 is
accurate and need lower time in execution compared
with other ML methods. Several techniques has been
added to this algorithm such as boosting. The
boosting based on idea of Adaptive Boosting that was
introduced in (Freund and Schapire, 1995). This
feature avoid the classifier from over-fitting by
combing the weak classifiers with strong one, which
reduces the error in the predications. The classifier
evaluated the architecture by utilising the data that
were collected from accessing ten users; each user
was asked to browse eleven applications (i.e., BBC
news, Facebook, Google search, Skype, Yahoo mail,
YouTube, Bing, CNN, Gmail, Amazon, and
Instagram).
The accuracy of the used classifier depends highly
on the quality of the training data to build strong
classifier. Hence, the data was collected per
application and dumped in files for analysing. Each
user had 30 sessions for each applicationn, with each
session lasting for 2-5 minutes. The data collection
Figure 4: Various behaviour of eleven applications.
ICISSP 2019 - 5th International Conference on Information Systems Security and Privacy
400
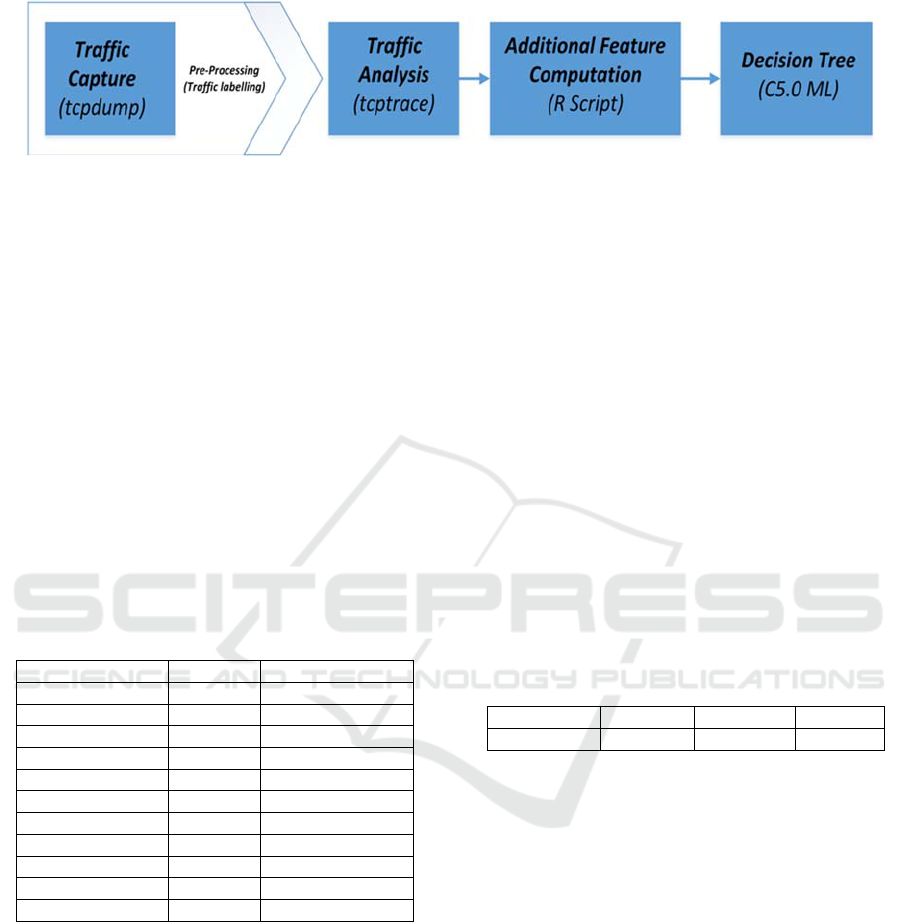
Figure 5: Proposed traffic classification methodology.
process spanned between May and July 2017. Table
1 summarises the data collection of the conducted
experiment. C5.0 was chosen based on its ability to
outperform other classification algorithms, as shown
by similar prior studies such as (Bujlow et al., 2012).
It has many advantages compared with advanced
machines learning models such as neural network and
support vector machine, it is easy to deploy, and
capable of dealing with different types of problem,
and it can make a a decision based on few training
examples(Galathiya et al., 2012).
4.1 Accuracy
The evaluation of the proposed features versus the
traditional ones was carried out using three feature
sets.
Table 1: Summary of the data collection.
A
pp
lication Flows Duration
(
h
)
BBC news 56394 25
Faceboo
k
9630 21.97
Google 45960 13
Sk
yp
e 3948 14.88
Yahoo mail 76674 15.66
YouTube 18816 17.9
Bing 30953 10.55
CNN 25123 11.2
G-mail 49720 10.13
Amazon 51793 12
Insta
g
ram 5641 11.15
The first feature set included the features that were
suggested from the previous studies; the second
feature set contained the burstiness and idle time
features that were proposed by this paper as were
shown in Table I, while the third feature set combined
both sets. The data were divided into 70/30 for
training/testing. The algorithm (classifier) was
applied to all three feature sets with different boosting
values (i.e., 0, 10, 100) that improved the
performance of the classifier. The results of the
classifier are presented in table 2 at boosting factor
equal to 100. The results signify that the features
related to the burstiness and idle time have high
efficiency in discriminating the different applications.
Combining both sets showed considerable
improvement in classification accuracy peaking at
(97.4%). The proposed features showed the ability to
better description for the applications than the other
parameters, which enhance the classifier capability.
4.2 Confusion Matrix
The accuracy, as presented in the previous section,
represents only the ratio of correctly classified
instances versus all instances. For further
investigating, the performance of the classifier across
all applications, the confusion matrix table is
presented in table 3 to describe the performance of the
classifier for each class. The row shows the instances
in the predicated class while column shows the
instances in the actual class.
Table 2: Accuracy with Different Feature Sets.
Feature sets Set1 Set2 Both
Accurac
y
92.45 94.09 97.4
The diagonal of the matrix represents the number
of samples that are correctly classified as interest
class and called True Positive (TP). The rest of the
values in the row of each application are
misclassified False Positives (FP), and the rest of the
values in the column of each application are
misclassified False Negatives (FN). The overall
performance of the classifier is considerably high for
all applications except for the Bing application. Out
of the total tested samples, it was observed that
Amazon had the least number of false negatives and
was classified with high accuracy, while it was zero
for Gmail and Skype. The reason for having these
applications high classification accuracy could be
attributed due to that they have unique behavior from
the others. The applications performing the lowest in
terms of classification were Bing and Google. For
application Bing, a significant number of samples
were misclassified as CNN due to some similarity of
the functionality of both of these applications. In
A Novel Features Set for Internet Traffic Classification using Burstiness
401
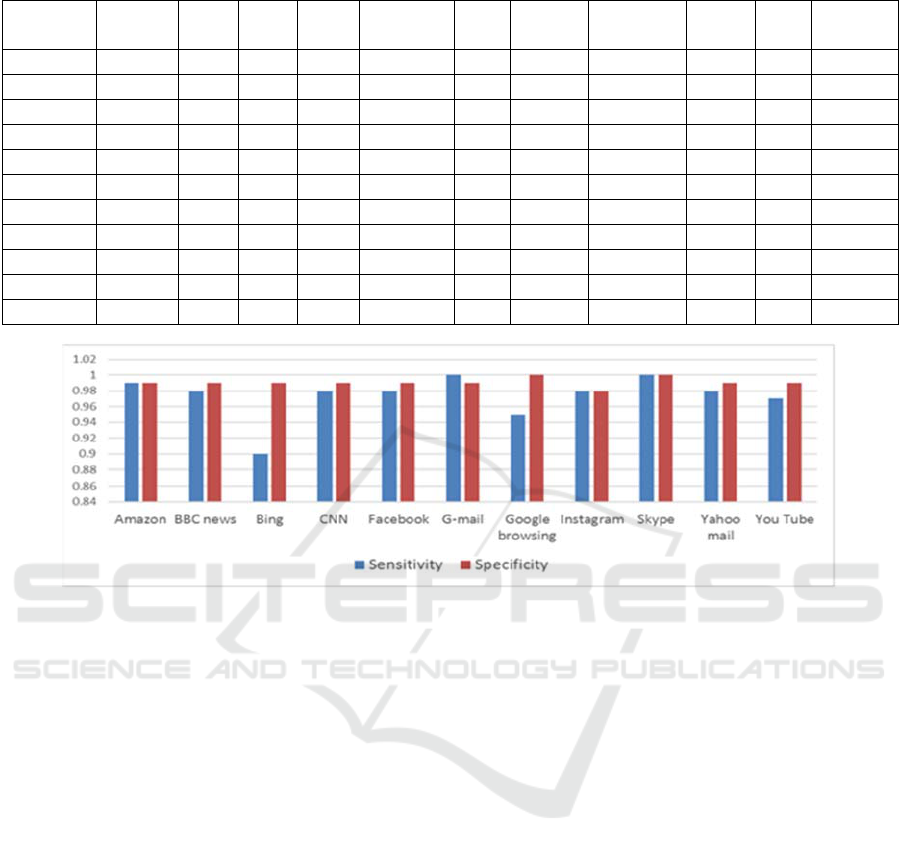
Table 3: Confusion Matrix for all features.
Apps Amazon BBC Bing CNN Facebook
G-
mail
Google Instagram Skype
Y-
mail
Youtube
Amazon 99 0 2 0 0 0 0 0 0 0 0
BBC 0 98 2 2 0 0 0 0 0 0 0
Bin
g
1 0 90 0 0 0 1 0 0 1 0
CNN 0 1 5 98 0 0 0 0 0 0 0
Faceboo
k
0 0 0 0 98 0 0 2 0 1 0
G-mail 0 0 0 0 0 100 2 0 0 0 1
Goo
g
le 0 0 1 0 1 0 95 0 0 0 0
Insta
g
ram 0 0 0 0 0 0 0 98 0 0 0
Sk
yp
e 0 0 0 0 0 0 0 0 100 0 0
Y-mail 0 1 0 0 0 0 1 0 0 98 2
Youtube 0 0 0 0 1 0 1 0 0 0 97
Figure 6: Sensitivity and specificity factor per traffic class.
addition, for application Google was mismatched as
Bing, Gmail, Yahoo mail and You Tube. This was
due to that the Google application could be as a
background search engine for many applications.
Other applications also performed rather well, only
having two samples classified as false negatives.
Overall, the accuracy for all applications was
satisfactorily high.
4.3 Sensitivity and Specificity Factor
These parameters are a measure of the ability of a
classifier to identify and discriminate samples of
given classes. Sensitivity refers to the derived
model’s capability to predict the samples that belong
to a class or application, while specificity refers to the
generated prediction model’s capability to mark and
differentiate that these samples do not belong to a
given class. Both sensitivity and specificity factors
for the built classifier are shown in figure 6 using all
data sets with a boost factor of 100. As previously
highlighted by the confusion matrix, the sensitivity of
Bing was the lowest (<90%) due to misclassification
with CNN. The overall sensitivity ranged above
(95%). The specificity factor across all eleven
applications was considerably high, ranging between
(98-100) percent, depicting the high segregation
ability of the prediction.
5 CONCLUSION
The present study proposed a novel set of features for
identifying applications or characterising Internet
traffic. This set of features is based on inter-arrival
timing between packets, most specifically burstiness
and idle time. This set of features was evaluated
regarding accuracy for predicting new applications
against a data set that was captured from ten users that
were running eleven applications. The features were
extracted using the tcptrace tool and the applications
were determined using C5.0 classifier. The results
showed that the novel set of features produced a
significant accuracy than traditional classifiers, also
combine traditional features with a proposed set of
features led to a very high accuracy of up to 97.4%.
For future work, we would focus beyond the
scope of a single connection to investigate at a session
ICISSP 2019 - 5th International Conference on Information Systems Security and Privacy
402

of traffic as generated by users in order to capture
traffic with multiple remote services and multiple
connections. We envisage the accuracy would
increase further and the method would be more robust
to more applications by including spacing between
connections or timing between connections.
REFERENCES
Alshammari, R. and Zincir-Heywood, A. N. (2015) ‘How
Robust Can a Machine Learning Approach Be for
Classifying Encrypted VoIP?’, Journal of Network and
Systems Management, 23(4), pp. 830–869. doi:
10.1007/s10922-014-9324-6.
Auld, T., Moore, A. W. and Gull, S. F. (2007a) ‘Bayesian
neural networks for internet traffic classification.’,
IEEE transactions on neural networks / a publication
of the IEEE Neural Networks Council, 18(1), pp. 223–
239. doi: 10.1109/TNN.2006.883010.
Auld, T., Moore, A. W. and Gull, S. F. (2007b) ‘Traffic
Classification’, 18(1), pp. 223–239.
Bakhshi, T. and Ghita, B. (2016a) ‘On Internet Traffic
Classification: A Two-Phased Machine Learning
Approach’, Journal of Computer Networks and
Communications, 2016(May). doi:
10.1155/2016/2048302.
Bakhshi, T. and Ghita, B. (2016b) ‘Traffic profiling:
Evaluating stability in multi-device user environments’,
Proceedings - IEEE 30th International Conference on
Advanced Information Networking and Applications
Workshops, WAINA 2016, pp. 731–736. doi:
10.1109/WAINA.2016.8.
Barlet-ros, P. (2014) ‘Extended Independent Comparison of
Popular Deep Packet Inspection ( DPI ) Tools for
Traffic Classification’.
Bashir, A. et al. (2013) ‘Classifying P2P activity in Netflow
records: A case study on BitTorrent’, IEEE
International Conference on Communications, pp.
3018–3023. doi: 10.1109/ICC.2013.6655003.
Boukhtouta, A. et al. (2016) ‘Network malware
classification comparison using DPI and flow packet
headers’, Journal of Computer Virology and Hacking
Techniques. Springer Paris, 12(2), pp. 69–100. doi:
10.1007/s11416-015-0247-x.
Buczak, A. and Guven, E. (2015) ‘A survey of data mining
and machine learning methods for cyber security
intrusion detection’, IEEE Communications Surveys &
Tutorials, PP(99), p.1. doi:
10.1109/COMST.2015.2494502.
Bujlow, T., Riaz, T. and Pedersen, J. M. (2012) ‘A method
for classification of network traffic based on C5.0
machine learning algorithm’, 2012 International
Conference on Computing, Networking and
Communications, ICNC’12, pp. 237–241. doi:
10.1109/ICCNC.2012.6167418.
Crotti, M. et al. (2007) ‘Traffic classification through
simple statistical fingerprinting’, ACM SIGCOMM
Computer Communication Review, 37(1), p. 5. doi:
10.1145/1198255.1198257.
Este, A., Gringoli, F. and Salgarelli, L. (2009) ‘Support
Vector Machines For Tcp Traffic Classification’,
Journal of Computer Networks, 53(14), pp. 2476–2490.
Finsterbusch, M. et al. (2014) ‘A survey of payload-based
traffic classification approaches’, IEEE
Communications Surveys and Tutorials, 16(2), pp.
1135–1156. doi: 10.1109/SURV.2013.100613.00161.
Freund, Y. and Schapire, R. E. (1995) ‘A desicion-theoretic
generalization of on-line learning and an application to
boosting’, 139, pp. 23–37. doi: 10.1007/3-540-59119-
2_166.
Galathiya, A., Ganatra, A. and Bhensdadia, C. (2012)
‘Improved Decision Tree Induction Algorithm with
Feature Selection, Cross Validation, Model Complexity
and Reduced Error Pruning’, International Journal of
Computer Science and Information Technologies, 3(2),
pp. 3427–3431. Available at:
http://ijcsit.com/docs/Volume
3/Vol3Issue2/ijcsit2012030227.pdf.
Hajjar, A., Khalife, J. and Díaz-Verdejo, J. (2015)
‘Network traffic application identification based on
message size analysis’, Journal of Network and
Computer Applications, 58, pp. 130–143. doi:
10.1016/j.jnca.2015.10.003.
Hofstede, R. et al. (2014) ‘Flow Monitoring Explained:
From Packet Capture to Data Analysis with NetFlow
and IPFIX’, IEEE Communications Surveys &
Tutorials, 16(c), pp. 1–1. doi:
10.1109/COMST.2014.2321898.
Joe Touch; Eliot Lear, Allison Mankin, Markku Kojo,
Kumiko Ono, M. S. and Lars Eggert, Alexey Melnikov,
Wes Eddy, and A. Z. (no date) IANA. Available at:
http://www.iana.org/assignments/service-names-port-
numbers/service-names-port-numbers.xhtml
(Accessed: 4 March 2016).
Khater, N. Al (2015) ‘Network Traffic Classification
Techniques and Challenges’, (Icdim), pp. 43–48.
Lazarou, G. Y. et al. (2009) ‘Describing Network Traffic
Using the Index of Variability’, IEEE/ACM
Transactions on Networking, 17(5), pp. 1672–1683.
doi: 10.1109/TNET.2008.2010494.
Moore, A. and Papagiannaki, K. (2005) ‘Toward the
accurate identification of network applications’,
Passive and Active Network Measurement. Available
at: http://link.springer.com/chapter/10.1007/978-3-
540-31966-5_4 (Accessed: 4 March 2016).
Moore, A. W. et al. (2005) ‘Internet traffic classification
using bayesian analysis techniques’, Proceedings of the
2005 ACM SIGMETRICS international conference on
Measurement and modeling of computer systems -
SIGMETRICS ’05, 33(1), p. 50. doi:
10.1145/1064212.1064220.
Park, B. et al. (2013) ‘Fine-grained traffic classification
based on functional separation’, International Journal
of Network Management, 23(5), pp. 350–381. doi:
10.1002/nem.1837.
Roughan, M. and Sen, S. (2004) ‘Class-of-service mapping
for QoS: a statistical signature-based approach to IP
A Novel Features Set for Internet Traffic Classification using Burstiness
403

traffic classification’, Proceedings of the 4th …, pp.
135–148. doi: 10.1145/1028788.1028805.
Ulliac, A. and Ghita, B. V (no date) ‘Non-Intrusive
Identification of Peer-to-Peer Traffic’, in 2010 Third
International Conference on Communication Theory,
Reliability, and Quality of Service, pp. 175–183.
Valenti, S. et al. (2013) ‘Reviewing traffic classification’,
Lecture Notes in Computer Science (including
subseries Lecture Notes in Artificial Intelligence and
Lecture Notes in Bioinformatics) Lecture Notes in
Artificial Intelligence and Lecture Notes in
Bioinformatics), 7754, pp. 123–147. doi: 10.1007/978-
3-642-36784-7-6.
Vlăduţu, A., Comăneci, D. and Dobre, C. (2017) ‘Internet
traffic classification based on flows’ statistical
properties with machine learning’, International
Journal of Network Management, 27(3), p. e1929. doi:
10.1002/nem.1929.
Yoon, S., Park, J. and Kim, M. (2015) ‘Behavior Signature
for Fine-grained Traffic Identification’, Appl. Math,
9(2L), pp.523-534, 534(2), pp. 523–534.
ICISSP 2019 - 5th International Conference on Information Systems Security and Privacy
404
