
Accurate Prediction of Advertisement Clicks based on Impression and
Click-Through Rate using Extreme Gradient Boosting
T
¨
ulin C¸ akmak
1
, Ahmet T. Tekin
1
, C¸ a
˘
gla S¸enel
1
, Tu
˘
gba C¸ oban
1
,
Zeynep Eda Uran
1
and C. Okan Sakar
2
1
Data Science Department, Cerebro Software Services Inc., Istanbul, Turkey
2
Computer Engineering Department, Bahcesehir University, Istanbul, Turkey
Keywords:
Click-through Rate, Hotel Impression, Metasearch Bidding Engines, Ensemble Learning, Filter Feature
Selection.
Abstract:
Online travel agencies (OTAs) aim to use digital media advertisements in the most efficient way to increase
their market share. One of the most commonly used digital media environments by OTAs are the metasearch
bidding engines. In metasearch bidding engines, many OTAs offer daily bids per click for each hotel to get
reservations. Therefore, management of bidding strategies is crucial to minimize the cost and maximize the
revenue for OTAs. In this paper, we aim to predict both the impression count and Click-Through-Rate (CTR)
metrics of hotel advertisements for an OTA and then use these values to obtain the number of clicks the OTA
will take for each hotel. The initial version of the dataset was obtained from the dashboard of an OTA which
contains features for each hotel’s last day performance values in the search engine. We enriched the initial
dataset by creating features using window-sliding approach and integrating some domain-specific features that
are considered to be important in hotel click prediction. The final set of features are used to predict next day’s
CTR and impression count values. We have used state-of-the-art prediction algorithms including decision
tree-based ensemble methods, boosting algorithms and support vector regression. An important contribution
of this study is the use of Extreme Gradient Boosting (XGBoost) algorithm for hotel click prediction, which
overwhelmed state-of-the-art algorithms on various tasks. The results showed that XGBoost gives the highest
R-Squared values in the prediction of all metrics used in our study. We have also applied a mutual informa-
tion filter feature ranking method called minimum redundancy-maximum relevance (mRMR) to evaluate the
importance of the features used for prediction. The bid value offered by OTA at time t − 1 is found to be the
most informative feature both for impression count and CTR prediction. We have also observed that a subset
of features selected by mRMR achieves comparable performance with using all of the features in the machine
learning model.
1 INTRODUCTION
The commercial value of the advertisement on the
Web depends on whether the users click on the adver-
tisement. Click on the advertisement allows Internet
companies to identify the most relevant advertisement
for each user and improve the user experience. More
specifically, the click-through rate (CTR), which is
the ratio of the number of clicks to the impression
count, is one of the most significant metrics used to
calculate the commercial value of an advertisement.
The CTR is used in search advertising to rank ads, and
price clicks (Wang et al., 2013). The impression is a
term that refers to the point in which ad is viewed once
by a visitor. Getting higher CTR affects pay-per-click
(PPC) success since it directly leads how much ad-
vertisers pay (Richardson et al., 2007) for each click.
PPC advertising is an auction-based system where
the highest bidder commonly gains the most featured
placement. The advertiser pays the advertising plat-
form when their advert is clicked on.
In this paper, we aim to predict both the im-
pression count and CTR metrics of hotel advertise-
ments for an online travel agency (OTA). OTAs give
Internet-Based advertisements to meta-search bidding
engines with a pay-per-click model in order to get a
reservation from these engines. Therefore, accurate
prediction of the number of clicks each advertisement
will get has a significant importance for OTAs in ad-
justing their advertisement budgets and building their
Çakmak, T., Tekin, A., ¸Senel, Ç., Çoban, T., Uran, Z. and Sakar, C.
Accurate Prediction of Advertisement Clicks based on Impression and Click-Through Rate using Extreme Gradient Boosting.
DOI: 10.5220/0007394306210629
In Proceedings of the 8th International Conference on Pattern Recognition Applications and Methods (ICPRAM 2019), pages 621-629
ISBN: 978-989-758-351-3
Copyright
c
2019 by SCITEPRESS – Science and Technology Publications, Lda. All rights reserved
621

revenue models.
In literature, there are several studies are aiming at
predicting the click. In one of these studies, Zhang et
al. (Zhang et al., 2014) fed the past actions of the
users as input to a Recurrent Neural Networks for
click prediction. This approach is based on the fact
that users’ past behaviors are directly related to users’
click probability. Cheng et al. (Cheng et al., 2012)
integrated some additional features into the click pre-
diction model to enrich the dataset and thus increase
the success rate of their model in click prediction.
In addition to click prediction studies, many meth-
ods have been used to predict and analyze CTR and
impression values of advertisements in different sec-
tors. For example, Xiong et al. (Xiong et al., 2012)
analyzed the relationship between the CTR of an ad-
vertisement and the ads shown on the same page. The
results showed that the CTR highly depends on the
ads shown on the same page indicating that this in-
formation can be used to improve the success rate of
click prediction models. In another study, Effendi and
Ali (Effendi and Ali, 2017) stated that CTR predic-
tion has been used over the past several years in every
type of advertisement format and search engine ad-
vertisements. Also, the prediction of the impression is
an important business requirement which is used for
bid optimization and related tasks. Therefore, in our
study, we firstly aim to predict the impression value
and CTR which is then used for click prediction. Pre-
dicted click is calculated by multiplying predicted im-
pression and predicted CTR.
In our study, we also apply a filter-based feature
ranking method to get insight about the effectiveness
of the features in the prediction of click-related met-
rics and also to achieve better or comparable perfor-
mance with using all features as input. We present
a comparative analysis of the success rates of state-
of-the-art prediction algorithms, which are Random
Forest, Gradient Boosting, AdaBoost, Support Vec-
tor Regression, and eXtreme Gradient Boosting algo-
rithms in click prediction.
2 MATERIALS AND METHODS
2.1 Data Description
The dataset used in this study is the report data re-
ceived from the OTA dashboard. The dataset contains
both numerical and categorical features. Some of the
columns are eliminated during the data analysis phase
as they contain a high ratio of missing data. The de-
scriptions and data types of the features are given in
Table 1 along with their statistical parameters.
2.2 Feature Selection
Feature selection is an important task that may alle-
viate the effect of the curse-of-dimensionality prob-
lem which worsens the generalization ability of the
models (Friedman, 1997). In our study, we used
a filter feature selection algorithm called minimum
Redundancy-Maximum Relevance (mRMR) (Zhang
et al., 2008) which is based on the use of mutual in-
formation. The mRMR algorithm aims to choose a
minimal subset of features by maximizing the rele-
vance of the selected features with the target variable
and also minimizing the redundancies among the se-
lected features. Our dataset consists of more than 200
columns which may worsen the performance of ma-
chine learning algorithms. Therefore, we applied fea-
ture selection to eliminate some of the features in or-
der to obtain maximum efficiency with minimum fea-
tures. Besides, we aim to gain insight into the predic-
tive power of the domain-specific features integrated
into the dataset.
2.3 Modelling
Regression models in machine learning are used to
predict numerical target variables. There are many
literature studies that aim to estimate clicks, CTR,
cost-per-click (CPC) values (Richardson et al., 2007;
Nabi-Abdolyousefi, 2015). In this study, we ap-
plied support vector regression (SVR), random for-
est, extreme gradient boosting (XGBoost), AdaBoost
and gradient boosting for hotel impression and CTR
prediction which have successfully been applied for
many regression tasks. These algorithms are briefly
described in this section.
SVR is the regression version of Support Vec-
tor Machines and has many successful applications
in modeling non-linear regression problems (Balfer
and Bajorath, 2015). AdaBoost is a machine learn-
ing meta-algorithm which can be seen as the first suc-
cessful boosting algorithm. Although it has been pro-
posed as an ensemble learning approach for classifi-
cation problems, it has later been adapted to regres-
sion problems and shown to be less susceptible to
the overfitting problem than other learning algorithms
(Ridgeway et al., 1999). Random forest is another en-
semble learning algorithm which is based on combin-
ing the predictions of many decision trees. The main
idea behind such ensemble approaches is to construct
a single strong model based on many weak models. It
has many successful applications for different kind of
problems (Cootes et al., 2012; Svetnik et al., 2003).
XGBoost is a recently proposed algorithm which
is a scalable machine learning method based on boost-
ICPRAM 2019 - 8th International Conference on Pattern Recognition Applications and Methods
622
Table 1: Definition of features obtained from OTA dashboard.
Feature Explanation type min max Categorical Values Fill Rate
hotel impr
Number of impression received for a hotel.
numerical 1 28,418 100%
profit
The value remaining from booking
commission after total cost is deducted.
numerical -244.6 0 96.77%
outbid ratio
Reduced exposure of the company’s rates
from all potential impressions in the city
search results as a percentage value due to
being outbid by another advertiser.
numerical 0 1 99.97%
max potential
Maximum traffic an advertiser can achieve
for a hotel or a POS by bidding up.
numerical 0 16,397 100%
meet
How many times an advertiser rate was the
cheapest rate.
numerical 0 1 96.77%
booking value
index
Estimated average booking amount per
click for a hotel compared to the company’s
average booking amount per click.
categorical - -
Above Average,
Below Average,
Average, High,
Low
96.77%
impr share
Percentage of impression the company
received out of the total number of hotel
impressions.
numerical 0 1 100%
opp cpc
Smallest required cpc for each hotel to get a
significant growth in traffic.
numerical 0 1 97.76%
bid
CPC applied to the hotel.
numerical 0 0.56 96.77%
log date
The date that the data has been logged.
date - - - 100%
rating
Rating value of hotel on the
metasearch platform.
numerical 0 95.28 83.87%
unavailability
The number of times an advertiser did not
send a rate or timed out, for the total number
of impressions the hotel received
numerical 0 1 99.46%
hotelTypes Hotel types is the type of hotel. categorical - - Summer, city 97.48%
clicks
Number of clicks as counted by the
metasearch platform.
numerical 0 1,618 100%
beat
Number of times an advertiser rate was the
unique cheapest rate compared to competitors’
rates, for the hotel received
numerical 0 1 96.77%
cost Total CPC cost numerical 0 244.63 100%
city Name of the city where the hotel is located. categorical - -
80 different
values
99.95%
stars
Used to classify hotels according to their
quality.
numerical 0 5 99.95%
avg cpc
Average amount the company has been
charged for a click
numerical 0 0.99 98.86%
lose
Number of times an advertiser rate was
expensive/not the cheapest rate compared to
one or more competitors’ rates, for the total
number of impressions the hotel received
numerical 0 1 96.77%
position
Position of the company’s advertisement on
meta search engine’s result page.
numerical 0 1 96.77%
ing approach. It is getting more popular due to
its superiority to many machine learning algorithms
in several machine learning competitions (Adam-
Bourdarios et al., 2015). For example, in (Malani
et al., ) it has been shown that XGBoost is more suc-
cessful in predicting the hourly demands of a bike
station than state-of-the-art methods. The most im-
portant factor behind the success of XGBoost is its
scalability in all scenarios. The system runs more
than ten times faster than existing popular solutions
on a single machine and scales to billions of exam-
ples in distributed or memory-limited settings (Chen
et al., 2015). The scalability of XGBoost is due to
several important approaches and algorithmic opti-
mizations (Friedman, 2001; Babajide Mustapha and
Saeed, 2016; Malani et al., ). We used grid search
Accurate Prediction of Advertisement Clicks based on Impression and Click-Through Rate using Extreme Gradient Boosting
623
to optimize the hyper-parameter of all machine learn-
ing algorithms used in this study. In this study, 50 %
percent of the samples are used for training, 25 % for
validation, and the remaining 25 % for testing. Dur-
ing the splitting process, the data was shuffled and the
data split module of the sci-kit-library was used.
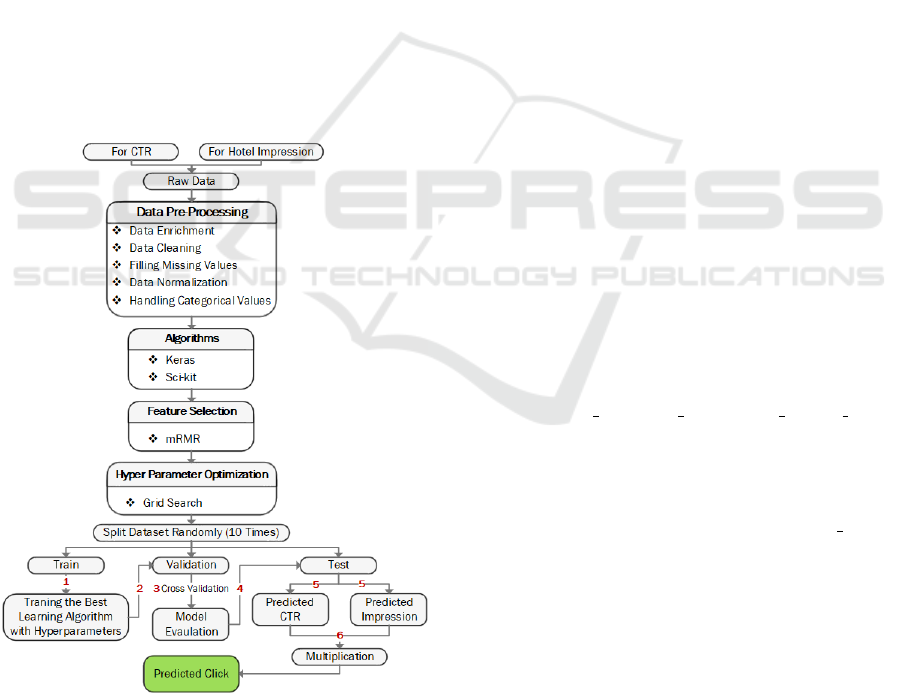
3 PROPOSED METHODOLOGY
The two datasets used to predict CTR and impression
count in this study share the same set of input vari-
ables except for the labels. Therefore, we present a
single flowchart for both of the prediction models in
Fig. 1. All of the preprocessing operations described
in Section 2 are applied to both of the datasets. There
are several ways to estimate the clicks that a hotel will
get in a given time period. In this study, instead of di-
rectly estimating clicks, we propose to predict CTR,
hotel impression values and then multiply these two
predicted values to generate the click prediction for
the related hotel in a specific day. The flowchart of
the proposed prediction system is given in Fig. 1.
Figure 1: Learning Curve for dataset.
Hotel impression (shortly will be referred to as im-
pression) is the number of impressions received for
a hotel. An impression is recorded for a hotel on a
search result page when a user makes at least one click
on that hotel. It is an important indicator of the pop-
ularity of a hotel and can be used to assess the traffic
potential of a specific hotel. The impression of a hotel
is positively correlated with the marketing potential
of the hotel. The definitions of the important metrics
used in this study are given below:
Click: The number of clicks as counted by meta-
search bidding engine.
Click-Through-Rate (CTR): Total Clicks on Ad /
Total Impressions
CPC: Cost-Per-Click applied to the hotel by the
company.
Cost: CPC x Click
The detailed descriptions of the features are shown
in Table 1. Due to the business requirement, the com-
pany would prefer impression to be predicted instead
of click. Also, the predicted impression would be the
input of other prediction tasks. Therefore, instead of
using click directly as the target variable of a machine
learning model, we first predict impression and CTR
and multiply these two estimations to obtain the click
estimation. Another business requirement was to esti-
mate how many clicks the company is going to receive
from all the hotels during the day. For this reason, a
success criterion based on the sum of the predicted
values was established. The working dataset consists
of the report that the OTA system gives the company
the next day. In this data, there is detailed informa-
tion about the performance of the bids of the OTA
for each hotel such as the number of impressions and
clicks each hotel takes, the total sales for each hotel,
and cost-per-click on each hotel.
Firstly, data cleaning methods were applied to
data. For this purpose, the columns that could not be
used for machine learning algorithms were dropped
(such as hotel url, hotel name, Last pushed date.).
Then, duplicate rows were eliminated, like more than
one data row from the same day. Later on, data en-
richment steps were applied. Hotels can be catego-
rized as city or summer hotel according to their loca-
tions. We have created a variable called hotel type in
order to represent this hotel type information. Con-
sidering the importance of upcoming public holidays
in the prediction of potential increasing reservations,
duration of the holiday and number of days until the
start of the holiday are integrated to the dataset as
new columns. The price and position (placement of
the advertisement of OTA) information for each ho-
tel in the meta-search bidding engine is also added as
new variables, which also includes the prices and po-
sitioning information of the nearest competitors from
the sources provided by the company. With the use of
sales data of the company, the net total profit of the
sale, the number of rooms and nights sold were also
ICPRAM 2019 - 8th International Conference on Pattern Recognition Applications and Methods
624

added as new columns.
After data enrichment step, missing values in the
dataset were filled. There were several missing val-
ues in the OTA report which can be filled using some
statistical methods. For instance, when the value of
“click” variable is 0, and the cost is missing, the cost
is set to 0 since it is known that the related hotel did
not take any clicks in the corresponding date. Miss-
ing values in hotel related properties, such as stars,
rating are filled with the average value of the column.
The categorical values representing a property of the
hotel (such as a city) is filled with the most frequent
data point of that column. Ordinal categorical vari-
ables like booking
value index are mapped to integer
values.
We should also note that the OTA reports, which
have significant value for the machine learning algo-
rithms, are provided with a delay of 24 hours by the
OTA. To overcome this limitation and also use the im-
portant sequential information in the prediction task,
the average values of the last 3, 7, 30 days of OTA re-
port are inserted into the training set. The day of the
week information is added to the train set as it can be
an important indicator of click amount. Besides, bid,
click and profit values for each hotel are added; both
last values from the previous day and the values from
same weekday of last week. The price of the hotel in
the last 10 days is also added as separate columns to
capture the changing trends in prices. As a result of
the steps described above, the data set consisting of
201 features, and 800237 samples are obtained.
4 EXPERIMENTAL RESULTS
The dataset was divided into 3 parts as “train set”,
“test set” and “validation set” as described in 2.3.
50% of the data was used as the training set, 25% of
the data was used as the validation set, and the re-
maining 25% of the data was used as the test set. We
repeated the train-test split operation 10 times, and the
average results obtained on the test set are presented.
4.1 Predictions with Original Dataset
The results obtained by feeding all of the features as
input to the machine learning algorithms are given in
Tables 2, 3 and 4. The results show that XGBoost, in
overall, performs better than the other machine learn-
ing algorithms for both CTR and impression predic-
tion tasks. The highest R-Squared value obtained in
the prediction of individual-hotel based CTR and im-
pression values are 0.61 and 0.84, respectively, both
achieved by XGBoost. The other two tree-based al-
gorithms, Random Forest and Gradient Boosting, are
ranked after XGBoost. The results show that SVR
and AdaBoost do not result in generalizable models
on this task. The highest R-Squared value of 0.81 in
the click prediction task is also obtained with the XG-
Boost algorithm. It is also seen that the success in
predicting the impression value is higher than that of
CTR.
The results also indicate that the algorithms per-
form better in predicting the daily sum click values,
which is referred to as “SumSuccess” in the results,
than hotel-based predictions. This value represents
the total number of clicks that the advertisements of
the OTA overall hotels will take the next day. It is seen
that the tree-based ensemble methods give compara-
ble results for this task which are over 0.95 in overall.
Table 2: Comparison of algorithms for CTR prediction.
CTR Algorithms Result
Algorithms R
2
RMSE
a
MAE
b
CV Mean R
2
SumSuccess
Random Forest 0.55 0.046 0.022b 0.52 0.97
GradientBoosting 0.57 0.045 0.021 0.58 0.99
AdaBoost 0.30 0.197 0.17 0.12 0.35
SVR(kernel=’rbf)’ 0.25 0.098 0.083 - 0.47
XGBoost 0.61 0.045 0.02 0.59 0.98
a
Root Mean Square Error.
b
Mean Absolute Error.
Table 3: Comparison of algorithms for IMPRESSION pre-
diction.
Impression Algorithms Result
Algorithms R
2
RMSE
a
MAE
b
CV Mean R
2
SumSuccess
Random Forest 0.80 593.25 260.92 0.81 0.98
GradientBoosting 0.80 596.35 268.79 0.79 0.98
AdaBoost 0.35 1457.39 1236.26 0.20 0.50
SVR(kernel=’rbf) 0.27 1423.74 657.33 - -
XGBoost 0.84 637.40 274.17 0.84 0.99
a
Root Mean Square Error.
b
Mean Absolute Error.
Table 4: Comparison of Algorithms for Click prediction by
(prediction Impression * Prediction CTR).
Impression Algorithms Result
Algorithms R
2
RMSE
a
MAE
b
SumSuccess
Random Forest 0.50 37.37 16.87 0.93
GradientBoosting 0.63 32.16 15.94 0.97
AdaBoost 0.40 490.79 383.21 0.08
SVR(kernel=’rbf) 0.35 105.12 67.84 0.44
XGBoost 0.81 27.84 13.54 0.95
a
Root Mean Square Error.
b
Mean Absolute Error.
Accurate Prediction of Advertisement Clicks based on Impression and Click-Through Rate using Extreme Gradient Boosting
625
4.2 Predictions with Selected Features
In this study, the Minimum Redundancy Maximum
Relevance (mRMR) algorithm, which is a method of
selecting an effective feature subset, has been applied
for both of the prediction tasks. The main goal of
mRMR implementation is to choose a minimal sub-
set of these features which have maximum joint rel-
evance with the target variable and minimum redun-
dancy among the set of selected features. The mRMR
algorithm was applied to data two times by drawing
a random subset of samples to avoid the training set
bias. Top 85, 125, 150 features ranked by mRMR
were fed to machine learning algorithms.
The top-ranked variables in both of the runs are
shown in Tables 5 and 6. As seen in the results, the
bid of the last day given for the related hotel and the
rating of the hotel are important values in the predic-
tion of both CTR and impression. Another important
finding is that the variable representing the length of
the closest holiday is an effective feature in the pre-
diction of click-related metrics. The region of the ho-
tel has also been ranked among the top positions in
both of the runs. We should also note that the posi-
tion of the advertisement of the OTA for the related
hotel is found to be as an important domain-specific
variable containing predictive information about the
click-related metrics.
Table 5: top10 CTR Columns.
NO First Run Second Run
1 lastdaybid rating
2 avg7hotel impr avg30profit
3 days of holiday weekday Monday
4 rating avg3meet
5 region 1 region 2
6 region 2 days of holiday
7 top4 min price 9 region 2
8 avgprofit top4 min price
9 my min position avg30outbidratio
10 weekday Monday my min position 9
The errors obtained by using the mRMR selected
features in the prediction task are given in Tables 7
and 8. We used XGBoost since it performed the best
results on the original dataset. We show the results
for all 201 features, the common 85 top-ranked fea-
tures in the two mRMR runs, top 125 and 150 fea-
tures of both mRMR runs. The results show that the
errors obtained with less number of variables using
Table 6: top10 Impression Columns.
NO First Run Second Run
1 lastdaybid rating
2 avg7hotel impr avg30profit
3 days of holiday avg30outbidratio
4 rating weekday Monday
5 avgprofit top4 min price
6 weekday Monday days of holiday
7 top4 min price 9 region 2
8 region 2 region 1
9 my min position avg3meet
10 region 1 my min position 9
mRMR are comparable to those obtained using all of
the features. Therefore, in our final system, top-85
mRMR features have been used since using less num-
ber of features reduces memory usage, the number of
features that should be crawled/collected and cost of
online learning and test processes.
Table 7: Results obtained with mRMR features for CTR
prediction using XGBoost algorithm.
CTR
mRMR
mRMR Result
repeating in
first half 85
Top 125 1 Top 125 2 Top 150 1 Top 150 2
R
2
0.5785 0.5775 0.5750 0.5768 0.5727
R.M.S.E
0.0447 0.0447 0.0447 0.0447 0.0447
M.A.E.
0.0210 0.0209 0.0209 0.020 0.020
Table 8: Results obtained with mRMR features for impres-
sion prediction using XGBoost algorithm.
Impression
mRMR
mRMR Result
repeating in
first half 85
Top 125 1 Top 125 2 Top 150 1 Top 150 2
R
2
0.7579 0.8139 0.8122 0.821 0.8178
R.M.S.E.
667.4375 585.2386 587.8947 573.0349 579.0564
M.A.E.
291.3 247.3 246.1 243.4 243.0
After selecting the optimal subset of original vari-
ables with mRMR method, we have applied grid
search for hyper-parameter optimization to improve
the success of the algorithms further. In the predic-
tion of impression, the following candidate values for
the hyper-parameters of the XGBoost are tried:
n estimators = [50, 100, 150, 200, 250, 500]
max depth = [2, 3, 4, 6, 7, 8]
learning rate = [0.01, 0.1, 0.2, 0.3, 0.4]
gamma = [0(de f ault), 5, 10, 20, 50, 100]
(1)
Totally 3240 fits (1080: parameter combination, 3
folds) was acquired and best hyper-parameters were
ICPRAM 2019 - 8th International Conference on Pattern Recognition Applications and Methods
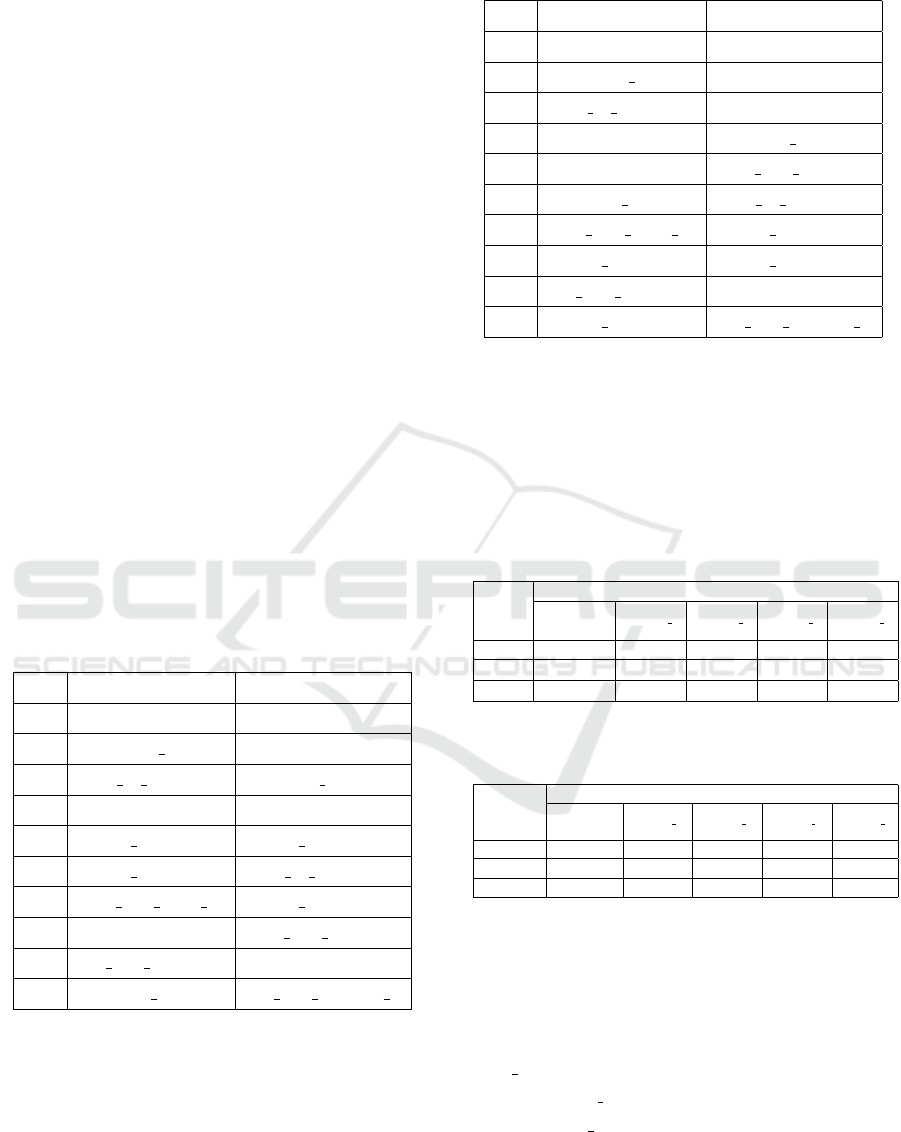
626
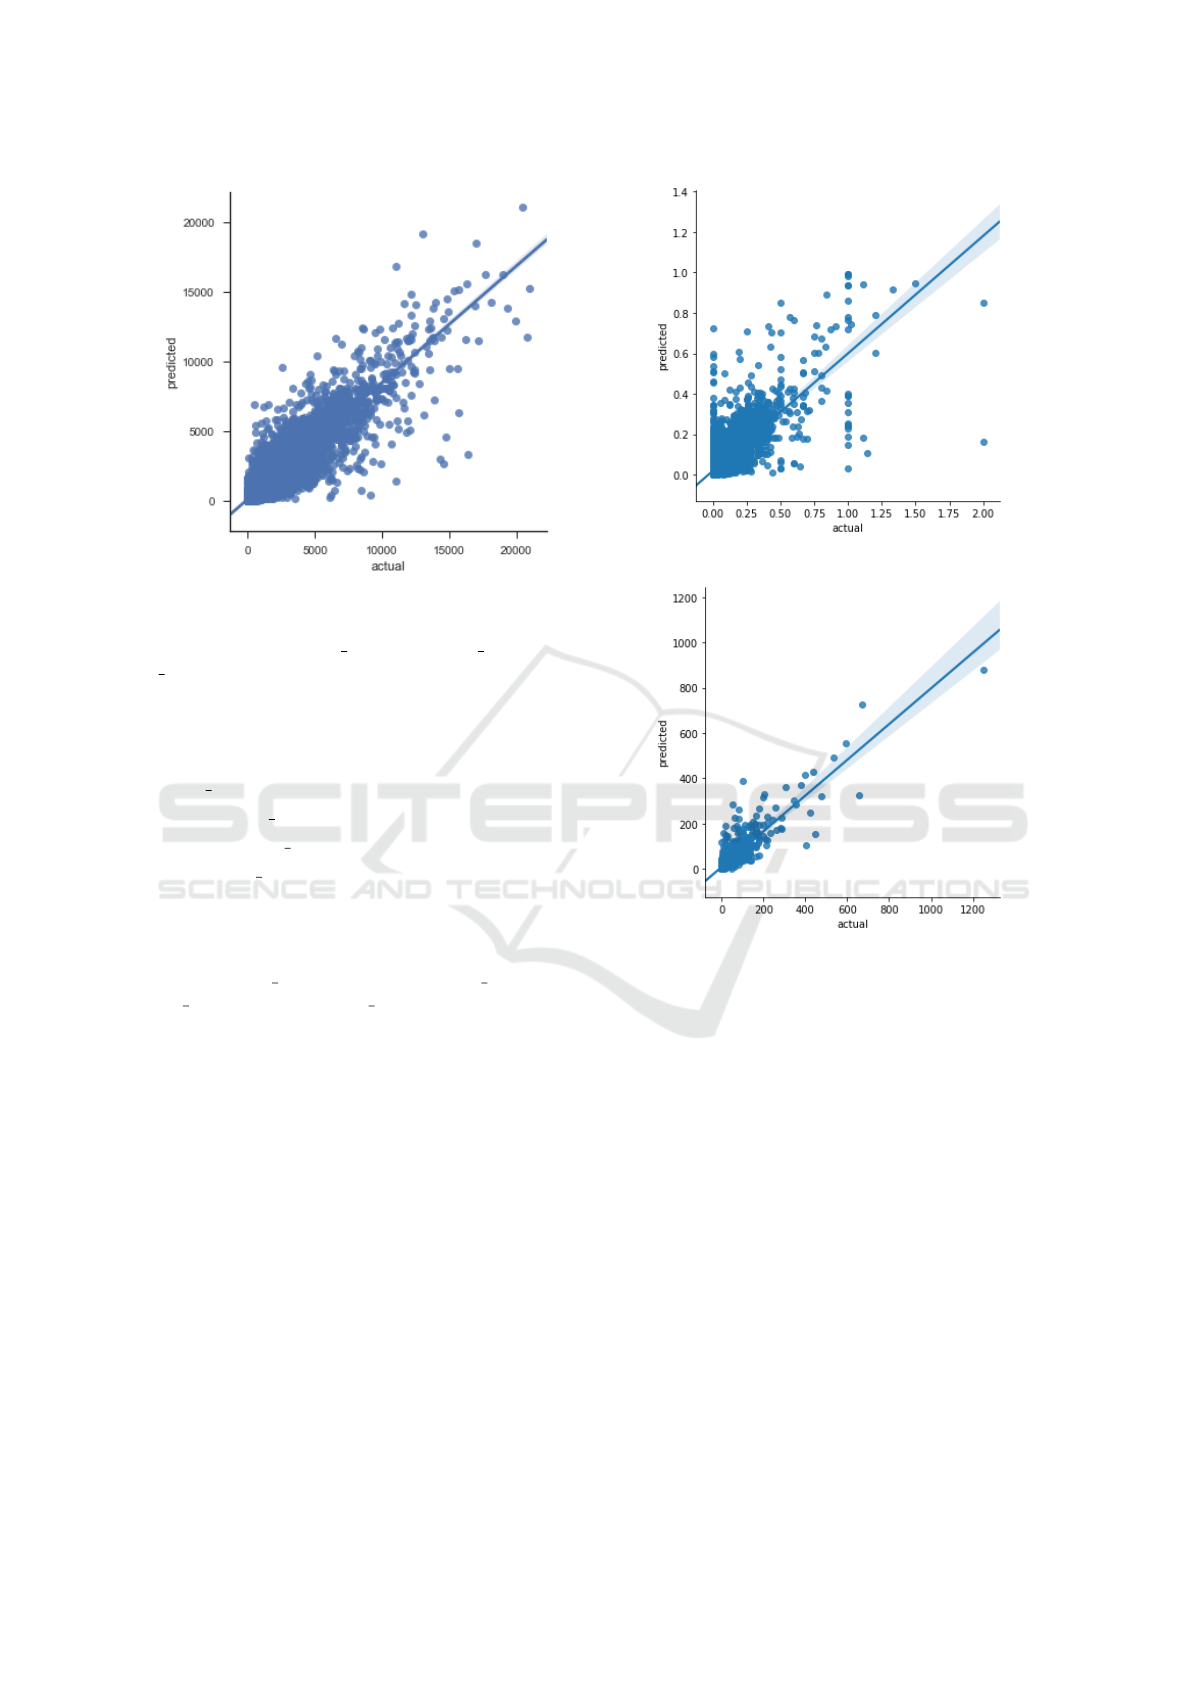
Figure 2: Actual & Predicted Impression.
found to be as learning rate = 0.1, max depth = 8,
n estimators = 200, gamma = 0. The best R-Squared
value in the prediction of impression was again 0.84
with lower MAE and RMSE.
For CTR prediction, the following parameters
were fitted:
n estimators = [50, 100, 150, 200, 500]
learning rate = [0.1, 0.05, 0.02, 0.01]
max depth = [3, 6, 8, 10]
colsample bytree = [0.25, 0.33, 0.5, .75, 1.0]
(2)
The model is trained for 1200 times with the spec-
ified hyper-parameter values and applied on the val-
idation set. The best performing parameters have
been found as n estimators= 500, learning rate= 0.02,
max depth= 10, colsample bytree=0.25. The high-
est R-Squared value has been increased from 0.57 to
0.65 with the application of grid-search based hyper-
parameter optimization. Therefore, we have used the
values of the hyper-parameters found with the grid-
search method for both CTR and impression predic-
tion.
Actual and predicted impression values produced
by the best XGBoost model on the test examples are
given in Fig. 2. It is seen that the model is successful
in predicting even the comparably extreme values of
an impression. On the other hand, as seen in Fig. 3,
the predictions on the CTR values are less successful
when compared to that of the impression. It is clearly
seen that the model tends to produce lower predictions
than the actual values especially with the increasing
value of CTR.
Fig. 4 shows the actual and predicted click val-
ues, which are the product of the impression and CTR
values. As it is seen, the predictions and actual val-
Figure 3: Actual & Predicted CTR.
Figure 4: Actual & Predicted Click.
ues were distributed around the line showing that the
model successfully captures the underlying structures
of the data.
5 CONCLUSION
In this paper, we aimed to predict the number of clicks
each hotel will take the next day in the meta-search
bidding engine using historical data. For this pur-
pose, first, we applied many data preprocessing tech-
niques and prepared the dataset in a time-delay for-
mat, then used a filter feature selection method to re-
duce the number of features, and finally fed the se-
lected subset of features to a set of machine learn-
ing algorithms. The main contribution of this paper is
to obtain the final click prediction based on the esti-
mation of Click-Through-Rate (CTR), and hotel im-
pression values since the estimation of these values
Accurate Prediction of Advertisement Clicks based on Impression and Click-Through Rate using Extreme Gradient Boosting
627

are also required in the related tasks. We multiplied
the estimations of CTR and impression values and ob-
tained the click prediction for the next day.
The results show that the highest R
2
obtained by
multiplying CTR and impression was 0.81. The other
success criterion, which can be regarded as the total
success, is based on comparing the sum of actual and
predicted values over all hotels. We have achieved
95% SumSuccess criterion, which shows the effec-
tiveness of the features extracted from the original
dataset.
We applied Support Vector Regression (SVR) and
random forest algorithms which are known to be suc-
cessful regression algorithms. The results showed
that decision tree-based boosting algorithms outper-
formed SVR and random forest on this dataset. The
highest R-Squared value obtained in the prediction
of individual-hotel based CTR and impression values
are 0.65 and 0.84, respectively, both achieved by XG-
Boost. Another contribution is to observe that a sub-
set of features selected by mRMR technique achieves
comparable performance to using all of the features
in the machine learning model. The obtained results
showed that the most important features are the bid of
the last day and rating of the hotel for both CTR and
impression prediction. We should also note that the
variables representing the length of the closest holi-
day, the region of the hotel, and the position of the
advertisement of the OTA for the related hotel are
among the top-ranked variables in both CTR and im-
pression prediction problems. These results show that
they carry important and complementary information
about the target variables. As a future direction, we
aim to construct sequential models using different ar-
chitectures of recurrent neural networks for click pre-
diction.
REFERENCES
Adam-Bourdarios, C., Cowan, G., Germain-Renaud, C.,
Guyon, I., K
´
egl, B., and Rousseau, D. (2015).
The higgs machine learning challenge. In Journal
of Physics: Conference Series, volume 664, page
072015. IOP Publishing.
Agresti, A. (1996). An introduction to categorical data anal-
ysis.
Babajide Mustapha, I. and Saeed, F. (2016). Bioactive
molecule prediction using extreme gradient boosting.
Molecules, 21(8):983.
Balfer, J. and Bajorath, J. (2015). Systematic artifacts in
support vector regression-based compound potency
prediction revealed by statistical and activity land-
scape analysis. PloS one, 10(3):e0119301.
Chapelle, O., Manavoglu, E., and Rosales, R. (2015). Sim-
ple and scalable response prediction for display adver-
tising. ACM Transactions on Intelligent Systems and
Technology (TIST), 5(4):61.
Chen, T., He, T., Benesty, M., et al. (2015). Xgboost: ex-
treme gradient boosting. R package version 0.4-2,
pages 1–4.
Cheng, H., Zwol, R. v., Azimi, J., Manavoglu, E., Zhang,
R., Zhou, Y., and Navalpakkam, V. (2012). Multime-
dia features for click prediction of new ads in display
advertising. In Proceedings of the 18th ACM SIGKDD
international conference on Knowledge discovery and
data mining, pages 777–785. ACM.
Cootes, T. F., Ionita, M. C., Lindner, C., and Sauer, P.
(2012). Robust and accurate shape model fitting using
random forest regression voting. In European Confer-
ence on Computer Vision, pages 278–291. Springer.
Dave, K. S. and Varma, V. (2010). Learning the click-
through rate for rare/new ads from similar ads. In Pro-
ceedings of the 33rd international ACM SIGIR con-
ference on Research and development in information
retrieval, pages 897–898. ACM.
Effendi, M. J. and Ali, S. A. (2017). Click through rate
prediction for contextual advertisment using linear re-
gression. arXiv preprint arXiv:1701.08744.
Esmael, B., Arnaout, A., Fruhwirth, R., and Thonhauser, G.
(2015). A statistical feature-based approach for opera-
tions recognition in drilling time series. International
Journal of Computer Information Systems and Indus-
trial Management Applications, 5:454–461.
Friedman, J. H. (1997). On bias, variance, 0/1—loss, and
the curse-of-dimensionality. Data mining and knowl-
edge discovery, 1(1):55–77.
Friedman, J. H. (2001). Greedy function approximation: a
gradient boosting machine. Annals of statistics, pages
1189–1232.
Kotsiantis, S., Kanellopoulos, D., and Pintelas, P. (2006).
Data preprocessing for supervised leaning. Interna-
tional Journal of Computer Science, 1(2):111–117.
Li, J., Zhang, P., Cao, Y., Liu, P., and Guo, L. (2012). Effi-
cient behavior targeting using svm ensemble indexing.
In 2012 IEEE 12th International Conference on Data
Mining, pages 409–418. IEEE.
Loshin, D. (2001). Enterprise knowledge management: The
data quality approach.
Lup Low, W., Lee, M., and Ling, T. (2001). A knowledge-
based approach for duplicate elimination in data
cleaning. Information Systems, 26:585–606.
Malani, J., Sinha, N., Prasad, N., and Lokesh, V. Forecast-
ing bike sharing demand.
M
¨
uller, A. C., Guido, S., et al. (2016). Introduction to ma-
chine learning with Python: a guide for data scien-
tists, volume 35. ” O’Reilly Media, Inc.”.
Nabi-Abdolyousefi, R. (2015). Conversion rate prediction
in search engine marketing. PhD thesis.
Richardson, M., Dominowska, E., and Ragno, R. (2007).
Predicting clicks: Estimating the click-through rate
for new ads. In Proceedings of the 16th International
Conference on World Wide Web, WWW ’07, pages
521–530, New York, NY, USA. ACM.
ICPRAM 2019 - 8th International Conference on Pattern Recognition Applications and Methods
628

Ridgeway, G., Madigan, D., and Richardson, T. (1999).
Boosting methodology for regression problems. In
AISTATS.
Silverman, D. (2010). Iab internet advertising revenue re-
port. Interactive Advertising Bureau, 26.
Son, N. H. (2003). Data cleaning and data preprocessing.
Svetnik, V., Liaw, A., Tong, C., Culberson, J. C., Sheridan,
R. P., and Feuston, B. P. (2003). Random forest: a
classification and regression tool for compound clas-
sification and qsar modeling. Journal of chemical in-
formation and computer sciences, 43(6):1947–1958.
Wang, F., Suphamitmongkol, W., and Wang, B. (2013). Ad-
vertisement click-through rate prediction using mul-
tiple criteria linear programming regression model.
Procedia Computer Science, 17:803–811.
Winkler, W. E. (2003). Data cleaning methods.
Witten, I. H., Frank, E., Hall, M. A., and Pal, C. J. (2016).
Data Mining: Practical machine learning tools and
techniques. Morgan Kaufmann.
Xiong, C., Wang, T., Ding, W., Shen, Y., and Liu, T.-
Y. (2012). Relational click prediction for sponsored
search. In Proceedings of the fifth ACM international
conference on Web search and data mining, pages
493–502. ACM.
Zhang, Y., Dai, H., Xu, C., Feng, J., Wang, T., Bian, J.,
Wang, B., and Liu, T.-Y. (2014). Sequential click pre-
diction for sponsored search with recurrent neural net-
works. In AAAI, volume 14, pages 1369–1375.
Zhang, Y., Ding, C., and Li, T. (2008). Gene selection algo-
rithm by combining relieff and mrmr. BMC Genomics,
9(2):27.
Accurate Prediction of Advertisement Clicks based on Impression and Click-Through Rate using Extreme Gradient Boosting
629
