
A Framework for Discovering Frequent Event Graphs from Uncertain
Event-based Spatio-temporal Data
Piotr S. Maci ˛ag
Institute of Computer Science, Warsaw University of Technology, Nowowiejska 15/19, 00-665, Warsaw, Poland
Keywords:
Uncertain Spatio-temporal Data, Probabilistic Sequential Patterns, Fuzzy Microclustering.
Abstract:
The aim of this paper is to discuss a novel framework designed for discovering frequent event graphs from
uncertain spatio-temporal data. We consider the problem of discovering hidden relations between event types
and their set of uncertain spatio-temporal instances. For that purpose, we designed the following data mining
framework: microclustering of uncertain instances, generating set of possible worlds according to the possible
worlds semantic technique, creating a microclustering index for each world, generating a set of event graphs
from created microclusters and defining apriori based algorithm mining frequent event graphs (EventGraph
Miner). To the best of our knowledge this is the first approach to discover hidden patterns from event-type
spatio-temporal data when dataset contains uncertain instances. While the paper does not present experimental
results for the proposed framework, it presents its potential for futher studies in the topic.
1 INTRODUCTION
Discovering various forms of patterns from spatio-
temporal data is gaining attention of researchers
nowadays (Li, 2014). This fact is motivated by the
rapid development of sensing techniques, designing
new types of sensor networks and introducing new
types of spatial and temporal data. The classifica-
tion of spatio-temporal data distinguishes two basic
types of such data: event-based and trajectory-based
(Li, 2014).
In the article, we refer to the second from men-
tioned type of data. The notion of sequential pattern
discovered from reliable event-based spatio-temporal
data has been introduced in (Huang et al., 2008). The
task is to discover all significant sequences of event
types, where for any two consecutive types contained
in the sequence, instances of the preceding event type
attract in their spatio-temporal neighborhoods occur-
rences of instances of the following event type.
The problem of uncertainty is particularly impor-
tant for spatio-temporal data due to often unreliable
nature of sensors gathering physical or environmen-
tal signals, noise introduced by transmission proto-
cols or faults in data storage methods. Unfortunately,
the problem of discovering probabilistic patterns from
such type of data is still not well investigated. On
the other hand, the problem of discovering knowledge
from several types of uncertain data (e.g. transac-
tion databases) has been considered in the literature
((Chui et al., 2007; Aggarwal et al., 2009; Chui and
Kao, 2008; Aggarwal, 2009; Zhang et al., 2008; Ber-
necker et al., 2009; Leung and MacKinnon, 2014)).
An extensive overview of methods for mining uncer-
tain data is given in (Aggarwal, 2009). The problem
of discovering probabilistic sequential patterns from
uncertain trajectory data is considered in (Li et al.,
2013). A solution for querying uncertain trajectory
data is given in (Emrich et al., 2012). The problem
of discovering various types of patterns from spatial
co-location data under uncertainty is considered in
(Ouyang et al., 2017; Wang et al., 2016).
The common technique adapted for discovering
knowledge from uncertain data is possible worlds se-
mantic. The technique is based on generating possi-
ble worlds containing certain occurrences of instances
and calculating probability of an occurrence of the
world. Such probabilities are used in estimating sig-
nificance of a pattern occurring over multiple worlds.
The notions important for our article are event
type and event instances. We assume existence of
event types set F = { f
1
, f
2
, . . . , f
n
} and corresponding
dataset of event instances D. Each instance e ∈ D is
associated with the following set of attributes: event
identifier, event type and a list of possible locations
for both spatial and temporal domain, where each lo-
cation is given with certain probability of occurrence.
Additionally, probabilities of occurrences in each lo-
656
Maci ˛ag, P.
A Framework for Discovering Frequent Event Graphs from Uncertain Event-based Spatio-temporal Data.
DOI: 10.5220/0007411206560663
In Proceedings of the 8th International Conference on Pattern Recognition Applications and Methods (ICPRAM 2019), pages 656-663
ISBN: 978-989-758-351-3
Copyright
c
2019 by SCITEPRESS – Science and Technology Publications, Lda. All rights reserved

cations list sum to one. The task considered in the
paper is to discover hidden relations between event
types based on the set of their uncertain instances. As
an attempt to solve the problem we provide a novel
framework described in section 2.
In the paper, we introduce the notion of expected
frequent event graph and we give a framework for
mining such graphs. Frequent event graphs repre-
sent a patterns between event types in set F. De-
signed framework discovers expected frequent event
graphs in the following manner: first the set of un-
certain instances and their possible locations are mi-
croclustered according to their event types. The aim
of microclustering is to reduce the size of dataset by
merging any locations of the same instance contained
in the microcluster. From the set of created micro-
clusters, we generate possible worlds according to
the possible worlds semantic. Then, for each world
and its set of microclusters, we create a microcluster-
ing index which contains the following information:
identifiers of microclusters in each world, a list of in-
stances contained in each microcluster, an event type
representative for the microcluster and centroid loca-
tion in both spatial and temporal aspects. Based on
the set of created microclusters for a particular world
we create event graphs. The event graph is a directed
acyclic graph which nodes correspond to microclus-
ters and their labels to event types. The edges of
the graph are created based on the user given speci-
fication of neighborhood spaces between microclus-
ters. The support of an event graph is the number of
isomorphic subgraphs of event graphs in a particular
world. The expected support of a given event graph
is the sum of supports of such graph in all generated
worlds weighted by the probabilities of occurrences
of these worlds. Frequent event graphs are those with
expected support greater than the given threshold.
The following parts of the article are organized
as follows. The proposed framework for mining fre-
quent event graphs is given in section 2. We provide
basic notions in section 2.1. In section 3, we give
an algorithm for microclustering uncertain instances.
The steps for generating possible worlds and micro-
clustering index for each world are described in sec-
tion 3.1. In section 4, our algorithm discovering fre-
quent event graphs is discussed. Section 5 contains
conclusions, discussion and possible future work.
2 A FRAMEWORK FOR MINING
FREQUENT EVENT GRAPHS
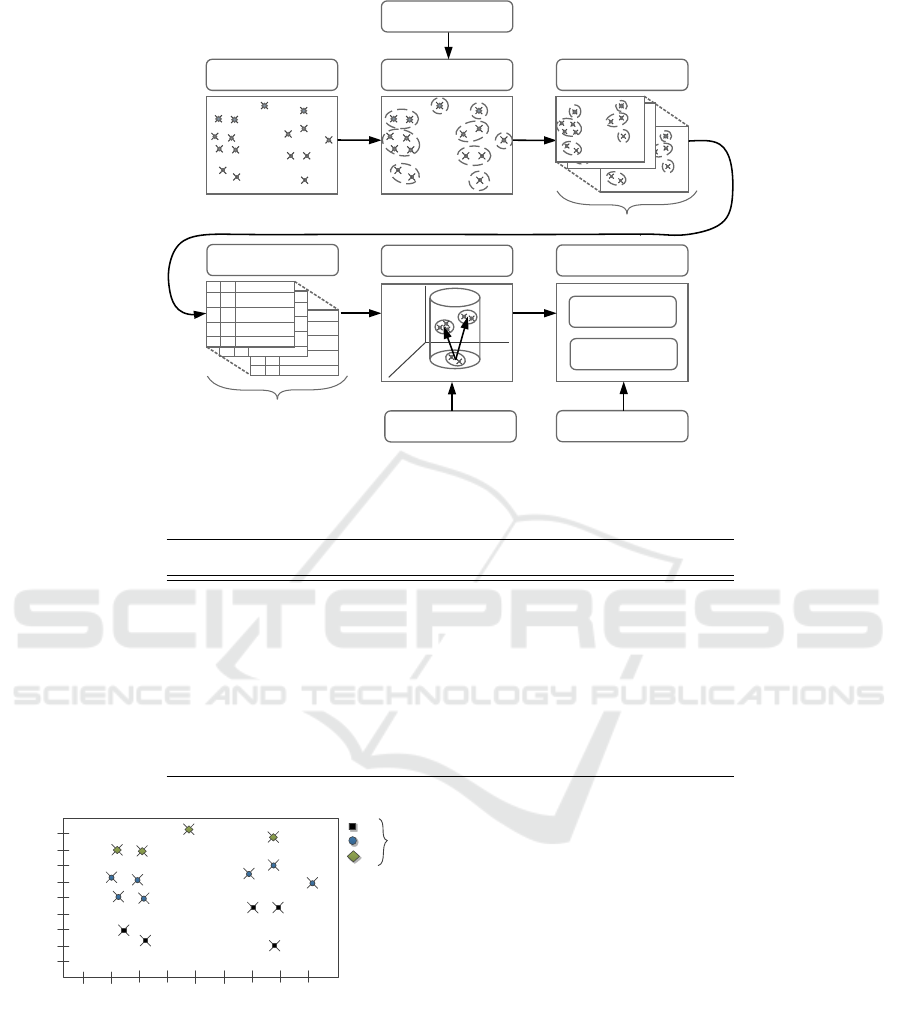
The process of mining expected frequent event graphs
is performed according to the framework shown in
Figure 1. In the designed framework, first data is
compressed and transformed from the set of uncer-
tain event instances to the set of microclusters. In the
next step, the set of possible worlds is generated for
created microclusters. In section 4, we introduce an
event graph for created microclusters. The result of
the algorithm is the set of event graphs for which the
expected support is greater than the given minimum
support threshold (we define such graphs as frequent
event graphs).
2.1 Basic Notions
We provide elementary notions important for our for-
mulation of considered problem. The two sets are
provided: event types F = { f
1
, f
2
, . . . , f
N
} and dataset
of uncertain event instances D.
Definition 1 (Spatio-temporal Space V
ST
). By V
ST
we
denote the whole embedding spatio-temporal space
for a given problem.
Let us consider an example given in Figure 2.
Note that the spatial area is usually given by two di-
mensions (i.e. longitude and latitude). For simplicity
we denote the spatial aspect in Figure 2 with only one
dimension. The number of event types in Figure 2 is
3.
Definition 2 (Uncertain Event Instance). Uncertain
event instance e ∈ D is a triple associated with the
following constants: instance ID, event type and a
list of possible locations of e, where each location
is given with a certain probability of an occurrence.
We denote these constants using the following nota-
tion: e.ID, e.EventType, e.Locations = (l
1
, l
2
, . . . , l
n
).
Furthermore, for each possible location e.l, e.l.Loc
denotes spatial coordinates, e.l.Time occurrence time
and e.l.Probability probability of an occurrence.
Let us consider an example given in Figure 2. In-
stance e
1
is of type A and has two possible locations.
The two assumptions are important to note: (1) we
assume that each possible location is occurring in a
point, (2) probabilities of occurrences of locations
are summing to one (that is, having an instance e,
∑
l
i
∈e.Locations
(e.l
i
.Probability) = 1, where i is index-
ing locations of an instance e).
The common technique adapted for discovering
various types of patterns from uncertain data in data
mining is possible worlds semantic. In the technique,
possible worlds are generated as all possible combi-
nations of occurrences of instances locations: in each
word only one location of each uncertain instance
may occur. The probability of an occurrence of the
world is calculated as the product of probabilities of
A Framework for Discovering Frequent Event Graphs from Uncertain Event-based Spatio-temporal Data
657
ID ET Locations
1 A (0, 1, 1, 0.2 )
2 B (1, 2, 3, 0.6 )
3 B (1, 5, 5, 0.4 )
4 C (0, 3, 1, 0.7 )
ID ET Locations
1 A (0, 1, 1, 0.2 )
2 B (1, 2, 3, 0.6 )
3 B (1, 5, 5, 0.4 )
4 C (0, 3, 1, 0.7 )
Uncertain instances and their
possible locations
Uncertain microclustering of
locations / locations merging
ε1 and ε2 – user parameters
for microclustering
Generating possible worlds
M worlds
Generating microclustering
index for each world
M indexes
ID ET Locations
1 A (0, 1, 1, 0.2 )
2 B (1, 2, 3, 0.6 )
3 B (1, 5, 5, 0.4 )
4 C (0, 3, 1, 0.7 )
Creating set of event graphs
for each world
Mining expected frequent
event graphs
Minimal relative expected
support threshold
Longitude
Latitude
Time
Candidate generation
Isomorphism checking
Neighborhood space
specification
Figure 1: The framework for modelling and mining frequent event graphs.
Table 1: An example of event-based dataset with attributes: instance ID, event type, locations list.
ID Type Locations list (spatial coordinate, time, probability)
e
1
A l
1
= ((25, 3), 0.2), l
2
= ((33, 2), 0.8)
e
2
A l
1
= ((69, 4), 0.3), l
2
= ((78, 2), 0.5), l
3
= ((79, 4), 0.2)
e
3
B l
1
= ((33, 5), 1.0)
e
4
B l
1
= ((23, 5), 0.5), l
2
= ((31, 6), 0.5)
e
5
B l
1
= ((21, 6), 1.0)
e
6
B l
1
= ((72, 7), 0.4), l
2
= ((78, 7), 0.4), l
3
= ((92, 6), 0.2)
e
7
C l
1
= ((22, 8), 0.6), l
2
= ((33, 8), 0.4)
e
8
C l
1
= ((50, 9), 0.5), l
2
= ((78, 9), 0.5)
0
Time
Location
10 20 30 40 50 60 70 80 90
100
Event
Types
A
B
C
1
2
3
4
5
6
7
8
9
10
e1
0.2
e1
0.8
e2
0.3
e2
0.5
e2
0.2
e3
1.0
e4
0.5
e4
0.5
e6
0.4
e6
0.4
e7
0.4
e7
0.6
e8
0.5
e8
0.5
e5
1.0
e6
0.2
Figure 2: The visualization of the dataset given in Table 1.
occurrences of locations occurring in that world. Hav-
ing generated world, the support of a pattern discov-
ered in such world is weighted by the probability of
an occurrence of that world. The overall estimated
support of a pattern in the dataset D is the sum of
weighted supports of the pattern occurring in each
possible world.
Generating possible worlds directly from the set
of instances is in general infeasible. The number of
such worlds is bounded by |D|
Max
, where |D| denotes
the number of instances in D and Max denotes the
maximal number of possible locations among all in-
stances in D. An attempt to solve this problem is to
reduce the number of instances locations by perform-
ing microclustering of locations.
3 UNCERTAIN
MICROCLUSTERING
In this section, we consider the problem of uncer-
tain microclustering of instances locations. The idea
behind approach is: (1) to reduced dataset size; (2)
proceed with discovering patterns using created mi-
croclusters rather than particular instances. The set
of possible microclusters and locations contained in
ICPRAM 2019 - 8th International Conference on Pattern Recognition Applications and Methods
658
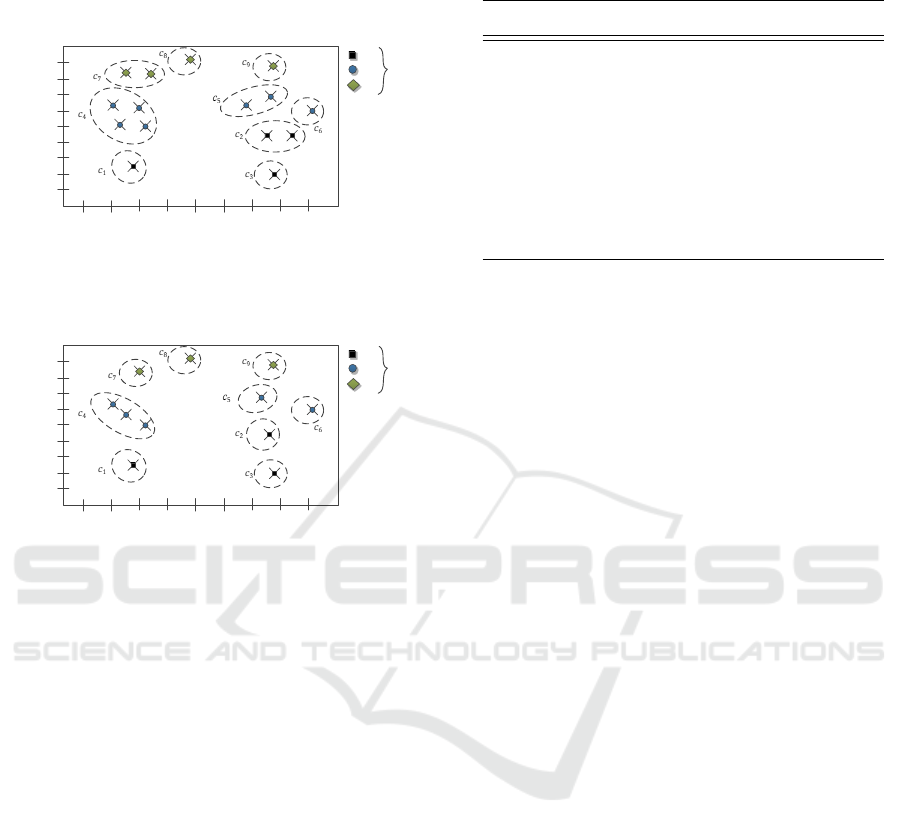
them before generating possible worlds for dataset in
Figure 2 is given in Figure 4. By D( f ) in Algorithm 1,
we denote the set of instances of event type f in D.
0
Time
Location
10 20 30 40 50 60 70 80 90
100
Event
Types
A
B
C
1
2
3
4
5
6
7
8
9
10
e1
1.0
e2
0.5
e2
0.3
e2
0.2
e6
0.2
e6
0.4
e6
0.4
e8
0.5
e3
1.0
e4
0.5
e4
0.5
e5
1.0
e7
0.4
e7
0.6
e8
0.5
Figure 3: A set of uncertain microclusters for dataset given
in Figure 2 before merging locations of the same instance
inside microclusters.
0
Time
Location
10 20 30 40 50 60 70 80 90
100
Event
Types
A
B
C
1
2
3
4
5
6
7
8
9
10
e1
1.0
e2
0.5
e2
0.5
e6
0.2
e6
0.8
e8
0.5
e3
1.0
e4
1.0
e5
1.0
e7
1.0
e8
0.5
Figure 4: A set of uncertain microclusters for dataset given
in Figure 2 after merging locations of the same instance in-
side microclusters.
In Algorithm 1, ε
1
and ε
2
are the neighborhood
distances for the microclustering algorithm. Algo-
rithm 1 iteratively verifies each possible location of
each instance and if that location is not in a micro-
cluster, then is inserted to the new microcluster. Al-
gorithm 2 retrieves all possible locations of instances
other than e.l, which are within distances ε
1
and ε
2
from e.l and are of the same type as e.EventType. All
these locations are inserted to the same microcluster
as e.l. ε
1
is the maximal spatial distance between spa-
tial coordinates e.l.Loc and spatial coordinates of any
other instance location (say p.l.Loc) of type f (that
is, p.l is considered to be the spatial neighbor of e.l
if distance(e.l.Loc, p.l.Loc) ≤ ε
1
). Distance function
is the Euclidean norm. ε
2
is the maximal temporal
interval between e.l.Time and any other possible lo-
cation of instances of type f . p.l is considered to be a
temporal neighbor of e.l if |e.l.Time− p.l.Time| ≤ ε
2
.
The purpose of step 9 in Algorithm 1 is to merge
all locations of the same instance occurring inside a
microcluster into one possible location. The proba-
bility of such location is the sum of probabilities of
merged locations and its spatial coordinates and oc-
currence time are calculated as averages of spatial co-
ordinates and occurrences times of merged locations.
Table 2: Uncertain microclusters generated for dataset
given in Table 1.
MCID Event Type Contained instances
c
1
A e
1
: 1.0
c
2
A e
2
: 0.5
c
3
A e
2
: 0.5
c
4
B e
3
: 1.0, e
4
: 1.0, e
5
: 1.0
c
5
B e
6
: 0.8
c
6
B e
6
: 0.2
c
7
C e
7
: 1.0
c
8
C e
8
: 0.5
c
9
C e
8
: 0.5
3.1 Generating Possible Worlds
Having a set of uncertain microclusters the next step
is to generate all possible worlds containing certain
occurrences of such microclusters. Table 2 contains
uncertain microclusters depicted in Figure 4. In-
stances e
2
, e
6
and e
8
may occur in different micro-
clusters and, due to that, there exist 8 possible worlds.
The first world contains the following microclusters
and instances: w
1
= {c
1
= { e
1
}, c
2
= {e
2
}, c
4
=
{e
3
, e
4
, e
5
}, c
5
= {e
6
}, c
7
= {e
7
}, c
8
= {e
8
}}. The
second one is w
2
= {c
1
= {e
1
}, c
3
= {e
2
}, c
4
=
{e
3
, e
4
, e
5
}, c
5
= {e
6
}, c
7
= {e
7
}, c
8
= {e
8
}}, etc. The
probability of an occurrence of each possible world is
the product of probabilities of instances locations con-
tained in the microclusters generated for such world
and is calculated according to Eq. 1. Having gener-
ated M worlds for a given set of uncertain microclus-
ters
∑
M
i=1
(P(w
i
)) = 1.
P(w) =
∏
c∈w
∏
e.l∈c
e.l.Probability (1)
For each possible world and for its microclus-
ters we generate a microclustering index. The micro-
clustering index contains identifiers of microclusters,
event type contained in a particular microcluster, a list
of contained locations of instances and the centroid
location for a microcluster. In Table 3, we give a mi-
croclustering index for world 1.
4 DISCOVERING FREQUENT
EVENT GRAPHS
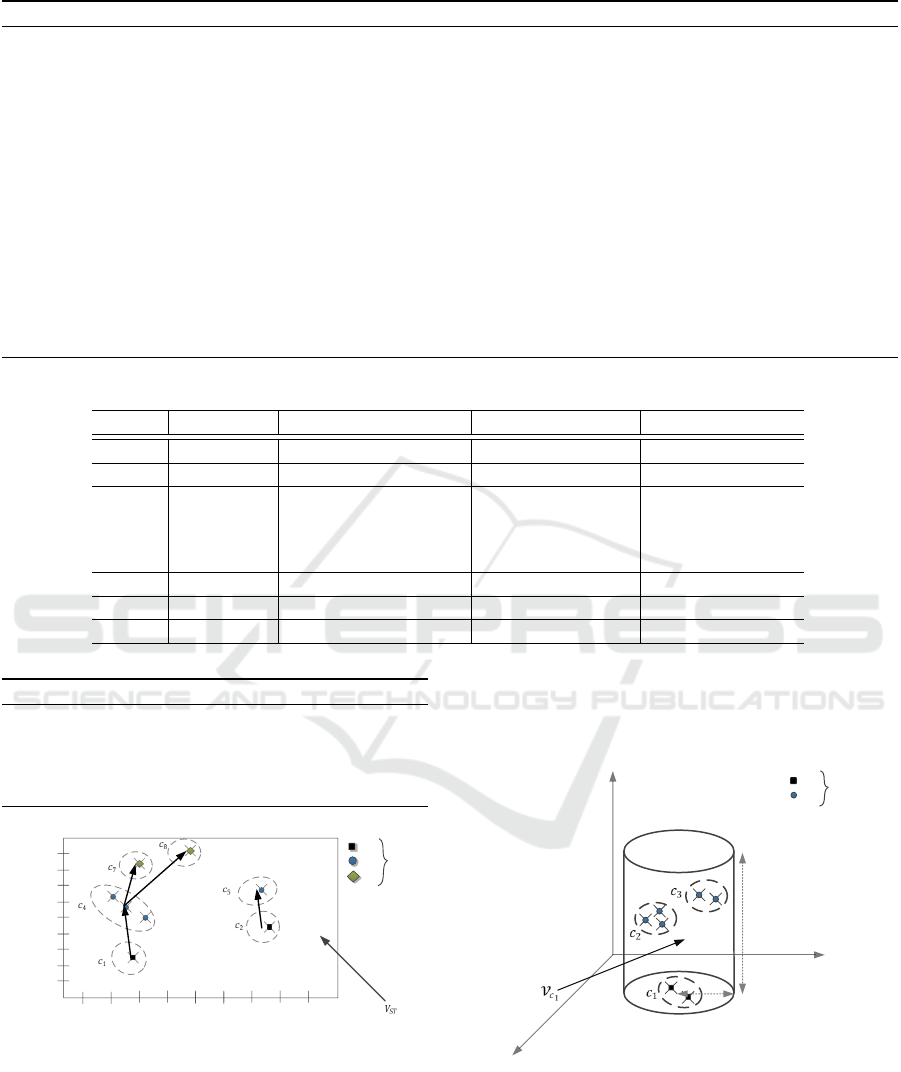
In Figure 5, we depict world w
1
which contains mi-
croclusters and instances locations generated accord-
ing to method proposed in subsection 3.1.
Definition 3 (Spatio-temporal Neighborhood Space).
For a microcluster c, its spatio-temporal neighbor-
A Framework for Discovering Frequent Event Graphs from Uncertain Event-based Spatio-temporal Data
659
Algorithm 1: Algorithm for generating uncertain microclusters.
Input: D - dataset of uncertain instances; ε
1
, ε
2
- neighborhood distances.
1: for each event type f ∈ F do
2: for each instance e ∈ D( f ) do
3: for each location l ∈ e.Locations do
4: if e.l does not belong to any microcluster then
5: Create new microcluster with MCID := MCID + 1.
6: Label e.l as belonging to the microcluster MCID.
7: X := RetrieveNeighbors(e.l, ε
1
, ε
2
)
8: Label each location p.l ∈ X as belonging to the microcluster MCID.
9: Merge all locations of the same instance in MCID into one location.
10: end if
11: end for
12: end for
13: end for
Table 3: The microclustering index created for microclusters of world 1 shown in Figure 5.
MCID Event type Contained locations Num. of locations Centroid location
c
1
A e
1
.l
1
= ((28, 2), 1.0) 1 (28, 2)
c
2
A e
2
.l
1
= ((75, 4), 0.5) 1 (75, 4)
c
4
B
e
3
.l
1
= ((33, 5), 1.0),
e
4
.l
1
= ((27, 5), 1.0),
e
5
.l
1
= ((21, 6), 1.0) 3 (27, 5)
c
5
B e
6
.l
1
= ((75, 7), 0.8) 1 (75, 7)
c
7
C e
7
.l
1
= ((27, 8), 1.0) 1 (27, 8)
c
8
C e
7
.l
1
= ((50, 9), 0.5) 1 (50, 9)
Algorithm 2: RetrieveNeighbors function.
Input: e.l - a possible location of instance e; ε
1
, ε
2
-
neighborhood distances.
1: Return all possible locations of instances other
than e.l within distance ε
1
and ε
2
from e.l.
0
Time
Location
10 20 30 40 50 60 70 80 90
100
Event
Types
A
B
C
1
2
3
4
5
6
7
8
9
10
e1
e2
e6
e3
e4
e5
e7
e8
Figure 5: Microclusters from world 1 and event graphs cre-
ated for them.
hood space V
c
is a cylindrical space defined by spatial
radius R and temporal interval T . The centroid’s spa-
tial coordinates of the microcluster are the center of
spatial circle with radius R and temporal interval of
length T is defined beginning with the time stamp of
centroid.
In Figure 6, we show spatio-temporal cylindrical
space for microcluster c
1
with parameters R = 4, T =
10.
Longitude
Latitude
Time
Event
Types
A
B
R
T
R = 4
T = 10
Figure 6: Spatio-temporal neighborhood space of micro-
cluster c
1
.
Definition 4. Given a microcluster c, its spatio-
temporal neighborhood space V
c
, we say all micro-
clusters which centroids are contained inside V
c
fol-
low c (in other words, there is a following relation
between such microclusters and c).
ICPRAM 2019 - 8th International Conference on Pattern Recognition Applications and Methods
660

For microcluster c
1
and its neighborhood space
V
c
1
shown in Figure 6, microclusters c
2
, c
3
of event
type B are following c
1
.
Definition 5 (Set of Event Graphs G). Given gener-
ated world w and a set of microclusters for that world,
a set of graphs G
w
contains all directed acyclic graphs
with nodes corresponding to microclusters and edges
denoting the following relations between microclus-
ters. The graph G = (V, E, L, λ) ∈ G
w
is defined as
follows:
1. V = (v
1
, v
2
, . . . , v
n
) is the set of vertices corre-
sponding to microclusters of a given world.
2. E = (x
1
, x
2
, . . . , x
m
) is the set of edges denoting
the following relation between microclusters.
3. L is the set of event types.
4. λ : V → L is the function assigning to each vertex
an event type of a microcluster represented by this
vertex.
Example 1. In Figure 5, we show microclusters gen-
erated for world 1. For this world G
w
1
contains two
directed acyclic graphs: G
1
:
• V
1
= {v
1
, v
2
, v
3
, v
4
}.
• E
1
= {(v
1
, v
2
), (v
2
, v
3
), (v
2
, v
4
)}.
• L
1
= {A, B, C}
• λ
1
(v
1
) = A, λ
1
(v
2
) = B, λ
1
(v
3
) = C, λ
1
(v
4
) = C.
and G
2
:
• V
2
= {v
1
, v
2
}.
• E
2
= {(v
1
, v
2
)}.
• L
2
= {A, B}.
• λ
2
(v
1
) = A, λ
2
(v
2
) = B.
Definition 6 (Supporting Graph of an Event Graph).
Given an event graph G, its supporting graph G
0
∈
G
w
is the graph which subgraph H is isomorphic to
G i.e. for the mapping φ of vertices between G and
H φ : V (G) → V (H) the following two conditions are
preserved:
1. Any vertices v
1
and v
2
with an edge (v
1
, v
2
) in G
also have an edge (φ(v
1
), φ(v
2
)) in H.
2. The event types of v
1
and v
2
are the same as φ(v
1
)
and φ(v
2
).
Definition 7 (Support and Relative Support of an
Event Graph). For a considered event graph G, the
support of G (sup
w
(G)) is the number of graphs in
G
w
supporting G in world w. The relative support of
G (relSup
w
(G)) is defined as
sup
w
(G)
|G
w
|
, where |G
w
| is
the number of graphs in G
w
.
Let us consider an event graph G = (V =
{v
1
, v
2
}, E = {(v
1
, v
2
)}, lbl = {A, B}, (L(v
1
) =
A, L(v
2
) = B)). Its support for G given in Example 1
is 2 and relative support is 1.
Definition 8 (Expected Support and Relative Ex-
pected Support of an Event Graph). Having generated
M worlds, the expected support of an event graph G
is:
expSup(G) =
M
∑
i=1
P(w
i
) · sup
w
i
(G) (2)
where sup
w
i
(G) is support of G in world w
i
. The rel-
ative expected support of G is defined as:
relExpSup(G) =
M
∑
i=1
P(w
i
) ·
sup
w
i
(G)
|G
w
i
|
(3)
Definition 9 (Problem Definition). Given a dataset
of uncertain instances D, the task is to discover all
event graphs G with relExpSup(G) ≥ minSup. All
such graphs will be referred as frequent event graphs
and denoted by F .
4.1 Algorithm Discovering Frequent
Event Graphs
Algorithm 3 is inspired by the apriori-based strategy
to mine frequent graphs (Jiang et al., 2013). The car-
dinality of the graph is the number of its vertices.
First, the set F
1
is generated from event graphs sets
G
w
1
, G
w
2
, . . . , G
w
M
. Then, iteratively while F
k−1
is not
empty, the following operations are performed:
• A set of candidate event graphs of cardinality k
is generated from F
k−1
by procedure Candidate-
gen(F
k−1
).
• The support of each graph G ∈ C
k
in a world w
i
is calculated as the number of graphs isomorphic
with G in G
w
i
.
• The relative expected support of G is calculated
according to Definition 8.
• G is included in F
k
if its relative expected support
is greater than minSup threshold.
The candidate graphs may be generated accord-
ing to the procedure presented in (Kuramochi and
Karypis, 2004).
5 CONCLUSIONS AND
DISCUSSION
In the paper, we proposed a new framework for dis-
covering patterns from event-based spatio-temporal
data. The proposed framework consists of the follow-
ing steps: data microclustering, generating possible
worlds from uncertain microclusters and creating mi-
croclustering index for each generated world, then for
A Framework for Discovering Frequent Event Graphs from Uncertain Event-based Spatio-temporal Data
661

Algorithm 3: Apriori-based EventGraph Miner.
Input: G
w
1
, G
w
2
, . . . , G
w
M
- sets of event graphs for
worlds 1 . . . M; minSup - minimal relative ex-
pected support threshold.
Output: F
1
, F
2
, . . . , F
k
- sets of frequent event
graphs with cardinality 1 to k.
1: F
1
← sets of frequent event graphs of cardinality
1 detected for G
w
1
, G
w
2
, . . . , G
w
M
.
2: F
2
← sets of frequent event graphs of cardinality
2 detected for G
w
1
, G
w
2
, . . . , G
w
M
.
3: while F
k−1
6=
/
0 do
4: F
k
←
/
0.
5: C
k
← Candidate-gen(F
k−1
).
6: for each G ∈ C
k
do
7: relExpSup(G) ← 0.
8: for each event graphs set G
w
i
do
9: sup
w
i
(G) ← 0.
10: for each H ∈ G
w
i
do
11: if Is-isomorphism(G, H) then
12: sup
w
i
(G) ← sup
w
i
(G) + 1.
13: end if
14: end for
15: relExpSup(G) ← relExpSup(G) +
P(w
i
) ·
sup
w
i
(G)
|G
w
i
|
.
16: end for
17: if relExpSup(G) ≥ minSup then
18: F
k
← F
k
∪ G.
19: end if
20: end for
21: end while
each world based on its microclustering index gener-
ating a set of event graphs and discovering expected
frequent event graphs from given dataset. The sev-
eral points of the proposed framework shall be further
discussed:
• The method for microclustering dataset. We pro-
posed rather simple method for dataset microclus-
tering. The more complex approaches may be to
apply one of the well known density based algo-
rithms (DBSCAN or OPTICS).
• For generating possible worlds and microcluster-
ing set. While the aim of microclustering is to
merge location of uncertain instances and reduce
the number of generated worlds, the number of
generated worlds still may be significant. That can
make the algorithm discovering expected frequent
event graphs infeasible.
In our future work, we will focus on improving
the notions provided in the paper and performing ex-
perimental results showing efficiency and effective-
ness of the proposed algorithms. Some preliminary
experiments performed by us show that the possible
bottleneck of the proposed solution is the number of
generated possible worlds despite performing micro-
clustering step. In such a case, further improvements
of the solution should focus on more efficient gen-
eration of possible worlds and calculating support of
event graphs.
REFERENCES
Aggarwal, C. C. (2009). Managing and Mining Uncertain
Data. Springer Publishing Company, Incorporated.
Aggarwal, C. C., Li, Y., Wang, J., and Wang, J. (2009). Fre-
quent pattern mining with uncertain data. In Proceed-
ings of the 15th ACM SIGKDD International Con-
ference on Knowledge Discovery and Data Mining,
KDD ’09, pages 29–38, New York, NY, USA. ACM.
Bernecker, T., Kriegel, H.-P., Renz, M., Verhein, F., and
Zuefle, A. (2009). Probabilistic frequent itemset min-
ing in uncertain databases. In Proceedings of the 15th
ACM SIGKDD International Conference on Knowl-
edge Discovery and Data Mining, KDD ’09, pages
119–128, New York, NY, USA. ACM.
Chui, C.-K. and Kao, B. (2008). A Decremental Approach
for Mining Frequent Itemsets from Uncertain Data,
pages 64–75. Springer Berlin Heidelberg, Berlin, Hei-
delberg.
Chui, C.-K., Kao, B., and Hung, E. (2007). Mining Fre-
quent Itemsets from Uncertain Data, pages 47–58.
Springer Berlin Heidelberg, Berlin, Heidelberg.
Emrich, T., Kriegel, H. P., Mamoulis, N., Renz, M., and
Zufle, A. (2012). Querying uncertain spatio-temporal
data. In 2012 IEEE 28th International Conference on
Data Engineering, pages 354–365.
Huang, Y., Zhang, L., and Zhang, P. (2008). A framework
for mining sequential patterns from spatio-temporal
event data sets. IEEE Transactions on Knowledge and
Data Engineering, 20(4):433–448.
Jiang, C., Coenen, F., and Zito, M. (2013). A survey of
frequent subgraph mining algorithms. The Knowledge
Engineering Review, 28(1):75–105.
Kuramochi, M. and Karypis, G. (2004). An efficient al-
gorithm for discovering frequent subgraphs. IEEE
Transactions on Knowledge and Data Engineering,
16(9):1038–1051.
Leung, C. K. S. and MacKinnon, R. K. (2014). Fast al-
gorithms for frequent itemset mining from uncertain
data. In 2014 IEEE International Conference on Data
Mining, pages 893–898.
Li, Y., Bailey, J., Kulik, L., and Pei, J. (2013). Mining
probabilistic frequent spatio-temporal sequential pat-
terns with gap constraints from uncertain databases.
In 2013 IEEE 13th International Conference on Data
Mining, pages 448–457.
Li, Z. (2014). Spatiotemporal Pattern Mining: Algorithms
and Applications, pages 283–306. Springer Interna-
tional Publishing, Cham.
Ouyang, Z., Wang, L., and Wu, P. (2017). Spatial co-
location pattern discovery from fuzzy objects. In-
ICPRAM 2019 - 8th International Conference on Pattern Recognition Applications and Methods
662

ternational Journal on Artificial Intelligence Tools,
26(02):1750003.
Wang, L., Han, J., Chen, H., and Lu, J. (2016). Top-k
probabilistic prevalent co-location mining in spatially
uncertain data sets. Frontiers of Computer Science,
10(3):488–503.
Zhang, Q., Li, F., and Yi, K. (2008). Finding frequent items
in probabilistic data. In Proceedings of the 2008 ACM
SIGMOD International Conference on Management
of Data, SIGMOD ’08, pages 819–832, New York,
NY, USA. ACM.
A Framework for Discovering Frequent Event Graphs from Uncertain Event-based Spatio-temporal Data
663
