
Classification of Human Activities Indoors using Microclimate
Sensors and Semiconductor Gas Sensors
Monika Maciejewska, Andrzej Szczurek and Anna Dolega
Wroclaw University of Science and Technology, wyb. Wyspiańskiego 27, 50-370 Wrocław, Poland
Keywords: IAQ, Occupants, Air Monitoring.
Abstract: Nowadays, one of important problems faced by people in developed countries is poor indoor air quality (IAQ).
Factors, which influence air inside buildings should be recognised for planning actions aimed at the
improvement of indoor conditions. Our study was focused on human impact on IAQ. The aim of this work
was the classification of the occurrence of occupants activities, which influence IAQ. The classification was
based on measurements of indoor air using sensors. The presented analysis was focussed on the kind of
sensors that are capable of providing the information which is most relevant for classification. Two groups of
such devices were considered. The first included sensors which are typically used in microclimate
measurements, i.e. temperature, relative humidity and CO
2
concentration sensor. The second group included
semiconductor gas sensors, which are considered as the sources of information about the chemical quality of
indoor air. Classification tree was applied as the classifier. The obtained results showed that the measurement
data provided by both groups of sensors can be applied for the classification of human activities, with the
satisfactory performance. It may be understood that the impact of human activities on indoor air is very broad
and may be examined using versatile sources of measurement data.
1 INTRODUCTION
Over the last 30 years, an increasing number of
complaints about discomfort and health effects
related to indoor air quality (IAQ) have been reported
(Burge at al., 1987; Bohanon et al., 2013; Zhang et
al., 2016). The term IAQ refers to chemical,
biological and physical contamination of air in indoor
spaces. Negative opinions arrive from different
indoor environments, e.g. residential, occupational
and institutional settings. Sometimes, indoor air
quality makes up a greater hazard than outdoor air
pollution (WHO, 2000). In particular, it affects
health, safety, productivity and comfort of occupants
(Al horr et al., 2016). For these reasons, the issue of
IAQ has attracted a great deal of attention recently
(Bluyssen, 2009). The improvement of this situation
requires that a broad range of issues are discussed, for
example the recognition of factors influencing air
inside buildings.
Human environment is a collection of
components that interact with each other to form
some aggregated whole. The close coupling and
interactions between the components of this complex
system cause recognizable collective behaviour
(Szczurek at al., 2015). Hence, IAQ may be seen as
the product of numerous internal and external factors
as well as decentralized and local interactions. It is
affected by meteorological conditions, the interaction
between the building and its surrounding, infiltration,
pollutant sources, building characteristics, operation
and maintenance of the heat, ventilation and air
conditioning (HVAC) system as well as occupancy
(Bluyssen, 2010). The information about these
influences has a fundamental significance for
building managers, policy makers, health
professionals and scientific researchers. It is crucial
for building commissioning, proactive building
management, diagnostics of indoor air quality
complaints and investigation of building energy
consumption.
In this work, we focused on human impact on
IAQ. This influence is a resultant of: occupants
themselves (their presence), their activities, living
patterns, lifestyle (tobacco smoking, use of cleaning
products, cooking etc.), temporal and spatial
characteristics of the given activity, operation
schedule of a building (Szczurek et al., 2018).
A number of strategies are available to provide
information about factors influencing IAQ (Bluyssen,
Maciejewska, M., Szczurek, A. and Dolega, A.
Classification of Human Activities Indoors using Microclimate Sensors and Semiconductor Gas Sensors.
DOI: 10.5220/0007575701210128
In Proceedings of the 8th International Conference on Sensor Networks (SENSORNETS 2019), pages 121-128
ISBN: 978-989-758-355-1
Copyright
c
2019 by SCITEPRESS – Science and Technology Publications, Lda. All rights reserved
121

2011). One of them is based on observations of
individual phenomena, components, features and
parameters describing the indoor air. Unfortunately,
oftentimes the unpredictable character of the
behaviour of air inside a building, the multiplicity of
factors influencing its properties, as well as a lack of
precise relation between air properties and their
original causes make this approach inadequate to
practical applications. Therefore, we decided to
develop another approach using other principles.
The aim of this work was to examine the
possibility of classification of the occurrence of
human activities based on measurements of indoor air
parameters it was assumed that occupants activities
are the factors influencing IAQ. Their influence is
expressed by a local change of the parameters of
indoor air, measured in a very short but a registerable
period of time. The analysis was focussed on the kind
of sensors which are capable of providing the
information that is most relevant for classification.
2 EXPERIMENTAL PART
The experimental data was collected in a flat
occupied by a family of two young parents and their
child. The data was obtained from two sources. These
were: 1. the measurements of the parameters of
indoor air, and 2. the observation of human activities,
which took place in the flat.
The measurements were done using an instrument
equipped with sensors. For the purpose of the analysis
presented in this work, sensors were divided in two
groups. The first group was composed of temperature
(T), relative humidity (RH) and CO
2
concentration
sensors. Commonly referred as microclimate sensors,
they allow to characterize thermal conditions and air
exchange process indoors. Temperature and relative
humidity were measured using humidity and
temperature sensor, model SHT25 (Sensirion). CO
2
concentration was determined using non-dispersive
infrared NDIR sensor, model ELT S300-3V (ELT
Sesnor).
The second group of sensors comprised
semiconductor gas sensors. These partially selective
devices provide chemical information. It refers to the
qualitative and quantitative composition of mixtures
of volatile organic compounds in air. However, the
semiconductor gas sensors are not dedicated to the
selective measurement of any particular component
of air. Contrarily, they are partially selective sensors.
In the study, the following sensors were used:
TGS8100, TGS2600, TGS2602, TGS2603,
TGS2610, TGS2611 and TGS2620. These items are
commercially available products of Figaro
Engineering, Japan (Figaro Inc.).
The sensor device used in our experiments had a
modular construction. Temperature and relative
humidity sensor was mounted in the external probe,
which could be plugged in/out. The second module
included semiconductor gas sensors and CO
2
sensor.
In particular, TGS sensors were mounted in an
aluminium chamber, with temperature stabilisation.
The sensors of the second module were exposed in
dynamic conditions. Namely, the indoor air was
drawn through the instrument by means of a pump
and it was delivered to each sensor individually,
through the dedicated nozzles. Constant gas flow rate
was maintained in the entire measurement period.
The sensor device recorded the measurement data
from all sensors with the same temporal resolution of
1 s.
Figure 1: The layout of the flat. Symbol (1) indicates the
location of the measurement point.
The measurement instrument was located in a small
room, on the desk, as displayed in Figure 1.
The observation of human activities which took
place in the flat consisted in noting down the kind of
activity, as well as times when it occurred and when
it was finished.
Versatile activities of occupants were noticed in
the period when indoor air measurements were done.
They were: weathering by keeping small room
window opened, weathering by keeping living room
window opened, weathering by keeping kitchen
window opened, weathering by keeping small room
door opened, heating by using oil filled electric
radiator, heating by using electric heater with fun
blower, heating by using convector heater, wet
dusting, vacuum cleaning, wet mopping, washing,
doing bed, wall painting, playing with the child,
changing diaper, getting child changed , dressing up
for a walk, child bath, water boiling, cooking, frying,
eating, air-freshening with electrical device, keeping
flat decorated with the Christmas tree, use of
cosmetics, smoker visit in the flat.
The activities of occupants occurred in various
parts of the flat. Some of them were associated with
SENSORNETS 2019 - 8th International Conference on Sensor Networks
122

one particular room, kitchen, bathroom or corridor.
Others were distributed over various parts of the flat.
The monitoring of indoor air as well as the
observation of occupants activities were
accomplished in a continuous manner, within
measurement periods of several hours per day. The
study lasted 14 days, in the period from 5.12.2016 to
08.01.2017. The total data collection time was 63
hours.
3 METHODS
3.1 Measurement Data Pre-processing
The responses of an individual sensor recorded during
continuous measurements had the form of time series.
For the purpose of analysis, the time series associated
with different measurement periods were arranged
jointly in one time series. Data points included in the
collective time series were assigned with their
temporal coordinates indicating data recording time.
The measurement data collected from more than
one sensor formed multivariate time series. In this
work there were considered two multivariate time
series of the measurement data. One of them was
composed of the results of measurements done using
microclimate sensors and the other was composed of
the measurement data obtained from semiconductor
gas sensors.
Regarding observation data, the binary variable,
was used to indicate the occurrence of one
particular activity , 1…, where 26 was
the total number of occupants activities. The value of
variable equal ‘1’ was used to indicate the presence
of the activity and the value equal ‘0’ indicated that
the activity was absent. The realisations of variable
were arranged in time. Their temporal coordinates
and the temporal coordinates of the measurement data
were adjusted, accordingly.
Based on the observation data for the particular
activity, the measurement data was divided into sets
associated with the occurrence of the activity and its
lack. This goal was achieved by the segmentation of
the multivariate time series of the measurement data.
The temporal coordinates of
1 and the temporal
coordinates of
0 were determined for each
,
individually. The multivariate time series of the
measurement data were labelled accordingly. The
segments labelled with ‘1’ were the measurement
data associated with the presence of the activity, .
The segments labelled with ‘0’ constituted the
measurement data associated with the absence of the
activity, .
3.2 Classification
The classification of the occurrence of human
activities indoors was realised by the classification of
the measurement data.
The classification problem was defined as the
problem of separation of the measurement data
associated with the presence of the particular activity
from the measurement data associated with the
absence of this activity. Due to the multivariate
character of the measurement data, there were
considered several feature vectors.
A feature was defined as a response
,
of sensor
, measured at the given time point, . In this work it
was assumed that:
the feature vector consisted of responses of one or
more sensors, associated with the same time point;
there were considered one-element and multi-
element feature vectors;
in one feature vector there were included either
responses of microclimate sensors or the
responses of semiconductor gas sensors.
An individual classification model was dedicated to
the classification of the occurrence of a particular
activity, based on a particular feature vector.
In course of classifier learning,
was used as the
target variable. The input of the classifier was the
measurement data, segmented according to
.
Classier testing, consisted in assigning the label ‘1’ –
presence of the activity or the label ‘0’ – absence of
the activity, to the input data vectors and checking the
correctness of the assignment.
3.3 Classifier
Classification tree was chosen as a tool to solve the
classification problem (Webb, 1999). This is a kind
of tree model where the target variable takes a
discrete set of values. The classification tree has a tree
structure. It starts from the root and it grows with
branches, which lead to leaves through internal nodes.
Internal nodes (non-leaf) are labelled with an input
feature and its values which direct to the subsequent
nodes. Leafs of the tree are labelled with a class or a
probability distribution over the classes.
The tree can be trained in a process called
recursive partitioning. In this process the data set is
divided into parts based on the value of the target
variable. The recursion is completed when the data
subset at a node has all the same value of the target
variable, or when splitting no longer improves the
classification result.
While learning classification tress in this work,
there were not imposed restrictions on their size. The
Classification of Human Activities Indoors using Microclimate Sensors and Semiconductor Gas Sensors
123

grown trees were deep due to large sizes of training
samples.
3.4 Classification Performance
Assessment
The measurement data sets considered in this work
was imbalanced regarding proportions between
classes. Namely, form most activities the number of
measurements associated with the occurrence of
activity (class ‘presence of the activity’) was small as
compared with the number of measurements
associated with the absence of the activity (class
‘absence of the activity’), see Table 2. This fact was
taken into consideration while choosing the
classification performance evaluation approach.
The classification performance was evaluated
using:
the number of false negatives
and the number
of false positives
;
false negative rate,
and false positive rate,
.
False negative was the case when the input data
vector belonged to class ‘1’ – presence of activity and
the classifier assigned it to class ‘0’ – absence of
activity.
False positive was the case when the input data
vector belonged to class ‘0’ – absence of activity and
the classifier assigned it to class ‘1’ – presence of
activity.
The false negative rate,
for the individual
activity, was computed according to the formula:
(1)
where:
was the number of time points when the
particular activity was present,
was the number
of time points when the activity was present and it
was classified as absent. In other words,
was the
number of false negatives.
The false positive rate,
, for the individual
activity, was computed according to the formula:
(2)
where:
was the number of time points when the
particular activity was absent,
was the number of
time points when this activity was absent and it was
classified as present. In other words,
was the
number of false positives.
By applying false negative and false positive rates
one may recognise the percentage of observations
from the particular class which were incorrectly
classified. Additionally, false negatives and false
positives allow to see the actual number of wrongly
classified observations. These two kinds of measure
allow for a comprehensive evaluation of
classification performance when the sizes of classes
are different.
4 RESULTS
Table 1 presents a list occupants activities considered
in this work. For each activity, the percentage of time
was displayed when it occurred in the period of
indoor air monitoring.
As shown in Table 1, the overall time of
occurence of individual activities was mostly short as
compared with the overall time of the their absence.
This shows that for the majority of activities, the class
‘absence of activity’ was overrepresented in the
measuremnt data as compared with the class
‘presence of activity’.
It shall be mentioned that the percentage of time
when the individual activity occurred, shown in Table
1, included situations when several activities ocured
jointly. Such cases were actually most common. The
maximum number of activities observed jointly was
six and usually two, three or four of them were
present together. The only activities which, for some
time, occurred solely were, ‘weathering by keeping
small room window opened’, ‘weathering by keeping
small room door opened’, ‘air-freshening with
electrical device’ and ‘keeping flat decorated with the
Christmas tree’.
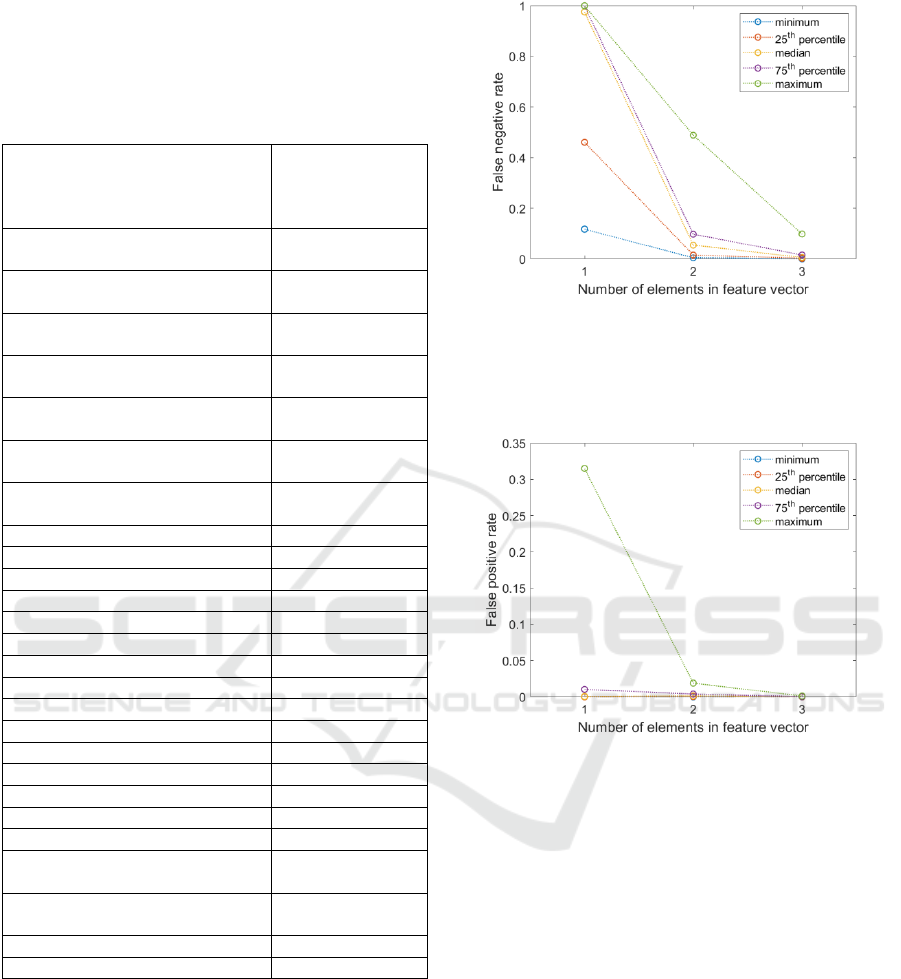
The results shown in figures from Figure 2 to
Figure 5 refer to the classification of human activities
based on responses of microclimate sensors. The
following classification performance measures were
presented: false negative rate (Figure 2), false
positive rate (Figure 3), number of false negatives
(Figure 4) and number of false positives (Figure 5).
The measures were displayed as a function of the size
of the feature vector used in classification. Feature
vectors which had size 1 consisted of the response of
one sensor. It was either T, RH or CO
2
concentration
sensor. Feature vectors which had size 2 consisted or
responses of two sensors. These were either sensors
of T and RH, T and CO
2,
or RH and CO
2
. Feature
vectors which had size 3 consisted or responses of
three sensors, namely T, RH and CO
2
sensor.
For graphical presentation, the results of all
classifications (i.e. for all activities) based on the
feature vector of a particular size were aggregated.
As shown in Figure 2 to Figure 5, the agregate set of
results were characterised using minimum value,
SENSORNETS 2019 - 8th International Conference on Sensor Networks
124
maximum value, 25
th
percentile, 75
th
percentile and
the median.
Table 1: Occupants activities and the percentage of time
when the particular activity occurred in the period of indoor
air monitoring, using sensors.
Occupants activity
The percentage of
time when the
activity occurred
[%]
Weathering by keeping small
room window opened 5.95
Weathering by keeping living
room window opened 2.40
Weathering by keeping
kitchen window opened 3.91
Weathering by keeping small
room door opened 50.03
Heating by using oil filled
electric radiator 37.35
Heating by using electric
heater with fun blower 2.30
Heating by using convector
heater 1.36
Wet dusting 0.43
Vacuum cleaning 0.68
Wet mopping 0.25
Washing 0.03
Doing bed 1.69
Wall painting 4.79
Playing with the child 33.53
Changing diaper 2.09
Getting child changed 2.76
Dressing up for a walk 0.98
Child bath 1.07
Water boiling 5.63
Cooking 6.69
Frying 1.11
Eating 1.48
Air-freshening with electrical
device 29.47
Keeping flat decorated with
the Christmas tree 46.56
Use of cosmetics 1.59
Smoker visit in the flat 7.01
Figure 2: Results of classification, in terms of false negative
rate
, summarized for all activities of occupants. The
classification was based on responses of microclimate
sensors dedicated to the measurement of the following
parameters: T, RH and CO
2
concentration.
Figure 3: Results of classification, in terms of false positive
rate
, summarized for all activities of occupants. The
classification was based on responses of microclimate
sensors dedicated to the measurement of the following
parameters: T, RH and CO
2
concentration.
The results shown in figures from Figure 6 to Figure
9 refer to the classification of human activities based
on responses of semiconductor gas sensors. The
presented performance measures were: false negative
rate (Figure 6), false positive rate (Figure 7), number
of false negatives (Figure 8) and number of false
positives (Figure 9). The measures were displayed as
a function of the size of the feature vector used in
classification. Feature vector which had size 1
consisted of the response of one sensor. It was either
TGS8100, TGS2600, TGS2602, TGS2603,
TGS2610, TGS2611 or TGS2620 sensor. Feature
vector which had size 2 consisted or responses of two
sensors. This condition was fulfilled by any two-
element combination of the individual semiconductor
gas sensors. Feature vector which had size 3 consisted
Classification of Human Activities Indoors using Microclimate Sensors and Semiconductor Gas Sensors
125
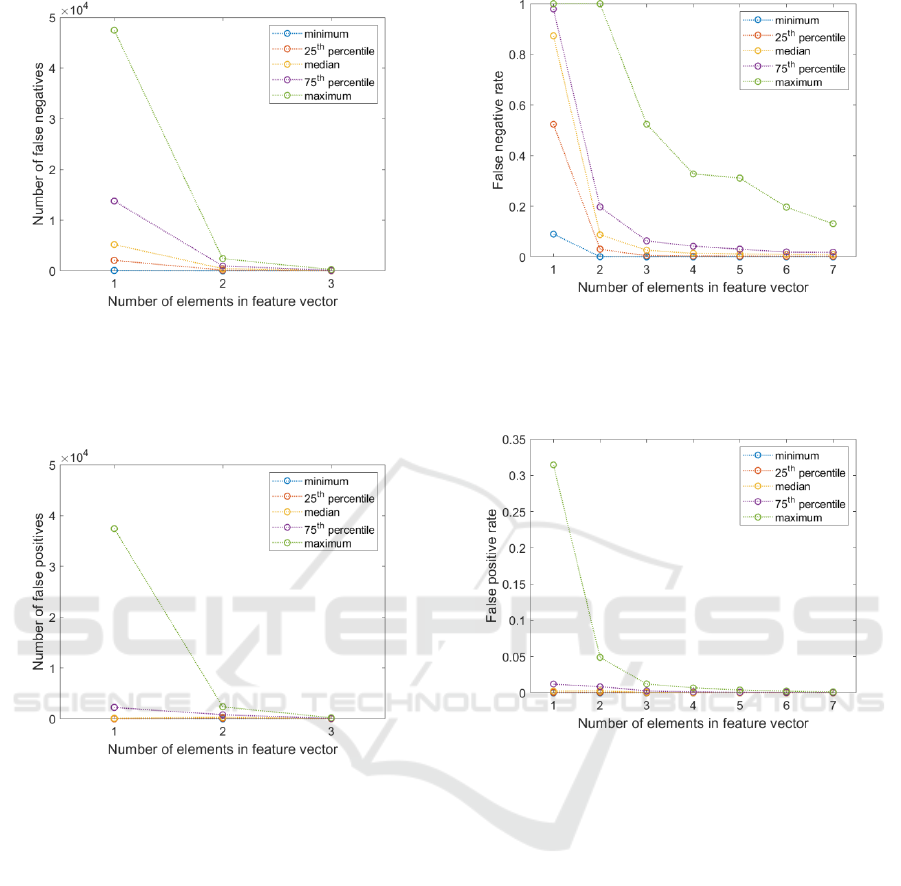
Figure 4: Results of classification, in terms of false
negatives
, summarized for all activities of occupants.
The classification was based on responses of microclimate
sensors dedicated to the measurement of the following
parameters: T, RH and CO
2
concentration.
Figure 5: Results of classification, in terms of false
positives
, summarized for all activities of occupants.
The classification was based on responses of microclimate
sensors dedicated to the measurement of the following
parameters: T, RH and CO
2
concentration.
or responses of three sensors. In this case all three-
element combinations of semiconductor gas sensors
were used. Feature vectors composed of more
elements were built according to the presented rule.
For graphical presentation, the results of all
classifications (i.e. for all activities) based on the
feature vector of a particular size were aggregated. As
shown in Figure 6 to Figure 9, the agregate set of
results were characterised using minimum value,
maximum value, 25
th
percentile, 75
th
percentile and
the median.
Figure 6: Results of classification, in terms of false negative
rate
, summarized for all activities of occupants. The
classification was based on responses of semiconductor gas
sensors: TGS8100, TGS2600, TGS2602, TGS2603,
TGS2610, TGS2611 and TGS2620.
Figure 7: Results of classification, in terms of false positive
rate
, summarized for all activities of occupants. The
classification was based on responses of semiconductor gas
sensors: TGS8100, TGS2600, TGS2602, TGS2603,
TGS2610, TGS2611 and TGS2620.
Based on the comparison of false negative and false
positive rate, as well as the comparison of the
numbers of false negatives and false positives, the
major factor limiting the efficient classification was
the incorrect classification of the actually occurring
activities, as absent. This problem was observed
irrespective of the kind of sensors used as the basis of
classification.
As shown in figures from Figure 2 to Figure 5 the
measurement of a single parameter of microclimate
like temperature, relative humidity or CO
2
concentration, was a limited source of information
about the occurrence of occupants activities indoors.
As shown in Figure 2, for one-element feature vectors
the median of false negative rate was 99%. That
means, in the majority of cases the activity which was
SENSORNETS 2019 - 8th International Conference on Sensor Networks
126
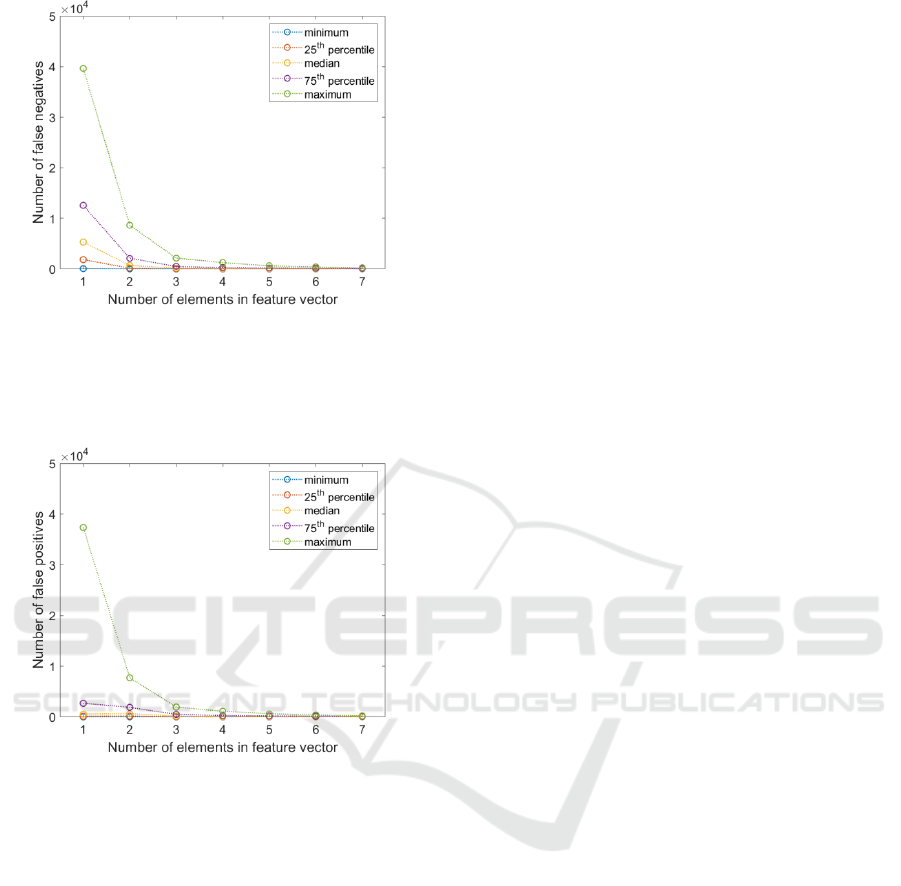
Figure 8: Results of Classification, in Terms of False
Negatives
, Summarized for All Activities of
Occupants. the Classification Was based on Responses of
Semiconductor Gas Sensors: TGS8100, TGS2600,
TGS2602, TGS2603, TGS2610, TGS2611 and TGS2620.
Figure 9: Results of classification, in terms of false
positives
, summarized for all activities of occupants.
The classification was based on responses of semiconductor
gas sensors: TGS8100, TGS2600, TGS2602, TGS2603,
TGS2610, TGS2611 and TGS2620.
present was classified as absent. It should be
mentioned that also the number of false negatives
(Figure 4) was bigger than the number of false
positives (Figure 5), when using individual
microclimate sensors as the basis of classification.
Compared with one-element feature vectors, vast
improvement of classification performance was
achieved when using two-element vectors. In this
case the average false negative rate was less than 10%
(Figure 2). Further decrease of classification error
was attained when using three-element feature vector.
The classification performance was best when the
classification of occupants activates was based on the
responses of T, RH and CO
2
sensors jointly. In this
case the maximum false negative rate was around
10%.
As shown in figures from Figure 6 to Figure 9 the
measurement performed using individual
semiconductor gas sensors did not allow for
classification of occupants activities with a
satisfactorily low error. Based on Figure 6, for one-
element feature vectors the false negative rate was
90%. That means in 90% of cases the activity which
was present was classified as absent. It should be
mentioned that also the number of false negatives
(Figure 8) was bigger than the number of false
positives (Figure 9), when using individual
semiconductor gas sensors as the basis of
classification.
Compared with one-element feature vectors, a
major improvement of classification performance
was achieved when using two-element vectors. In this
case the median of false negative rate was less than
10% (Figure 6). Further decrease of classification
error was attained when using three-, four-, up to
seven-element feature vectors. The smallest numbers
of false negatives and false positives were attained
when using all semiconductor gas sensors as the
sources of data for classification.
5 CONCLUSIONS
The study focussed on the classification of occupants
activities, based on measurements of indoor air, using
sensors. The assumption was made that the
considered activities influenced indoor air quality.
Two groups of sensors were examined. The first
one included temperature, relative humidity and CO
2
concentration sensor. They were the source of
information about microclimate. The second group
comprised semiconductor gas sensors. They were the
source of information about the chemical quality of
indoor air.
The classification problem was defined for
individual activities of occupants. It consisted in
distinguishing between the measurement data
associated with the presence of the activity and the
data associated with the absence of the activity.
Classification tree was applied. The classification
performance was evaluated using: false negative rate,
false positive rate, the number of false positives and
the number of false negatives. They were computed
for the full run of ten folds cross-validation
procedure.
Based on the analysis, the occurrence of
occupants activities was effectively classified using
microclimate sensors as well as with semiconductor
Classification of Human Activities Indoors using Microclimate Sensors and Semiconductor Gas Sensors
127

gas sensors. However, multiple sensors had to be used
jointly for this purpose. The lowest classification
errors were at the level of 1%. They were attained
when using for classification all microclimate sensors
or all semiconductor gas sensors.
The obtained results show that diverse sources of
measurement data may be applied to examine the
impacts of human activities on indoor environment.
In our further work we will concentrate on the
selection of sets of semiconductor gas sensors which
are most useful for the classification of particular
occupants activities. We also consider applying more
rigid testing procedures.
ACKNOWLEDGEMENTS
Designated subsidy for conducting the research or
development work and for realisation of tasks which
support the scientific progress of young scientists and
PhD students. Polish Ministry of Science and Higher
Education, information no 8650/E-366/M/2017.
REFERENCES
Al horr, Y., Arif M., Katafygiotoua M., Mazroeic A.,
Kaushik A., Elsarrag E., 2016. Impact of indoor
environmental quality on occupant well-being and
comfort: A review of the literature, International
Journal of Sustainable Built Environment 5(1), 1–11.
Bluyssen, P.M., Janssen, S., van den Brink, L.H., de
Kluizenaar, Y., 2011. Assessment of wellbeing in an
indoor office environment, Building and Environment
46, 2632–2640.
Bluyssen, P.M., 2010. Towards new methods and ways to
create healthy and comfortable buildings, Building and
Environment 45, 808–818.
Bluyssen, PM., 2009. The Indoor Environment Handbook:
How to make buildings healthy and comfortable.
London, UK: Earthscan.
Bohanon, H.R. Jr, Piadé, J.J., Schorp, M.K., Saint-Jalm, Y.,
2003. An international survey of indoor air quality,
ventilation, and smoking activity in restaurants: a pilot
study, Journal of Exposure Analysis and Environmental
Epidemiology 13, 378–392.
Burge, S, Hedge, A, Wilson, S, Bass, J.H, Robertson, A.,
1987. Sick Building Syndrome: a study of 4373 office
workers. Ann Occup Hyg 31(4A), 493–504.
ELT Sensor. http://www.eltsensor.co.kr/en/portfolio/s-300/
Figaro Inc. www.figarosensor.com/
Horr, Y.A., Arif, M., Kaushik, A., Mazroei, A.,
Katafygiotou, M., Elsarrag, E., 2016. Occupant
productivity and office indoor environment quality: A
review of the literature, Building and Environment 105,
369-389.
Sensirion. http://pdf1.alldatasheet.com/datasheet-
pdf/view/522152/ETC2/SHT25.html
Szczurek, A., Dolega, A., Maciejewska, M., 2018. Profile
of occupant activity impact on indoor air — method of
its determination, Energy and Buildings 158, 1564–
1575.
Szczurek A., Maciejewska M., Teuerle M, Wyłomańska A.,
2015. Method to characterize collective impact of
factors on indor air, Physica A 420, 190–199.
Webb, A., 1999. Statistical pattern recognition. Arnold,
London.
WHO. Guidelines for air quality. World regional
publication European series no.91. 2nd ed. Geneva:
World Health Organization, 2000.
Zhang, N., Kang, Y., Zhong, K., Liu, J., 2016. Indoor
environmental quality of high occupancy dormitory
buildings in winter in Shanghai, China, Indoor and
Built Environment 25(4), 712–722.
SENSORNETS 2019 - 8th International Conference on Sensor Networks
128
