
Panel of Attribute Selection Methods to Rank Features Drastically
Improves Accuracy in Filtering Web-pages Suitable for Education
Vladimir Estivill-Castro
1
, Matteo Lombardi
2
and Alessandro Marani
2
1
Department of TIC, University Popeu Fabra, Barcelona 08018, Spain
2
School of ICT, Griffith University, Nathan Campus, Brisbane 4111, Australia
Keywords: Information Technologies Supporting Teaching and Learning, Content Development, Filtering, Feature
Selection, Purpose vs Topic.
Abstract:
Search engines and recommender system take advantage of user queries, characteristics, preferences or per-
ceived needs for filtering results. In contexts such as education, considering the purpose of a resource is also
fundamental. A document not suitable for learning, although well related to the query, should never be recom-
mended to a student. However, users are currently obliged to spend additional time and effort for matching the
machine-filtered results to their purpose. This paper presents a method for automatically filtering web-pages
according to their educational usefulness. Our ground truth is a dataset where items are web-pages classified
as relevant for education or not. Then, we present a new feature selection method for lowering the number of
attributes of the items. We build a committee of feature selection methods, but do not use it as an ensemble.
A comprehensive evaluation of our approach against current practices in feature selection and feature reduc-
tion demonstrates that our proposal 1) enables state-of-the-art classifiers to perform a significantly faster, yet
very accurate, automatic filtering of educational resources, and 2) such filtering meaningfully considers the
usefulness of the resource for educational tasks.
1 INTRODUCTION
A classifier is an algorithm that exploits attributes
defining a set of items to elicit their characteristics
and commonalities. Typically, the goal of a classi-
fier is to assign a class or “category” to such items,
namely a label that identifies clusters of similar ele-
ments. Categorization by topic of documents is a re-
search problem well-known in Information Retrieval
(IR). The class of a document corresponds to the
topics discussed in the text (Qi and Davison, 2009;
Schonhofen, 2006). A more specific context for such
a challenge is the categorisation of Web documents.
The rapid expansion of the Internet creates an ever-
increasing demand for faster and yet reliable filter-
ing of web-pages, according to the information needs
of users and aiming to eliminate displaying irrelevant
and harmful content. Search engines are now very
helpful to users that seek web-resources on a specific
topic. Such systems perform filtering and ranking of
web-pages considering the user’s query. However, the
same high accuracy is not reached in more challeng-
ing tasks. As an example, search engines like Google
and others struggle in retrieving only resources suit-
able for a particular purpose, like teaching (Lombardi
and Marani, 2015). Consequently, educators must in-
vest additional effort to recognise whether or not a
web-page is suitable for their teaching needs. More-
over, the accuracy of the classification is not the only
difficulty when applying IR techniques on the sheer
volume of documents hosted on the Internet. Access-
ing the most valuable data as quick as possible raises
further research questions about both the trade-off in
accuracy versus the computational time required by
a web-page classifier. Another characteristic of web-
pages is the multitude of traits (features to be used
as independent variables) that may be used for their
description. Not surprisingly, the determination of
which attributes about a web-page are essential and
informative has a massive impact on the velocity of
the classifier. Moreover, across many documents, sev-
eral features may be sparse. Therefore, managing a
broad set of features is not always desired, because it
brings up the issues associated with the curse of di-
mensionality. Well-cited studies from researchers in
IR focus on handling the typically large number of
features of items (Li et al., 2017). Thus, there is a
variety of methods applicable for reducing the feature
48
Estivill-Castro, V., Lombardi, M. and Marani, A.
Panel of Attribute Selection Methods to Rank Features Drastically Improves Accuracy in Filtering Web-pages Suitable for Education.
DOI: 10.5220/0007676300480057
In Proceedings of the 11th International Conference on Computer Supported Education (CSEDU 2019), pages 48-57
ISBN: 978-989-758-367-4
Copyright
c
2019 by SCITEPRESS – Science and Technology Publications, Lda. All rights reserved

space, namely feature-selection and feature-reduction
algorithms. Many of them rank attributes according to
their usefulness in the classification task, for example
analysing the correlation between attributes of the el-
ements, or even the amount of information carried by
a feature. Other methods focus on discovering redun-
dant attributes that can be removed without sacrificing
accuracy. There are also algorithms that combine the
original features and generate a new set of attributes
aiming to improve the accuracy of the categorisation.
However, an incorrect feature selection may compli-
cate even more the performance in real-time classifi-
cation, which has become an essential aspect in many
Web-based applications.
1.1 Contribution
We improve by a significant margin the capability
to identify web-pages as suitable educational mate-
rials. We improve over recent approaches achieving
an accuracy rate of about 80% (Estivill-Castro et al.,
2018), and we reach accuracy rates above 95%. We
accomplish this noticeable improvement by introduc-
ing a new framework for performing Feature Selec-
tion (FS). The previous approach achieved their re-
sult combining several state-of-the-art algorithms into
an ensemble that projected the information info ex-
tremely few attributes. We also achieve feature re-
duction. We also incorporate information from sev-
eral feature reduction algorithms, but instead of an en-
semble, we use each feature-ranking method to rank
and then select the features acceptable to our com-
mittee of feature rankers. Bringing a group of fea-
ture ranking algorithms combines the many different
aspects analysed by each of the algorithms, but we
do not lose information by creating an ensemble, top
features are still passed on to the classification phase.
We utilise heavily the potentially obvious principle
that a feature is relevant if it scores highly in most of
the feature-ranking algorithms. We tested our frame-
work in a filtering task performed on a dataset of more
than 5,600 web-pages labelled as relevant for educa-
tion or not (the data holds ground-truth by human ed-
ucators identifying those web-pages holding learning
objects suitable for education). We compared our pro-
posal on both accuracy and speed against popular al-
gorithms for feature selection and feature reduction.
Our results demonstrate that the proposed methodol-
ogy allows for more accurate and faster classification
of web-pages in several scenarios, outperforming cur-
rent methods and thus achieving a more balanced real-
time performance.
2 LITERATURE REVIEW
Classification of resources on the Web, (i.e. web-
pages), is a fundamental step towards supporting
users’ experience (P. et al., 2010). The Semantic Web
community has produced many popular approaches
for the classification of web-pages by identification
of their topics (Kenekayoro et al., 2014; Zhu et al.,
2016). In particular, the binary classification, or fil-
tering, labels a page relevant for the users’ query
or recognises it is to be avoided (Mohammad et al.,
2014). In this paper, (in a way that enables real-time
filtering), instead of categorisation by topic, we aim
to classify a web-page according to its purpose and in
particular whether it is suitable as educational mate-
rial. Our methods balance both classification reliabil-
ity and processing time. Indeed, several studies report
that performing a fast classification is very likely to
lead to lower precision, aiming to take into account
the balance between precision and velocity (Cano
et al., 2015; Jaderberg et al., 2014; Rastegari et al.,
2016).
Pre-processing data using Feature Selection tech-
niques speeds up machine learning algorithms, with-
out compromising the accuracy of the outcome. There
are two distinct groups of algorithms in this cate-
gory. Methods for Feature Reduction, or Dimension-
ality Reduction, are based on combining the existing
features into a new set of attributes. Principal Com-
ponent Analysis (PCA) (Wold et al., 1987) is one of
the most famous approaches for feature reduction. It
applies orthogonal transformations to the data until
the principal components are found, usually by eigen-
decomposition of the data matrix. In such a case,
the result of PCA is a set of vectors of real num-
bers, called eigenvectors, which are then used as co-
efficients for weighting the original values of the fea-
tures. Each eigenvector produces a new feature, by
multiplying the coefficients of the vector by the ini-
tial set of features. The machine learning software
WEKA suggests (Bouckaert et al., 2010) to use PCA
in conjunction with a Ranker search, leading to di-
mensionality reduction by choosing enough eigenvec-
tors to account for a given percentage of the variance
in the original data, where 95% is the default value.
Methods performing proper Feature Selection se-
lect a subset of the existing attributes according
to different criteria. Recursive Feature Elimination
(RFE) (Granitto et al., 2006) is a Feature Selection
technique electing a subset of the existing attributes
according to their predicted importance for data clas-
sification. RFE exploits an algorithm that constructs
a model of the data. For that purpose, the CARET
package of the statistical software R uses the Ran-
Panel of Attribute Selection Methods to Rank Features Drastically Improves Accuracy in Filtering Web-pages Suitable for Education
49

dom Forest algorithm (Breiman, 2001). RFE executes
the same algorithm for a given number of iterations,
producing a final weight for the attributes. RFE pre-
dicts the accuracy of all the possible subsets of the at-
tributes, until finding the subset that leads to the max-
imum value of accuracy. Then, it retains only those
attributes and removes the other features.
Another pre-process approach is to compute a
ranking of the attributes. Then, feature selection is
performed by retaining only the best-ranked traits.
For instance, the Support Vector Machine (SVM)
ranking algorithm exploits the output of an SVM
classifier (Guyon et al., 2002) to generate a ranking
of the original features, according to the square of
the weight assigned to them by the classifier. Sec-
tion 4 presents other proposals in literature for fea-
ture ranking and feature selection, in particular, en-
sembles are emerging as a popular methodology in
this field (Estivill-Castro et al., 2018; Li et al., 2009;
Saeys et al., 2008).
3 DATA COLLECTION
Previous work in this area used a data set with less
than 450 instances (Estivill-Castro et al., 2018): such
earlier work used teachers who labelled 198 pages as
relevant for teaching, while consider another 244 not
relevant for teaching). We built a much larger datasets
dataset of web-pages also labelled with two classes:
TRUE when a resource has been declared relevant for
teaching some concepts, or FALSE when the page
does not contain educational content. The relevant
web-pages are more than 2,300 web-pages we ex-
tracted from two different sources. The first source is
the Seminarsonly
1
website, which hosts content about
Computer Science, Mechanical, Civic and Electri-
cal Engineering, as well as Chemical and Biomedi-
cal sciences among others. The second source of ed-
ucational material is a subset of web-pages coming
from a survey (Obfuscated, 2018) among instructors
who judged the suitability of a web-page as a poten-
tial learning-object. The judging instructors used a
5-point Likert scale, and we labelled a web-page as
TRUE (“relevant for education”) only when it col-
lected 3 points (relevant) or more (where the maxi-
mum is 5 points —- Strongly relevant), discarding the
others. On the other hand, we obtain the web-pages
classified as FALSE (“non-relevant for education”)
by the crawling of URLs contained into the DMOZ
open directory, currently known as Curlie
2
, resulting
1
http://www.seminarsonly.com/
2
https://curlie.org/
in more than 3,200 web-pages considered as not suit-
able for educational purposes. In total, our dataset
consists of around 5,600 labelled web-pages, accord-
ing to their usability in educational contexts, where
each item in the dataset is described by 53 attributes.
Those traits are coming from natural language anal-
ysis of the textual content of the web-page, also in-
volving semantic approaches such as extracting DB-
pedia
3
entities (Piao and Breslin, 2016; Xiong et al.,
2016). For such a purpose, we included the named
entity recognition tool Dandelion API
4
, as suggested
in the literature (Limongelli et al., 2017).
Scalability: We artificially blew up our dataset to
test the scalability of our method as data increases.
Since we aim for web-based applications, we foresee
that the number of web-pages will continuously grow,
so that the classifier should able to learn from larger
and larger datasets. We name our original dataset as
x1; later versions are built duplicating the items of
the previous version applying a small, random per-
turbation to the values of the attributes. Therefore,
the expanded datasets are called x2, x4, x8, x16 be-
cause they are respectively 2, 4, 8 and 16 times larger
than the original one, with nearly 90,000 items in the
x16 version. We used them as dummy datasets only
for evaluating the speed of our proposed method in a
more realistic Web environment where scalability is
also important. However, their items cannot be used
for analysing the accuracy, because the labels are not
representative of the purpose of the web-pages.
4 METHODOLOGY
We propose a method for filtering web-pages that
may be suitable for use in educational tasks, balancing
the accuracy and speed aiming to be as fit as possible
for real-time applications. We can even increase the
precision of a classification by selecting a subset of
features that can reasonably describe the data, instead
of using all the attributes.
As suggested by others (Estivill-Castro et al.,
2018), we use of HTML tags to divide each web-page
into four parts: i) the Title, ii) the Body, iii) the Links,
and iv) the Highlights, (the Title is extracted from
the title tag and the Body section from the body tag).
Then, inside the Body tag, the text between anchor
< a > tags is concatenated and labelled as the Links,
while Links are extracted from all text between the
tags < h1 >, < h2 >, < h3 >, < b > and < strong >
we obtain the Highlights.
3
http://wiki.dbpedia.org/
4
https://dandelion.eu
CSEDU 2019 - 11th International Conference on Computer Supported Education
50
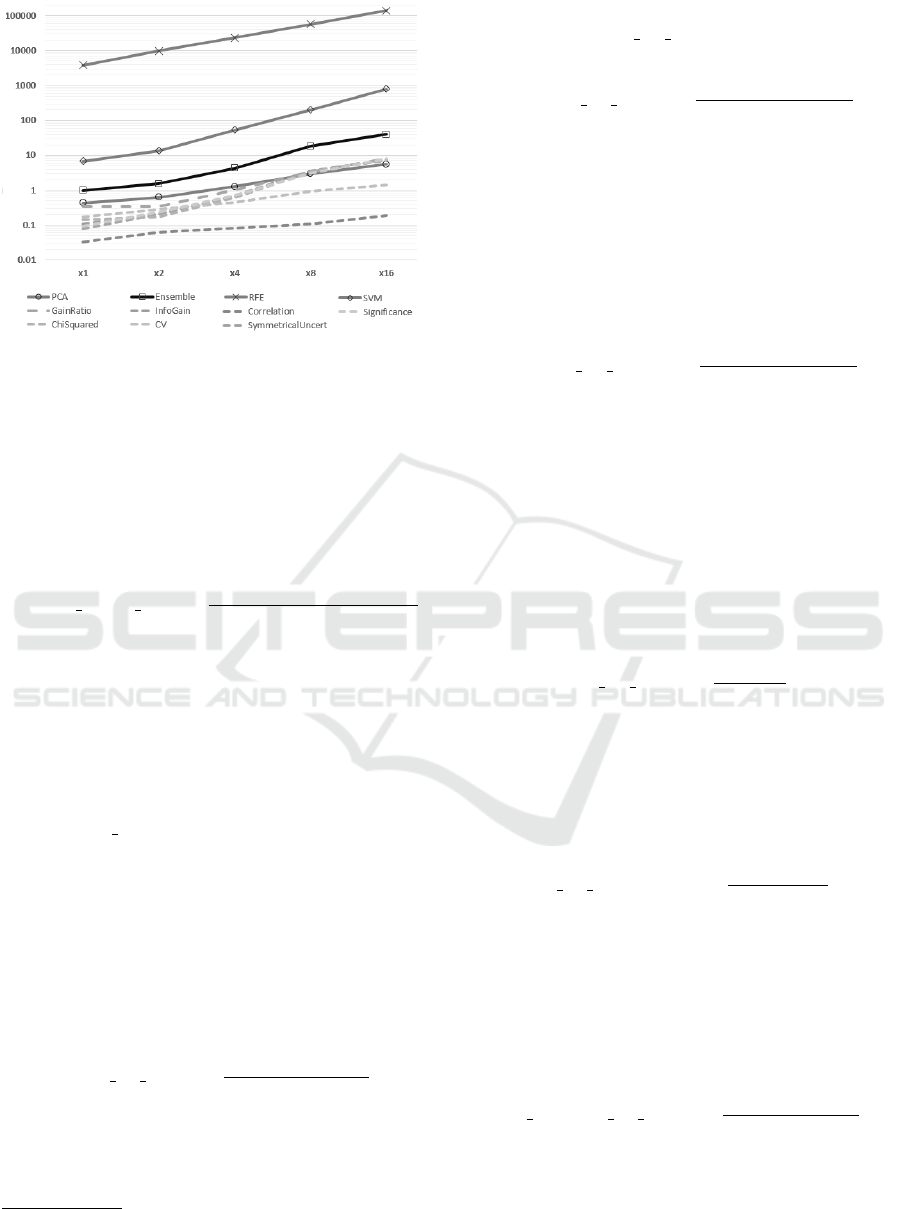
Figure 1: The execution time (sec.) on a logarithmic scale
for the Feature Selection algorithms on the original dataset
(x1) and the dummies (x2 to x16).
Features for each of these 4 sections are as fol-
lows.
Complex-words Ratio: This is the ratio of the
number of complex words on the total number of
words (i.e., the length) in a text:
Complex Words Ratio =
number of complex words
number of words
.
The Fathom API
5
is used for deducing the quantity
of complex words, for instance words composed by
three or more syllables.
Then we extract the following syntactic features,
at four threshold levels for all four section.
Number of Entities:
Number entities = EntityExtraction(text) .
This is the quantity of entities extracted by Dande-
lion from a text, hence, how many semantic “items”
(names, places, concepts, etc...) the author wrote
about in the Web-page.
Entities by Words: It is the number of concept en-
tities extracted from a text, with respect to the total
number of words and computed as follows:
Entities By Words =
number of entities
number of words
.
In other words, this feature gives an insight of how
many words the author has used around an entity and,
from the reader point-of-view, how much it is neces-
sary to read for finding a semantic entity.
5
http://search.cpan.org/dist/Lingua-EN-Fathom/lib/
Lingua/EN/Fathom.pm
Concepts by Words: This value is calculated sim-
ilarly to the Entities By Words, but considering only
the concept entities:
Concepts By Words =
number of concepts
number of words
.
The idea is to measure how many words it is neces-
sary to read for finding a concept; the higher the ratio,
the more focused on concepts is the resource, conse-
quently the more concise is the style of the author.
Number of Concepts by Entities: This feature re-
ports the fraction of entities that are also concepts,
with respect to the total number of entities found in
a text:
Concepts By Entities =
number of concepts
number of entities
.
Similarly to the previous value, such ratio is a pre-
dictor of the conciseness of the author on the main
concepts with respect to the amount of knowledge (of
any kind) delivered by the Web-page.
And also we extract 4 semantic features at four
threshold levels for the 4 sections.
Semantic Density by Number of Words: It mea-
sures how many distinct entities Dandelion extracted
from the text (i.e., the set of discussed topics), with
respect to the number of words:
SD By Words =
|Entities|
# words
.
When two texts have similar quantities of words, the
one with more distinct entities is the denser.
Semantic Density by Reading Time: Similarly to
the previous feature, but measured in relation to the
reading time of the text:
SD By ReadingTime =
|Entities|
reading time
.
In this case, the text is denser when the reading time
is low, and the number of distinct entities (i.e., topics)
is high.
Semantic Density by Number of Words, Concepts
Only: This feature considers only distinct concept
entities, with respect to the number of words:
SD Concepts By Words =
|Concepts|
number of words
.
Concepts are more frequent than other types of enti-
ties in the educational texts of our dataset. Hence, the
concept-based semantic density is expected to hold
significant information for the educational classifica-
tion process.
Panel of Attribute Selection Methods to Rank Features Drastically Improves Accuracy in Filtering Web-pages Suitable for Education
51

Semantic Density by Reading Time, Concepts
Only: It measures the quantity of concepts taught
by a text according to the time needed for reading it:
SD Concepts By ReadingTime =
|Concepts|
reading time
.
As an example, let us consider two texts where Dan-
delion extracted the same amount of distinct concepts.
In that case, the text which requires less reading time
presents concepts in a more condensed way, so it
holds higher semantic density than its counterpart. In
other words, less time is spent for other entities (i.e.,
non-concepts) that are not likely to be used in edu-
cational resources, while important concepts receive
more attention.
Hence, the total number of features is computed
as following:
# potential features = 4 + 8 ∗ 4 ∗ 4 = 132 features .
Some features may be redundant; thus the preci-
sion should not decrease much when discarding them.
As mentioned in Section 2, PCA, RFE and SVM are
among the most popular algorithms for feature selec-
tion and reduction. Another way is to involve sev-
eral feature selection methods in one unique ensemble
and then compute an overall ranking of the features,
as in the Rank Score algorithm (Estivill-Castro et al.,
2018). By involving algorithms focused on different
aspects of the data, it is possible to achieve a more
comprehensive analysis of the feature space than us-
ing only one algorithm. Instead of building en en-
semble (top features are merged into lees, for example
by a linear combination), we use all the features that
receive high scores form several of the feature rank-
ing methods below. These feature ranking methods
have implementations in the WEKA machine learn-
ing suite
6
.
1. Gain Ratio: It measures the worth of an attribute
by the gain ratio concerning the class.
2. Correlation: The Pearson’s correlation between
an attribute and the class is the measure used by
this algorithm.
3. Symmetrical Uncertainty: It computes the im-
portance of a feature by measuring the symmet-
rical uncertainty (Witten et al., 2016) concerning
the class.
4. Information Gain: The worth of an attribute re-
lating to the class is evaluated using the Informa-
tion Gain measure Information Gain(Class, f ) =
H(Class) −H(Class| f ) where f is the feature and
H is the entropy function.
6
http://www.cs.waikato.ac.nz/
∼
ml/weka/
5. Chi-squared: This algorithm considers the chi-
squared statistic of the attribute with respect to the
class as the importance of a feature.
6. Clustering Variation: uses the Variation measure
for computing a ranking of the attributes set, then
the set is split into two groups where the Verifica-
tion method deduces the best cluster (refer to the
WEKA APIs for further information about those
algorithms).
7. Significance: It uses the Probabilistic Signifi-
cance to evaluate the importance of a feature (Ah-
mad and Dey, 2005).
The implementation we use for performing the
feature-selection algorithms is the one provided by
the WEKA Java APIs, where the search method is
Ranker and all the parameters are set to their default
values. For running RFE, we used the R 3.4.1 statis-
tical software suite
7
.
Time Analysis: Figure 1 shows the computation time
for the algorithms mentioned above, on a logarithmic
scale. RFE is dramatically slower for all the datasets
(two to four orders of magnitude) than the other meth-
ods, therefore it is not suitable for real-time applica-
tions. SVM is generally one order slower than both
PCA and our Panel-based proposal (the panel com-
putes the 7 feature ranking methods, each voting for
each feature in proportion to how high the rank the
feature). Our Panel requires the same computation
than the Ensemble proposed in earlier work (Estivill-
Castro et al., 2018). PCA is faster than the Panel
throughout the datasets, however, the time needed by
the Panel is the sum of seven other methods (repre-
sented in a dotted fashion in Figure 1). Each of those
is either faster or similar in speed to PCA. Hence, we
expect that the Panel method may fill such velocity
gap if we incorporate further refinements, for exam-
ple, its singular methods can be executed in parallel.
However, that is beyond the goal of this paper.
Resulting Sets of Features: Considering the time
needed for the attribute selection phase across the dif-
ferent versions of the dataset, we conclude that SVM,
PCA and our seven-way Panel yield similar speed per-
formance in pre-processing for classification. About
scalability, the algorithms maintain the same trend as
the number of items increase. On our original dataset
x1, PCA selected 14 principal components, namely
linear combinations of the original features. How-
ever, SVM produced a ranking of the attributes and
not a selection that excludes some. So, for a fair com-
parison, we chose to retain only the top-10 attributes
for SVM.
To standardise our notation, given a feature selec-
7
https://www.r-project.org/
CSEDU 2019 - 11th International Conference on Computer Supported Education
52

tion method m, we define the ranking of a feature x
by m as: Rank Score(x, m) = |F| − Position
m
(x) + 1
where |F| is the cardinality of the feature set (i.e., the
number of features). In order to avoid a Rank Score
of 0 for the least relevant feature, we add 1 at the
end of the Rank Score function. Therefore, the most
relevant feature according to m receives the highest
Rank Score, which is equal to the number of fea-
tures involved. Therefore, we selected only the fea-
tures above 80% of the Rank Score (360 points in this
study, so the threshold is set around 290 points), re-
sulting in ten features:
1. Concepts By Words Links 0.6
2. Concepts By Words Links 0.7
3. Concepts By Entities Body 0.6
4. Concepts By Entities Body 0.7
5. Concepts By Entities Body 0.8
6. Concepts By Entities Links 0.7
7. SD Concepts By Words Links 0.6
8. SD Concepts By Words Links 0.7
9. SD Concepts By ReadingTime Links 0.8
10. SD By Words Links 0.6
From now on, we refer to the two baseline attribute
sets as PCA and Top-10 SVM, and to the proposed set
of 10 features as Top10-Rank Score.
5 EVALUATION
We are interested in identifying the methods where
the classification can be performed in a short time to
be applicable for real-time purposes. The previous
section reported the execution time of the feature se-
lection methods on an incremental number of items,
from around 5,600 to nearly 90,000. PCA ranked as
the fastest algorithm. However, a swift decision on
which attributes to take into account may not lead to
obtaining the best accuracy when utilised for classifi-
cation purposes. Moreover, the feature selection pro-
cess must be performed before the filtering activity,
because the latter needs to use the results coming from
the former task. In other words, the attribute selection
could be considered as the “learning” task. There-
fore, we cannot judge the best combination only tak-
ing into account the time for feature selection, so we
performed a comparison of the performance in filter-
ing the items in our datasets, measuring their accuracy
and velocity (where the final cost includes the time for
building the model).
Classifiers: For a comprehensive evaluation across all
types of machine-learning algorithms for classifica-
tion, we used four popular state-of-the-art classifiers:
Bayesian Network (Cooper and Herskovits, 1992) as
Bayesian classifier, the Rule - based algorithm De-
cision Table (Kohavi, 1995), Logistic (Le Cessie
and Van Houwelingen, 1992) as Function - based
method and the Tree - based classifier RandomFor-
est (Breiman, 2001). Their implementations and
parameters are provided by WEKA for all classifi-
cation methods and the feature selection algorithms
PCA and SVM, using the WEKA 8.3.2 Java library
with default parameters. The entire evaluation is per-
formed on a Windows 10 machine, with Intel i7-6700
8-core processor @ 3.4GHz and 32GB of RAM.
Evaluation Measures: We recorded the performance
of the classifiers on a 30-fold Cross Validation accord-
ing to their Average Precision (AP):
Precision( f ) =
# correctly classified items
# items
,
AP =
∑
f ∈ f olds
Precision( f )
# folds
,
where f is the i-th fold, and # folds are 30 in this
study. We present our results as percentage values
when running the classifiers on the original dataset;
the wider versions are dummies and must be used
only for time analysis. We estimate the balance be-
tween accuracy and time for a given classifier us-
ing the BalanceRatio(Estivill-Castro et al., 2018),
namely the ratio of AP and the average execution time
in seconds across the 30 folds AT, using only the x1
dataset:
AT =
∑
f ∈ f olds
ExecutionTime( f )
# folds
, BalanceRatio =
AP
AT
.
6 RESULTS
We evaluate the merit of the three feature-selection
approaches using our dataset and estimating the bal-
ance between precision and speed, across different
classification methods. As a baseline, we consider
the entire feature set (AllFeatures) prior to perform-
ing any attribute selection. We first evaluated the ac-
curacy in the binary classification task on the orig-
inal dataset of 5,600 web-pages, labelled as TRUE
when relevant for education, FALSE otherwise. Fig-
ure 2 shows the AP measure obtained using the
Top10-Rank Score set, while the others are reported
in a heat-map for a meaningful visual comparison,
where the darker the square, the better is the perfor-
mance using Rank Score. Negative values mean that
Rank Score is less accurate than the compared fea-
ture set. Not surprisingly, the AllFeatures set yields
the highest accuracy. However, the discrepancy in
accuracy with Top10-Rank Score is never more than
1.04% (this happens for the Logistic algorithm). PCA
Panel of Attribute Selection Methods to Rank Features Drastically Improves Accuracy in Filtering Web-pages Suitable for Education
53
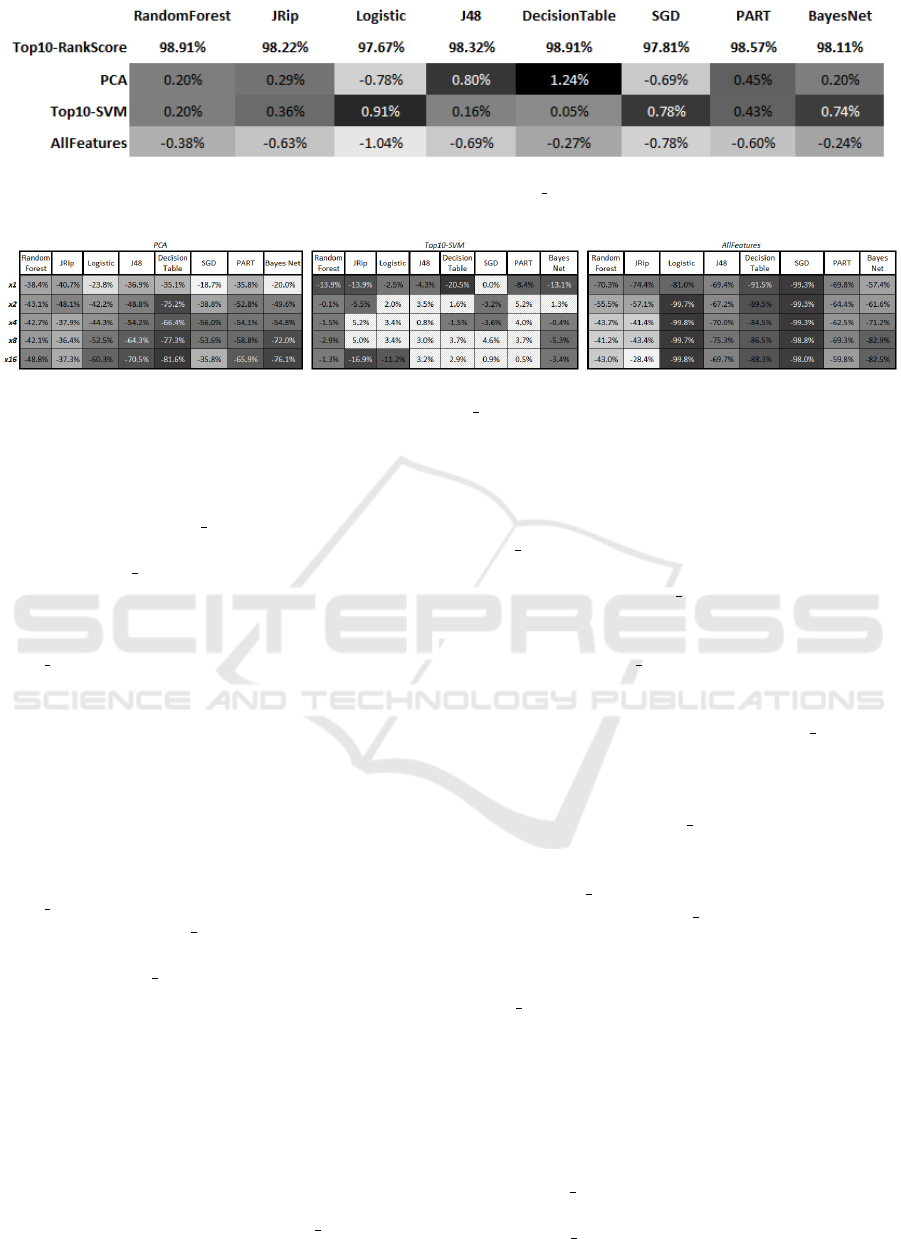
Figure 2: Comparison of the AP measure obtained using the Top10-Rank Score feature set, against PCA, Top10-SVM and
AllFeatures throughout all the classifiers.
Figure 3: The heat-maps of time performance for the eight classifiers when leveraging the PCA, Top10-SVM and AllFeatures
sets, respectively. Percentages are in comparison to Top10-Rank Score. Positive values mean that the compared method is
quicker.
is in some cases more precise (see Logistic and SGD
in the same figure) but running the DecisionTable
method the Top10-Rank Score allows it to perform
1.24% more accurate on the average. When compar-
ing Top10-Rank Score against Top10-SVM, the heat-
map shows that all algorithms obtained higher pre-
cision using the former instead of the latter. There-
fore, we can conclude that when exploiting the Top10-
Rank Score feature set, the AP is closer to the bench-
mark that includes all the features. Moreover, it dis-
plays a superior AP than the one registered with PCA
or with Top10-SVM.
Turning to running speed, we recall that we run
the algorithms on the original x1 dataset, but also us-
ing the dummies x2, x4, x8 and x16 for analysing
the scalability of our approach. All the results
are grouped in an overall heat-map (see Figure 3),
where the values are in comparison with the Top10-
Rank Score set of features. Again, the darker the
square, the better Rank Score performs. Conversely,
negative values indicate a lower AT required by clas-
sifiers using Rank Score, meaning faster execution.
Feature selection techniques are expected to speed-up
the filtering task; all the classifiers fulfilled that ex-
pectation, thus, we can claim that the AllFeatures set
obtains the highest accuracy and the worst execution
time. Hence, a pre-processing that merely includes
AllFeatures is not meeting our speed needs, and at-
tribute selection should lead to better results.
RandomForest: Figure 4 shows the time performance
of the tree-based algorithm RandomForest, with a
zoom on the results on the original x1 dataset. In this
case, the filtering based on Top10-Rank Score traits is
significantly faster than other methods: 14% quicker
than Top10-SVM, while 40% and 70% faster than
PCA and AllFeatures respectively. When running
on the dummy datasets, performances with Top10-
Rank Score and Top10-SVM sets are similar, while
the trend for PCA increases until over 48%. About
AllFeatures, Top10-Rank Score is still 43% quicker.
Therefore, running PCA is not the best choice when
filtering web-pages using RandomForest. Our result
suggest to use Rank Score, with SVM as an alterna-
tive.
DecisionTable: Also in this case (Figure 5), there
is a consistent gap between Top10-Rank Score and
the other sets in the x1 dataset. Indeed, it is 20%
faster than Top10-SVM and 31% in comparison with
PCA. Compared to using no feature selection at all,
filtering with Top10-Rank Score is more than 90%
quicker. The speed recorded using the dummies in-
dicates feature selection with SVM is able to catch
up with Rank Score till becoming 3% faster (in the
x16 dataset). Top10-Rank Score is also more than
80% faster than PCA and the whole feature set on the
biggest dataset.
Logistic: When filtering using Logistic (Figure 6),
Rank Score is still the most convenient choice rather
than using either AllFeatures or PCA. Their gap starts
at 23% and 81% on the original dataset, growing until
60% and 99.8% respectively when taking the dum-
mies into account. When testing versus Top10-SVM
on x1 and x16, our method is 2.5% and 11.2% quicker
respectively.
Bayes Network: In Figure 7) we observe that using
either Rank Score or SVM the AT value is nearly
the same on high volumes of web-pages. However,
Top10-Rank Score starts as 13% quicker, and it ends
CSEDU 2019 - 11th International Conference on Computer Supported Education
54
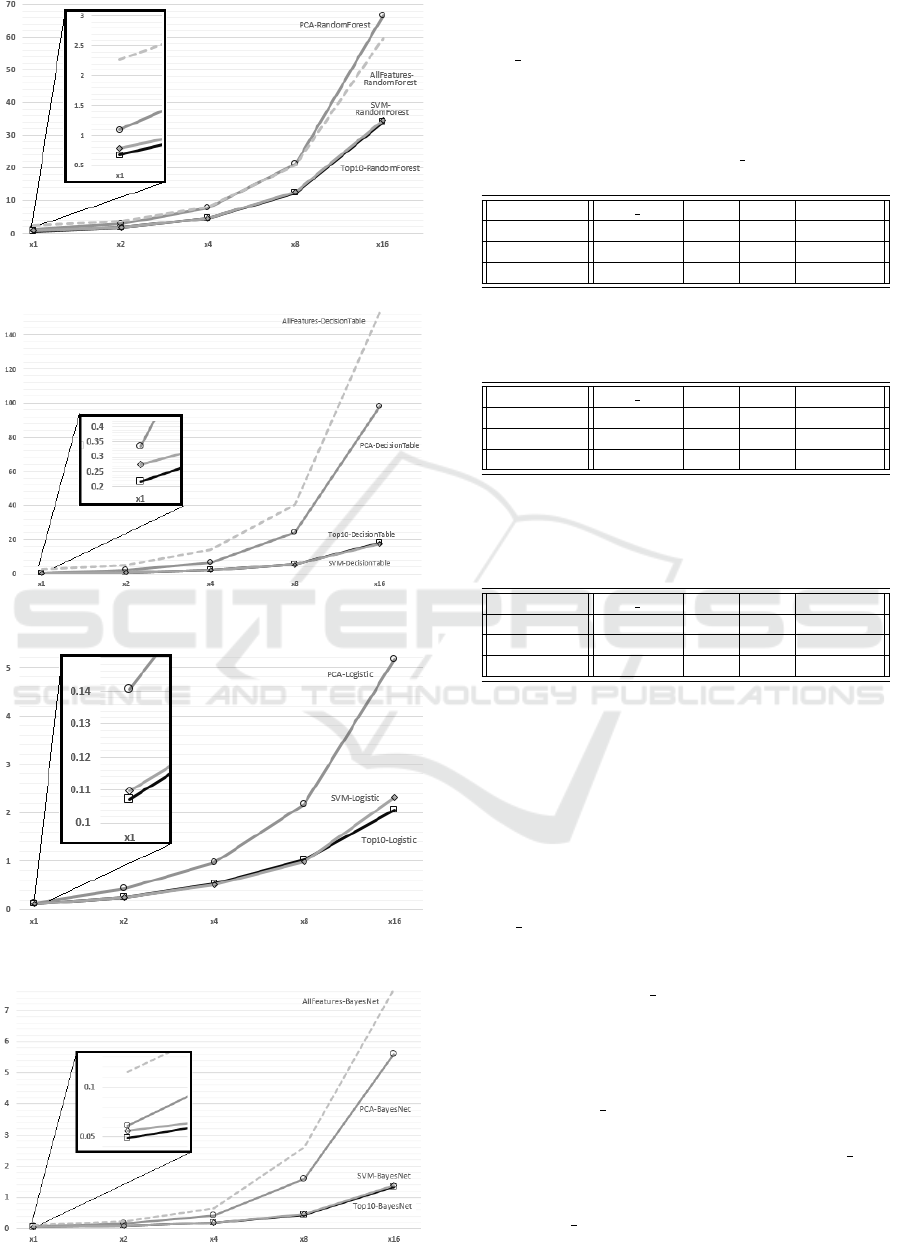
Figure 4: Scalability (time in sec.) by Random Forest clas-
sifier.
Figure 5: Scalability by Decision Table on the four feature
sets.
Figure 6: Scalability by Logistic on three sets only: AllFea-
tures is not competitive.
Figure 7: Scalability by Bayes Network on all four feature
sets.
up being still around 3% faster than Top10-SVM.
When considering PCA or AllFeatures, again, Top10-
Rank Score is undoubtedly the best option with a
speed gain from 20% to 76% against the former, and
up to 82% compared to the latter.
Table 1: AP, AT and BalanceRatio for the Random For-
est classifier on the x1 dataset. Rank Score allows the best
balance. Best outcomes are labelled by “*”.
Measure Rank Score PCA SVM AllFeatures
AT 0.675 * 1.096 0.784 2.274
AP 0.989 0.987 0.987 0.993 *
BalanceRatio 1.465 * 0.901 1.259 0.437
Table 2: Decision Table shows a BalanceRatio higher than
Random Forest, suggesting this algorithm is more suitable
for our filtering task.
Measure Rank Score PCA SVM AllFeatures
AT 0.218 * 0.336 0.274 2.565
AP 0.989 0.977 0.989 0.992 *
BalanceRatio 4.540 * 2.908 3.606 0.387
Table 3: Comparison of the Logistic classifier: the AT is
less than half with respect to Decision Table. Although
accuracy is lower in some cases, the BalanceRatio shows
twice improvement.
Measure Rank Score PCA SVM AllFeatures
AT 0.107 * 0.141 0.110 0.565
AP 0.977 0.984 0.968 0.987 *
BalanceRatio 9.116 * 7.004 8.808 1.746
Balance Analysis: The overall goal of our eval-
uation is to declare which feature selection method
enables the best balance for filtering educational web-
pages. To sum up our findings, we measure the bal-
ance between precision and speed using the previ-
ously presented BalanceRatio when performing the
filtering task on the x1 dataset. Table 1 shows the
AP, AT and BalanceRatio values for the Random
Forest algorithm. As reported, the method based on
Rank Score is the most balanced, despite the fact that
AllFeatures allows for slightly more precise filtering.
However, the impressive speed of the classifier when
using the Top10-Rank Score makes this combination
the most balanced to be used with Random Forest.
The BalanceRatio for the classifier Decision Table is
reported in Table 2. As well as in the previous case,
the most balanced filtering is the one performed using
the Top10-Rank Score. We noticed a sharp increment
compared to the balance measured in Random Forest,
from 1.465 to 4.540 always referring to Rank Score
and similar figures for PCA and SVM. Also Logis-
tic benefits of the most balanced outcome using the
Top10-Rank Score, even if PCA permits a higher ac-
curacy. On the other hand, SVM is only 2.5% slower
Panel of Attribute Selection Methods to Rank Features Drastically Improves Accuracy in Filtering Web-pages Suitable for Education
55
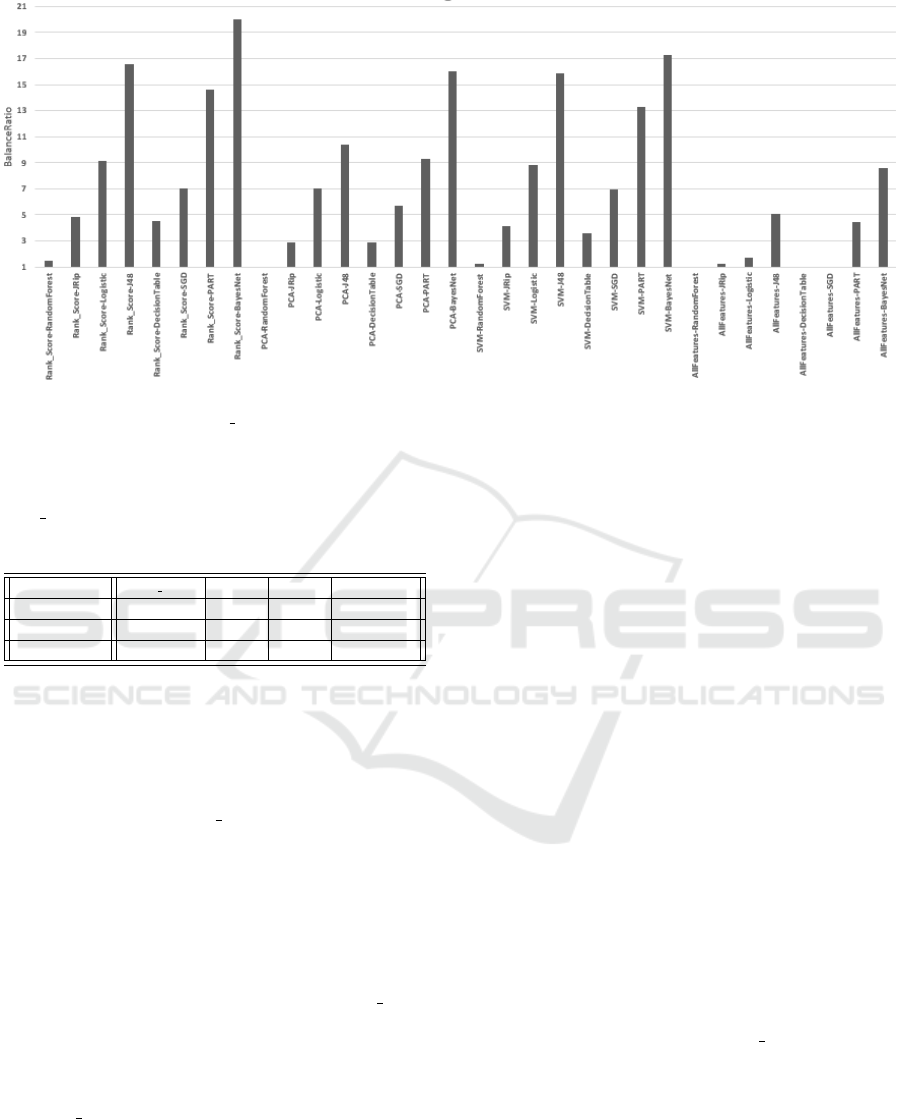
Figure 8: The BalanceRatio reported by all the combinations of features sets and classifiers in our examination (the higher
the value, the better). The Rank Score-BayesNet is the most balanced combination.
Table 4: BayesNet is the algorithm that, combined with
Rank Score features, achieves the highest BalanceRatio;
thus, this is our recommendation for filtering educational
web-pages in real-time.
Measure Rank Score PCA SVM AllFeatures
AT 0.049 * 0.061 0.056 0.115
AP 0.981 0.979 0.974 0.983 *
BalanceRatio 20.050 * 16.017 17.286 8.557
(3 msec.), but the lower accuracy does not allow the
classifier to achieve the best possible balance. The
BalanceRatio is more than double the value reported
for Decision Table for all the attribute sets, includ-
ing when considering AllFeatures. When running the
BayesNet classifier, Rank Score is still the method
that allows the best-balanced performance. Indeed,
the same algorithm executed with PCA and SVM is
just 12 and 7 msec. slower respectively. The result
is even more critical when compared with the Logis-
tic algorithm since the execution time for a 30-fold
cross validation on the x1 dataset with BayesNet re-
quires just half of the time. Then, the higher accu-
racy of BayesNet with input from Top10-Rank Score
makes this combination impossible to be overtaken
by any of the others. Such result is evident in Fig-
ure 8, which shows the BalanceRatio for all the pairs
of a feature selection method and a classifier. All in
all, Rank Score is the approach that permits the most
balanced filtering performance across all the classifi-
cation algorithms.
7 CONCLUSIONS
We presented a method for filtering web-pages ac-
cording to their suitability for education, focused on
balancing the precision and velocity aiming to be ef-
fective in real-time applications. Our accuracy is
above 95% for all classifier methods (see results for
AP with 30-fold cross validation, which give statisti-
cal significance that the accuracy is above 90%). In-
deed, classification of documents on the Web is re-
quired to be both fast and accurate, and is more chal-
lenging if we aim for purpose rather than topic. This
is crucial for education, because an application such
as a recommender system should consider purpose
and not just topic. Furthermore, in a Web-based en-
vironment, filtering techniques must be precise, effi-
cient and scalable. For achieving our goal of balanc-
ing accuracy and velocity, we investigated whether
or not feature selection methods can help to speed
up classifiers when applied on a series of datasets
(see Section 3). We tested the algorithms Recursive
Feature Elimination (RFE) and Principal Component
Analysis (PCA), Support Vector Machine (SVM) and
we proposed a panel based on Rank Score. The latter
exploits the principles of ensembles of feature selec-
tion methods but instead we used as a panel of algo-
rithms. Using a panel seven of feature ranking algo-
rithms (offered by the WEKA machine learning APIs)
we obtain 10 features we can evaluate by accuracy
and speed when used as input to four state-of-the-art
classifiers. For deducing whether or not feature se-
lection is beneficial, we also included the original at-
tribute set in our comparison set up as a 30-fold cross
CSEDU 2019 - 11th International Conference on Computer Supported Education
56

validation on five sets of data of incremental size.
Results show that our methodology allows filtering
methods to achieve an average precision very close to
using all features and higher than SVM. In particular,
our methodology permits to obtain and also surpass
90% accuracy. Such remarkable result in accuracy is
paired with a dramatic reduction of the classification
time when comparing against PCA.
REFERENCES
Ahmad, A. and Dey, L. (2005). A feature selection tech-
nique for classificatory analysis. Pattern Recognition
Letters, 26(1):43–56.
Bouckaert, R. R., Frank, E., Hall, M., Kirkby, R., Reute-
mann, P., Seewald, A., and Scuse, D. (2010). WEKA
Manual for Version 3-6-2. The University of Waikato.
Breiman, L. (2001). Random forests. Machine learning,
45(1):5–32.
Cano, A., Zafra, A., and Ventura, S. (2015). Speeding up
multiple instance learning classification rules on gpus.
Knowledge and Information Systems, 44(1):127–145.
Cooper, G. F. and Herskovits, E. (1992). A bayesian method
for the induction of probabilistic networks from data.
Machine learning, 9(4):309–347.
Estivill-Castro, V., Lombardi, M., and Marani, A. (2018).
Improving binary classification of web pages using
an ensemble of feature selection algorithms. Aus-
tralasian Computer Science Week Multiconference,
page 17. ACM.
Granitto, P. M., Furlanello, C., Biasioli, F., and Gasperi,
F. (2006). Recursive feature elimination with ran-
dom forest for ptr-ms analysis of agroindustrial prod-
ucts. Chemometrics and Intelligent Laboratory Sys-
tems, 83(2):83–90.
Guyon, I., Weston, J., Barnhill, S., and Vapnik, V. (2002).
Gene selection for cancer classification using support
vector machines. Machine learning, 46(1):389–422.
Jaderberg, M., Vedaldi, A., and Zisserman, A. (2014).
Speeding up convolutional neural networks with low
rank expansions. British Machine Vision Conference.
BMVA Press.
Kenekayoro, P., Buckley, K., and Thelwall, M. (2014). Au-
tomatic classification of academic web page types.
Scientometrics, 101(2):1015–1026.
Kohavi, R. (1995). The power of decision tables. Machine
learning: ECML-95, pages 174–189.
Le Cessie, S. and Van Houwelingen, J. C. (1992). Ridge
estimators in logistic regression. Applied statistics,
pages 191–201.
Li, J., Cheng, K., Wang, S., Morstatter, F., Trevino, R. P.,
Tang, J., and Liu, H. (2017). Feature selection: A data
perspective. ACM Comput. Surv., 50(6):94:1–94:45.
Li, Y., Hsu, D. F., and Chung, S. M. (2009). Combin-
ing multiple feature selection methods for text cate-
gorization by using rank-score characteristics. 21st
Int. Conf. Tools with Artificial Intelligence, ICTAI’09,
pages 508–517. IEEE.
Limongelli, C., Lombardi, M., Marani, A., and Taibi, D.
(2017). Enrichment of the dataset of joint educational
entities with the web of data. IEEE 17th Int. Conf. Ad-
vanced Learning Technologies (ICALT), pages 528–
529. IEEE.
Lombardi, M. and Marani, A. (2015). A comparative frame-
work to evaluate recommender systems in technology
enhanced learning: a case study. Advances in Artifi-
cial Intelligence and Its Applications, pages 155–170.
Springer.
Mohammad, R. M., Thabtah, F., and McCluskey, L. (2014).
Predicting phishing websites based on self-structuring
neural network. Neural Computing and Applications,
25(2):443–458.
Obfuscated (2018). Reference obfuscated to block infer-
ences of authors. PhD thesis.
P., K., Stantic, B., and Sattar, A. (2010). Building a dynamic
classifier for large text data collections. Database
Technologies 21st Australasian Database Conference
(ADC 2010), v. 104 CRPIT, pages 113–122. Aus-
tralian Computer Society.
Piao, G. and Breslin, J. G. (2016). User modeling on twit-
ter with wordnet synsets and dbpedia concepts for
personalized recommendations. 25th ACM Int. Conf.
on Information and Knowledge Management, pages
2057–2060.
Qi, X. and Davison, B. D. (2009). Web page classifica-
tion: Features and algorithms. ACM Comput. Surv.,
41(2):12:1–12:31.
Rastegari, M., Ordonez, V., Redmon, J., and Farhadi, A.
(2016). Xnor-net: Imagenet classification using bi-
nary convolutional neural networks. European Con-
ference on Computer Vision, pages 525–542. Springer.
Saeys, Y., Abeel, T., and Van de Peer, Y. (2008). Robust fea-
ture selection using ensemble feature selection tech-
niques. Machine learning and knowledge discovery
in databases, pages 313–325.
Schonhofen, P. (2006). Identifying document topics using
the wikipedia category network. IEEE/WIC/ACM Int.
Conf. on Web Intelligence, WI ’06, pages 456–462,
Washington, USA. IEEE Computer Society.
Witten, I. H., Frank, E., Hall, M. A., and Pal, C. J. (2016).
Data Mining: Practical machine learning tools and
techniques. Morgan Kaufmann.
Wold, S., Esbensen, K., and Geladi, P. (1987). Principal
component analysis. Chemometrics and intelligent
laboratory systems, 2(1-3):37–52.
Xiong, C., Liu, Z., Callan, J., and Hovy, E. (2016).
Jointsem: Combining ery entity linking and entity
based document ranking.
Zhu, J., Xie, Q., Yu, S.-I., and Wong, W. H. (2016). Exploit-
ing link structure for web page genre identification.
Data Mining and Knowledge Discovery, 30(3):550–
575.
Panel of Attribute Selection Methods to Rank Features Drastically Improves Accuracy in Filtering Web-pages Suitable for Education
57
