
Safety-related Studies on Non-Invasive Biomedical Signals and
Its Aptness Usage in Design of Fault Tolerant Multimodal Human
Health Monitoring System
L. V. R. Prasada Raju
1
, Madhubabu Anumukonda
1
and Shubhajit Roy Chowdhury
2
1
Center of VLSI and Embedded Systems Technologies, International Institute of Information Technology, Hyderabad, India
2
School of Computing and Electrical Engineering, Indian Institute of Technology (IIT), Mandi, India
1 RESEARCH PROBLEM
Biomedical Signals monitoring and diagnosis need
to be properly checked to avoid improper
medication. The parameters measured by the human
health monitoring systems(HHMS), specifically like
cardiac health monitoring systems (CHMS) that
measures, heart rate (HR), blood pressure (BP) and
other related vital parameters need to be effectively
diagnosed for illness and disease symptoms, to do
proper nursing.
The patient’s pre- and post-operation health
monitoring & diagnosis are particularly important
for effective nursing. These diagnostic systems
should present uninterruptedly the authentic health
monitoring vital, non-vital and desired parameters
even if any disturbances occur during critical
monitoring periods for a patient. In real time, the
systems should uninterruptedly present, authentic
vital health monitoring measurements. This involves
certain challenges like systemic failures and random
failures. These critical systems are known to
continuously replenish, but the mechanisms
involved are not adequate and largely unknown to
mitigate these failures.
Our main research problem is to address these
challenges and to improve in fault identification and
analysis mechanisms such that, the system should
uninterruptedly present, authentic vital health
monitoring measurements towards improvement in
accurate predictability of the illness with
pathological completeness. For this we preferred to
investigate these human health monitoring systems
(HHMS) by using safety related design architectures
and generation next technologies to counteract such
failures. This uses in design and development of
with or with-out redundancy approaches, run time
monitoring and implementing fault diagnostic
algorithms in designing fault tolerant systems.
The present available medical systems
specifically like non-invasive HHMS and related
point of care (POC) medical systems, using for
diagnosis, may not be having embedded with
approaches like redundancy, fault tolerant
mechanisms. This is due to various reasons like cost,
technological factors. However, if the mentioned
failures are effectively mitigated by applying these
mentioned approaches into this system, it improves
in authentic health monitoring and diagnosis of the
symptoms. Further, applying correlation techniques
on diagnostic data will provide relevant new insights
towards pathological completeness on identification
of the illness.
This design implementations and its safety
related correlation of data study is expected to
significantly improve our understanding on fault
tolerant diagnosis of the illness and may open a new
avenue in sensor fusion technologies advancements.
2 OUTLINE OF OBJECTIVES
This doctoral research project applies and evaluates
the safety-related design architectures usage in
specific cardiac health monitoring systems (CHMS),
or in a general safety critical patient monitoring
systems (PMS) and a low cost POC medical devices.
The main objective of this project is to
investigate the implementation of safety-related
design architectures like 2oo3 (two-out-of-three),
2oo2 (two-out-of-two), 1oo2 (One-out-of-two)
…etc, and its related safe computational approaches
based on the selection of monitoring vital parameter
of a human. These collected data evaluations and its
computational approaches results in applicability to
new areas in further advancing medical systems by
using-in methods & technologies like smart fusion
sensors, machine learning, data analytics, artificial
intelligence and internet of things (IOT).
We intend to collect data from multimodal
sensor fusion elements in a non-invasive mode by
sensing & analysing the biomedical signals from a
Prasada Raju, L., Anumukonda, M. and Roy Chowdhury, S.
Safety-related Studies on Non-Invasive Biomedical Signals and Its Aptness Usage in Design of Fault Tolerant Multimodal Human Health Monitoring System.
In Doctoral Consortium (BIOSTEC 2019), pages 3-14
Copyright
c
2019 by SCITEPRESS – Science and Technology Publications, Lda. All rights reserved
3

specific organ like Heart and to do the diagnostic
correlative computations inline to this safety related
approaches. Thus, this research studies helps in
improvements in mechanisms in addressing the
challenges and to achieve the following objectives:
The designed HHMS ensures in providing
uninterruptable authentic vital data.
The design and development of fault tolerable
system, ensures in reduction of undesired
spurious alarms for any single point failures.
The designed fault tolerant multimodal human
health monitoring system enhances the capability
to provide inferences in predicting an illness, by
processing the multi-signal input data and
performing data analytics on the data collected
from these diverse sensors for pathological
completeness.
Implemented safety-related health monitoring
systems, ensures the ability to reduce fault
alarms, for effective nursing by reducing alarm
fatigue.
Enhances the health monitoring systems
capability in performing self-system diagnosis
for effective detection of system faults, and if
any fault detects, the system ensures safe-
degradation or fault-tolerable i.e. without loss of
system functionality.
The design approach ensures, a non-invasive
patient monitoring systems (PMS) or wearable
diagnostic systems (WDS) can be made portable
with low cost having safe functionality.
In present systems, the availability of diagnostic
systems with functions like fault tolerant,
multimodal sensor fusion interfaces with portable or
wearable devices is limited.
We proposed to design and develop a portable &
wearable monitoring medical system prototype,
using safety -related architecture to collect the data
from primarily three diverse sensors, by detecting
electric potential, light and sound signals via non-
invasive. These diverse sensors used to detect bio-
medical signals to obtain data of electrocardiogram
(ECG), Photo-plethysmogram (PPG) and
Phonocardiogram (PCG).
As a strategy, we designed three independent &
diverse computing channels using ECG, PCG &
PPG sensors and a validated algorithm is used in
each channel to measure the heart rate. The
correlative diagnostic algorithms and related
procedures are developed to evaluate the
implemented safety-related architectures.
To predict the illness effectively, we decoded the
multi-modal data acquired by processing the various
biomedical signals and data analytics is performed
with correlative algorithms to unravel the illness. In
order to collect the data efficiently, a smart wearable
smart sensor-fusion suite is developed for
investigating the identified illness parameters like
cardiac related ailments.
The ultimate objective is to provide a mechanism
for human health monitoring systems using safety
related architectures for improvements in predicting
the illness effectively. These safety-related multi-
modal fault-tolerant studies will be combined with
the pathological studies, helps in development of
various gadgets from point-of-care devices to safety
critical patient monitoring systems, with aptness
usage on various organs health monitoring.
Additionally, this type of devices supports further
research in development of fusion-sensors, and on
usage of machine learning, deep learning algorithms.
These medical devices embedded with
histopathological studies further helps in predicting
the illness still more effectively.
3 STATE OF THE ART
Recent studies (Edworthy et al., 2018), (Bach et al.,
2018) (Hravnak et al., 2018) indicated that most of
the vital patient monitoring medical systems follows
IEC 60601 and related specific standards and
various design implementation techniques (Sheng et
al., 2013) (Alemzadeh et al., 2012) (Börcsök et
al.,2004) for better safety. It has been further
reported (Vescio et al., 2018) (Hsiao et al., 2017)
(Miao et al., 2017) (Selvaraj et al., 2008) that there
is a possibility to measure the same vital parameter
by monitoring diverse biomedical signals using
varied sensors. However, all the mentioned studies
have common limitation, that is, most of medical
related systems have been designed in 1oo1 (One-
out-of-one) i.e., one sensor measurers one or more
vital parameters but stops functionality and
generates alarm if any disturbance occurs as a safety.
In this present digital age, with advancements in
technology, medical systems are evolving from
analog to digital and simple to complex systems.
Over the last decade or so years, due to rapid growth
in technology and innovations, the systems are
shrinking in size and a lot of demand arise for new
methods to mitigate the challenges, for making the
medical systems resilient & reliable along with
safety improvements. In critical pre- & post
monitoring of the patients at ICU scenarios, if any
abnormal condition occurs, a system should provide
timely notification to operators, and performance
DCBIOSTEC 2019 - Doctoral Consortium on Biomedical Engineering Systems and Technologies
4

should degrade gracefully rather than abruptly,
especially in life-sustaining medical systems. This
level of capabilities for a reliable safety system
requires mainly Availability & Reliability of
measurements in any given scenarios. Additionally,
it requires, reliable sensing with or without
redundancy structures, system modes of operation &
real-time response, self-monitoring built in test
functions, well-organized fault identification &
isolation of faults with safe degraded function, a
well-defined system negation mechanism for all
types of errors, to generate the related alarms, and
overall in implementation, the system should meet
the guidelines set by standard IEC 61508 and IEC
60601(Medical devices) for the best practice of
functional safety. Thus, having this type of system
requirements will reduce the false or fault or
insignificant alarms and enhance the safety feature
of the device for consistent vital sign measurements.
This proposed approach of fault-tolerant safety
related design strategy, such as 1oo2- (one-out-of-
two), 2oo2- (two-out-of-two), 2oo3- (two-out-of-
three) or MooN (M-out-of-N) logic for reliable
sensing and computation of cardiac vital parameter
like heart-rate measurement using field
programmable gate array (FPGA). This design uses
a hybrid sensor (fused sensors in combination of
electrocardiogram (ECG) or phonocardiogram
(PCG) sensors or photo-plethysmogram (PPG)
sensors) for reliable sensing. These sensors are
connected to each channel independently and a safe
voting function uses Pearson’s correlation
coefficient method for computing the correlation of
coefficient ‘r’ between the heartrate values measured
from any two independent diverse channels. The
resultant coefficient ‘r’ is used by a fault tolerant de-
gradable safe function & built-in test(BIT) function
for isolation of fault and enables a reliable heartrate
values for display at no fault condition. This safe
function uses negation error codes to generate the
related alarm for each significant detected fault and
log the results. The accuracy of the heartrate
measurements and the coefficient of correlative
results of vital sign measurements between two
channels are analyzed using Bland–Altman and
correlative plots (Bland et al., 1986). The recorded,
failure detected signal & heartrate measurements at
each channel output along with results of safe
function output are analyzed for effective
functioning of fault isolation and reduction of single
point of failures (SPOF).
This doctoral research project focuses primarily,
in reduction of SPOF & false or fault alarms by
using safety related architectures without using
redundancy along with a fault-tolerant safe degraded
algorithmic function for continuity and consistent
vital sign measurements. This design approach
contributes high availability of the system with
consistence in vital sign measurements. Availability
of the system, explains that, both channels should
detect a failure for the system to fail, or else, at least
one channel functioning is enough to operate the
system. It further explains how a same single cardiac
vital sign parameter is measured in parallel channels
by using diverse sensors and the results are
correlated along with safe voting function for
consistent vital sign measurements. Thus, evaluating
these results by additionally applying the
pathological data, helps in obtaining a state of the art
medical device for further research studies on
monitoring various organs for early detection of
various abnormalities.
4 METHODOLOGY
The experimental activities of this research project
are divided into mainly 3 main parts:
First part dedicated to the evaluation of the
aptness to use the safety related architectures in
the medical systems to measure basic vital
parameters, and identification of suitable sensors
for sensing biomedical signals like sensing thru
electric potential, sound and light.
Second part dedicated to the design and
realization of a three-independent channels with
sensor and FPGA based research prototype for
experimental studies.
Final part dedicated to the calibration of the
research platform (sensor, configurable safety
architectures and FPGA circuits), by performing
lab & field trails in evaluating the vital parameter
like heart-rate, in addressing the mentioned
challenges as reduction of fault alarms, algorithm
limitations and uninterruptable functionality with
safe degradation.
4.1 Investigating of Existing
Safety-related Architectures
The standards IEC 61508 and IEC 60601(Medical
devices) have been referred for the best practice of
functional safety and now recognized all over the
world. In the IEC 61508 standard, several
architectures such as 1oo2-, 2oo2-, 1oo3-, and 2oo3-
are introduced for safety related systems. However,
the selection of the architecture depends on
Safety-related Studies on Non-Invasive Biomedical Signals and Its Aptness Usage in Design of Fault Tolerant Multimodal Human Health
Monitoring System
5
application requirements such as safety, reliability
and availability levels. Here, some of the common
architectures are investigated and evaluates the
proposed architectures for suitability for medical
monitoring systems to address the mentioned
challenges.
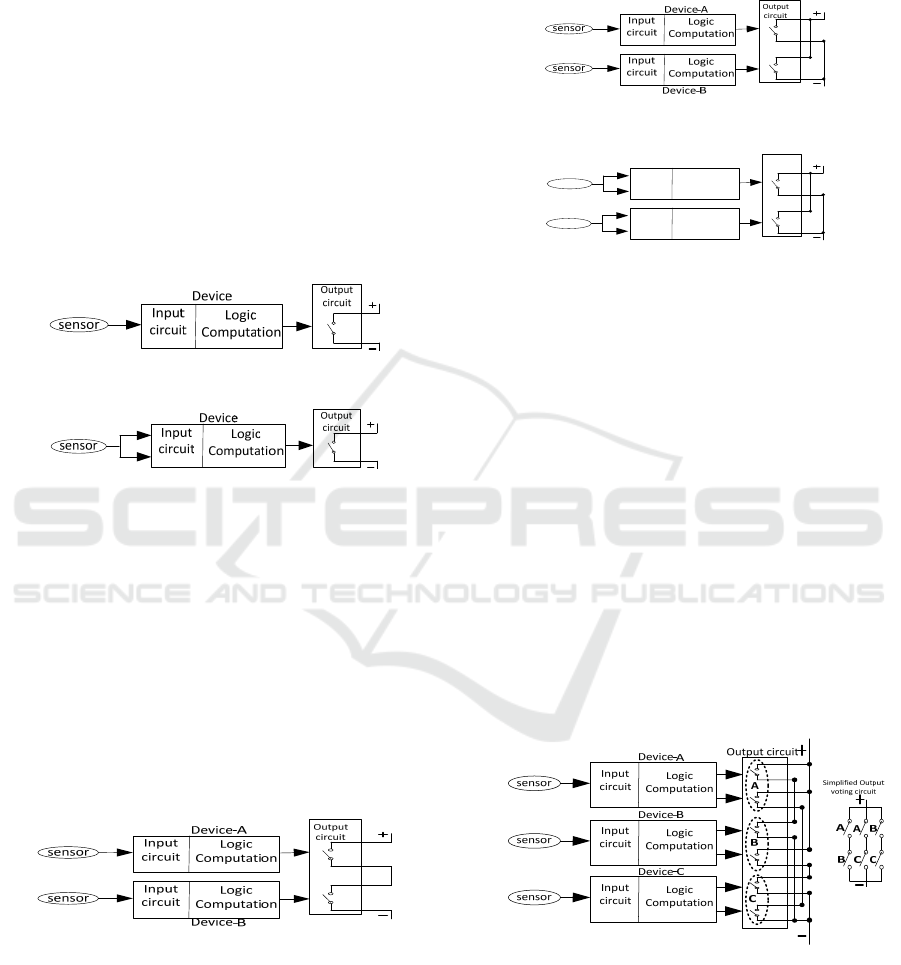
1oo1(1-out-of-1): The system based on a single
channel architecture, shown in Figure 1, Figure 2
and is typically designed for low level safety
applications. Most of the point-to-care health
monitoring devices and low-cost patient monitoring
systems are based on this principle. In this system, if
any single failure occurs in sensor or at device, the
output represents a single switch shows wrong
results or loss of the safety function or a process will
dangerous shut down by raising the alarm.
Figure 1: Basic system 1oo1(1-out-of-1) architecture.
Figure 2: 1oo1-with self-checking pair safety architecture.
1oo2(1-out-of-2): The architecture 1oo2- has two
outputs (based on two 1oo1 channels) connected in
series as shown in Figure 3. Thus, the system
improves the performance of safety integrity of
safety system, since, any single contact is required to
dangerously shutdown the process by raising the
alarm. The disadvantage is it increases twice the
potential for nuisance failures. Thus, neither 1oo1-
nor 1oo2- architectures has any capability to reduce
the potential failures or alarms. However, a self-
diagnosis and switch over mechanism to 1oo1
possibilities can be explored.
Figure 3: 1oo2 (1-out-of-2) basic safety architecture.
2oo2(2-out-of-2): The 2oo2- has two outputs (based
on two 1oo1- channels) connected in parallel, as
shown in Figure 4 and Figure 5. The system
advantage is, if the system to go for dangerous
shutdown both channels should fail to raise the
alarm, else if, any single channel functionally
operational, the system operates normally. Thus,
implementing additional safety measures like
diverse sensors & diverse algorithms for
computations in each channel, this system has the
capability to reduce the potential failures or alarms.
Figure 4: 2oo2 (2-out-of-2) safety basic architecture.
Input
circuit
Logic
Computation
Input
circuit
Logic
Computation
Output
circuit
Device‐B
Device‐A
sensor
sensor
Figure 5: 2oo2(2-out-of-2) with dual self-checking pair
safety architecture.
2oo3(2-out-of-3) or Triple Module Redundancy
(TMR): The 2oo3- based system has three channels
with three outputs connected to a complex output
voting circuit as shown in Figure 6. The system
advantage is, if the system to go for dangerous
shutdown, any two channels should fail to raise the
alarm i.e., The system continuously operates even
when any single channel dangerously failed. These
2oo3 systems (TMR) or similarly 2oo4- quadruple
modular redundancy(QMR) is usually used in fault
tolerant applications, where the system must
continue functioning despite a failure—most often
in, life-support medical devices. Thus, implementing
additional safety measures like diverse sensors &
diverse algorithms for computations in each channel,
these systems has the capability to reduce the
potential failures or alarms.
Figure 6: 2oo3 (2-out-of-3) basic safety architecture.
Referring to (Börcsök et al.,2004) and based on
the above investigations, the 1oo2-, 2oo2- and 2oo3-
architectures are suitable due to safe & high
availability with diverse redundancy. The possibility
of fault-tolerant and continuity of system functional
operation can be achieved by using safe system
DCBIOSTEC 2019 - Doctoral Consortium on Biomedical Engineering Systems and Technologies
6

degradation mechanism with proper log data
analytics. These architectures can be configured
based on the chosen health parameter monitoring in
medical systems.
4.2 Conceptual Design with 1oo2, 2oo2
& 2oo3- Architectures
The proposed approach for safe computation and
fault detection is based on composite fail safety
principle with 1oo2-, 2oo2- or 2oo3 architecture.
The design architecture consists of three micro-
processing devices (Device A, Device B, Device C
and Device O), in which safety critical functions are
partitioned and performed through three devices (A,
B & C) with diversity, while a fourth device (O) is
responsible for performing safety related functions.
Due to modularity in this system design approach,
the system provides an advantage of architecture
configurability based on feasibility & criticality of
the desired parameter to be measured. Thus, an
advantage of concurrent multi-signal, multi-
parameter, independent processing and possibilities
of effective correlative analysis of the values can be
explored by using this system. Based on the system
configuration such as 2oo3-, the three devices (A, B
& C) do the cross checks between themselves using
interconnection links and along with the fourth
device (O) they perform built-in-tests & negation
operations as per the defined safe state for each fault
detection.
In this system design, functional faults have been
attempted to be detected. At each fault detection, a
defined safe state is to generate an alarm and a
negation operation is performed i.e., a code or a
known defined value need to be generated and
recorded for the defined fault/error. This
fault/negation value indicates the type of
fault/failure.
Figure 7: 2oo2(2-out-of-2) Architecture design for HHMS.
The system uses an independent device units A,
B, C & O with stand-alone diverse computations,
and the implemented logic is programmed into each
Field Programmable Gate Array (FPGAs) devices
respectively, thus an agreement is required between
the three devices A, B and C to ensure composite
fail-safety. The feedback loop of failure detection
and appropriate execution of negation operation,
ensures the fail-safe operations of the system to the
incidence of data errors and their effectiveness in
reducing the false alarms, and ensures the systems
toward resiliency.
The proposed conceptual design architectures
2oo2- and 2oo3- are shown in Figure 7 and Figure 8.
Figure 8: 2oo3(2-out-of-3) Architecture design for HHMS.
4.3 System Hardware Description
4.3.1 System Overview
The system is designed in a modular approach and
each device unit consists of a Field Programmable
Gate Array(FPGA) and an analog front-end(AFE)
device. The flexibility in this approach is used to
configure the device in any one of the proposed
safety architecture for safe functional computations
in diverse method.
A system block diagram shown in Figure 9, has
three independent diverse channels of Device-A, -B
& -C and voting logic output in Device -O. The
entire system operates at 100 MHz and each channel
specifically processes, single data type of multi-
input signals like ECG signal is based on electrical
sensing data type, PPG signal is based on Optical
sensing data type and PCG signal is based on Sound
wave sensing data type. Each device -A, -B &-C is
having a FPGA XC6SLX45 & an analog front-
end(AFE) and the device – O uses an FPGA having
a controller with 16MB flash memory & 64MB
dynamic RAM, that processes the voting logic and
interacts with graphical user interface (GUI). The
CHMS GUI is a front-end software tool developed
in MATLAB, which controls & interacts with the
system via high speed serial interface. The CHMS
GUI is a multipurpose tool operated from a PC and
Safety-related Studies on Non-Invasive Biomedical Signals and Its Aptness Usage in Design of Fault Tolerant Multimodal Human Health
Monitoring System
7

can be utilized for real time analysis of the received
sensor sample data from three different channels.
Figure 9: HHMS -System Block Diagram.
4.3.2 Device A– ECG Signal Computation
Channel Design
Overview: The Device -A, is an independent
channel, specifically to process the ECG signals.
This device consists of a Sensor, AFE & FPGA
module.
EPIC Sensor: The present system uses an electric
potential integrated circuit (EPIC) sensor chip,
which is a non-contact or dry contact sensor, to
sense the electro potentials on the surface of the skin
using a capacitive sensing technique. This advanced
sensor chip acts like a near perfect electro voltmeter
and eliminates the subject or patient shaving the hair
on the skin, usage of gels & other contact-enhancing
substances. This sensor is a perfect suitable sensor
for this type of portable/wearable CHMS
applications measuring the ECG, since, there is no
need for potentially dangerous low impedance
circuits across the heart. The availability of sensor
resolution, is as good as or better than conventional
wet electrodes.
Figure 10: (a) EPIC Sensor, Courtesy of photo from
Plessey Semiconductor sensor datasheet and (b) Internal
sensor schematic.
A single EPIC sensor, when placed on or near
the patient, an ECG signal can be recovered and is
capable of monitoring continuous ECG as well as
making more exacting clinical diagnostic
measurements. Using an array of EPIC sensors,
which are placed on the chest in a traditional 12-lead
configuration positions can recreate the signal
resolution as good as or better than the achieved
using traditional electrodes. These EPIC sensors can
be used to diagnose various heart diseases, which
can be measured and interpreted through ECG
recordings.
Two EPIC sensors are used, and the outputs are
connected to the pins of ADS1298R chip 1NN &
1NP in differential i.e., connected to ADC channel-
1, whereas the chip is configured in differential
mode of operation.
Status Ch‐1 Ch‐2 Ch‐12
24bit 24bit
24bit
DRDYn
CSn
SCLK
DOUT
(a)
(b)
Figure 11: (a) Circuit Schematic ADS1298R of Device-A
and (b) SPI Protocol for data sample reading.
Analog Front-End(AFE): The device uses an
analog front-end AFE1298R chip from Texas
Instruments and it can be used to acquire bio
potential such as 12-lead ECG signals or EEG
signals. The chip has low power eight-channel, 24-
bit-delta-sigma (ΔΣ) analog-to-digital converters
(ADCs) with built-in programmable gain low noise
amplifiers(PGAs) with simultaneous sampling
functionality.
The device is configured to obtain 1000 Samples
per second (SPS) and is interfaced to two electric
potential integrated circuit (EPIC) sensors in
differential mode. The AFE device is configured by
FPGA via SPI interface in Read Data Continuous
(RDATAC) mode and read data continuously in 8bit
burst cycle, such that all 216 bits per device [24
status bits + 24 bits per channel) X 8 channels] and
additional second AFE device interface in daisy
chain configuration for additional 4-channels are
read by an FPGA via SPI interface. A highlighted
schematic and SPI data timings shown in Figure 11.
ECG Data Pre-Processing using FPGA: An FPGA
is used to perform the desired computation of
measuring the heart rate by detection of R-peaks in
real time from the received ECG data collected from
a subject or a patient.
On power-up, the FPGA is configured by the
GUI for the desired functions to perform. The
designed FPGA consists of an ECG controller, SPI
controller and ECG function specific IP cores as
shown in Figure 12. Once configured by the GUI,
ECG controller coordinates by configuring the AFE
DCBIOSTEC 2019 - Doctoral Consortium on Biomedical Engineering Systems and Technologies
8

ADS1298R and starts reading the ECG data via SPI.
Based on the desired function set by GUI, the ECG
controller uses specific function IP core, which is
enabled (where a specific algorithm is executed) in
the ECG processing Engine (EPE) and sends the
measured values to the Device –O for safe
correlation logic.
Figure 12: ECG-FPGA for function computation.
In this proposed system, a R- peak detection
function computation is performed on every 1000
samples per second (SPS). The sampled ECG data
continuously received for a defined period, which is
configured via GUI. The detected R-peak count
values are processed to measure the heartrate and
this parametric data is correlated using safe function
in Device –O.
R- Peaks Detection: To detect the R-peaks,
detection of QRS complex is most important. The
algorithm in (Chowdhury et al., 2012) has
successfully detected QRS with an accuracy 99.5%
using single channel ECG with entropy criteria. This
algorithm is implemented in the present work for
heartrate measurement.
4.3.3 Device B– PPG Signal Computation
Channel Design
Overview: The Device -B, provides an independent
channel, specifically to process the photo-
plethysmogram (PPG) signals. This device consists
of a Sensor (LED & opto-detector), AFE & FPGA
module.
PPG Sensor and Detector: PPG is an optically
obtained volumetric measurement of an organ. In
principle, the measurement of PPG is by
illuminating the skin and subcutaneous tissue with
radiation of a specific wavelength. This radiation
will come from a light emitting diode (LED). This
light when illuminated at the measuring point on a
patient or subject, is either absorbed, passed through,
or reflected-back from the capillaries below the skin.
A photodiode measures the light that is either
transmitted or reflected, depending on where it is
placed relative to the LED. The photodiode then
converts the measured light into an electrical signal.
In this system we used two LED sources of
specific wavelengths of light-- red, which is 660 nm,
and infrared, which is 940 nm. For photodetector we
used OP101 IC for detecting the transmitted light.
Analog Front-End (AFE): An AFE4490 chip is
used in device -B. This chip is a fully-integrated
analog front-end (AFE), which is ideally suited for
pulse-oximeter type of applications. This device is
suited for measuring heartrate and other blood
parameters. The device consists of a low-noise
receiver channel with a 22-bit analog-to-digital
converter (ADC), an LED transmit section, and
diagnostics for sensor and LED fault detection.
The device is configured, to process 200 Samples
per second (SPS) and is interfaced to FPGA. The
AFE device is configured by FPGA via SPI interface
and read data continuously for further processing in
FPGA. A highlighted schematic and sample data
timings shown in Figure 13.
PlethysmographSignal
PhotodiodeCurr entor
I‐VOutputPul ses
AmbientLevel
(DarkLevel)
IR‐LED‐‐ONSignal
RED‐LED‐‐ONSign al
(a)
(b)
Figure 13: (a) Circuit Schematic of AFE4490 of Device-B
and (b) Sample data read timings.
PPG Data Pre-Processing using FPGA: The PPG-
FPGA sub system is used to perform the desired
computation like measuring the heart rate by
detection of P-peaks in real time from the received
PPG data collected from a subject or a patient via a
AFE SPI interface.
On power-up, the FPGA is configured by the
GUI for the desired functions to perform. The
designed FPGA consists of a PPG controller, SPI
controller and PPG function specific IP cores as
shown in Figure 14. Once configured by the GUI,
PPG controller coordinates by configuring the
AFE4490 and starts reading the PPG data via SPI.
Based on the desired function set like heartrate by
GUI, the PPG controller enables the specific IP core
(where a specific algorithm is executed) in the PPG
processing Engine (PPE) and sends the measured
values to the Device –O for safe correlation logic.
A P- peak detection function computation is
performed on every 200 SPS. The sampled PPG data
continuously received for a defined period, which is
configured via GUI. The detected R-peak count
values are processed to measure the heartrate and
Safety-related Studies on Non-Invasive Biomedical Signals and Its Aptness Usage in Design of Fault Tolerant Multimodal Human Health
Monitoring System
9

this parametric data is correlated using safe function
in Device –O. The functional block diagram of PPG-
FPGA implemented logic is shown in Figure 14.
PPG
IPCore‐1
PPG
Controller
SPIMaster
con troller
PPG‐FPG
A
PPG
IPCore‐n
PPG
IPCore‐2
PPGProcessingEngine(PPE)
AFE
4490
BusInterface
Accelerometer
Figure 14: PPG-FPGA for function computation.
P- Peaks Detection: Each cardiac cycle sends a
pressure wave through the cardiovascular system.
This pressure wave causes the blood vessels to
expand and contract, which gives the PPG a
characteristic waveform. Since the period of the
PPG waveform repeats with each cardiac cycle, it
too can be used to calculate a patient's heart rate.
The algorithm in (Paradkar et al., 2015) has
successfully detected the pulse rate with an accuracy
99.39% using PPG with entropy measures. This
algorithm is implemented in the present work for
heartrate measurement.
4.3.4 Device C– PCG Signal Computation
Channel Design
Overview: The Device -C, is an independent
channel, specifically to process the
Phonocardiogram (PCG) signals. This device
consists of a Sensor (Digital MEMS microphone)
and an FPGA module.
PCG Sensor: The device uses four individual
Digital MEMS microphone MPDT01 sensors and
each sensor to cover the four heart valves (Aortic,
Tricuspid, Mitral, and Pulmonary). The criteria of
selecting this sensor is due to low noise,
miniaturised device, low cost and simple interface to
process the binary sound signal. The digital MEMS
microphone has digital output type of Pulse Density
Modulation (PDM) format, with a high sensitivity of
-26 dBFS, signal to noise ratio (SNR) of 62.6 dB
and has a flat frequency response of 20 Hz to 15
KHz. The set of sensors is placed on human chest
for capturing the heart sounds at four heart valves
simultaneously with good quality due to its high
sensitivity and flat frequency response.
The digital MEMS chip has inbuilt signal
preconditioning, filtering and signal enhancement
module that provide digital PDM output for further
processing in an FPGA. The sensors are interfaced
serially to FPGA and captures the data at 1 MHz
inline to the data read timings specified in the
MPDT01 datasheet. The highlighted interface circuit
schematic and its data read timings is shown in
Figure 15.
FPGA
Digital
MEMS
3.3V
GND
DATA
LR
CLK
C1‐
100nF
C2‐
10uF
Out
In
Out
HiGH‐Z
Cloc k
PDM‐R
PDM‐L
(
a
)
(
b
)
Figure 15: (a) Device-C Circuit and (b) Data read timings.
PCG Data Pre-Processing using FPGA: The PCG-
FPGA, is used to perform the desired computation
like measuring the heart rate by detection of S-peaks
in real time from the received PCG data.
On power-up, the FPGA is configured by the
GUI for the desired functions to perform. The
designed FPGA consists of a PCG controller, which
enables the PCG processing engine (PCE) to capture
& process the received digital data from the MEMS
as shown in Figure 16. Based on the desired function
set like heartrate by GUI, the PCG controller enables
the specific IP core (where a specific algorithm is
executed) in the PCG processing Engine (PPE) and
sends the measured values to the Device –O for safe
correlation logic.
A S- peak detection function computation is
performed on a 2000 SPS. The converted PDM to
PCM sampled PCG data is continuously received for
a defined period, which is configured via GUI. The
detected S-peak count values are processed to
measure the heartrate and this parametric data is
correlated using safe function in Device –O.
PCG
IPCore‐1
PCG
Controller
PCG‐FPGA
PCG
IPCore‐n
PCG
IPCore‐2
PCGProcessingEngine(PPE)
PCGSensor‐2
BusInterface
Accelerometer
PCGSensor‐3
PCGSensor‐4
PCGSensor‐1
Figure 16: PCG-FPGA for function computation.
S- Peaks Detection: At each cardiac cycle major
heart sounds S1 and S2 are produced due to closing
and opening of the heart valves. The heart rate is
directly proportional to the number of S1 peaks per
minute, so the S-peaks detection is considered for
the heart rate monitoring.
The algorithm in (Anumukonda et al., 2015) has
successfully detected the S1 peaks using spectral
analysis of PCG data and measure the number of S1
peaks per minute. This algorithm is implemented in
the present work for heartrate measurement.
DCBIOSTEC 2019 - Doctoral Consortium on Biomedical Engineering Systems and Technologies
10
4.3.5 Device O -Safe-Selection Logic
Implementation using Karl Pearson’s
Correlation Coefficient Method
To measure the magnitude of the relationship
between two variables, (Vescio et al., 2018) (Hsiao
et al., 2017) (Miao et al., 2017) (Selvaraj et al.,
2008) we used Karl Pearson coefficient method for
calculating the correlation coefficient ‘r’.
r = (∑XY)/√(∑X^2 × ∑Y^2 ) (1)
X = x - x
̅
(2)
Y= y - y ̅ (3)
where x
̅
,
y
̅
are "mean"
The ‘r’ values always lies in between -1< r < 1,
and the interpretation of ‘r’ is as below:
When r = 1, there is perfect +ve relationship
between the variables, when r = -1, there is a perfect
-ve relationship between the variables and when r =
0, there is no relationship between the variables.
And, if the correlation is +1 or –1, it signifies
that there is a high degree of correlation. (+ve or –
ve) between the two variables. So, if r is near to zero
i.e., 0.1, -0.1, (or) 0.2 there is less correlation.
As a rule-of-thumb for interpreting the
coefficient of correlation value ‘r’, the below Table
1, shows the standard interpretation of relationship
between two variables.
The measured two variables A, B from two
diverse signals are correlated and calculated
correlation coefficient ‘r
AB
’ in a set of pre-
determined continuous samples.
Table 1: Rule of Thumb for Interpretation of the
correlation coefficient 'r' values.
Coefficient of Correlation ‘r’ Interpretation
0.90 to 1.00 (-0.90 to -1.00) Very high +ve or -ve
0.70 to 0.90 (-0.70 to -0.90) High +ve or -ve
0.50 to 0.70 (-0.50 to -0.70) Moderate +ve or -ve
0.30 to 0.50 (-0.30 to -0.50) Low +ve or -ve
0.00 to 0.30 (-0.00 to -0.30) Negligible
4.4 Experimental Set-up and
Evaluation Framework
4.4.1 Experimental Set-up
The experiment was carried out in steps.
Configuration of the CHMS using GUI
Preparation of the subject for Experiment
Sensors placement on a wearable-suite
Simulation Experiment and Evaluation
Clinical Experiment
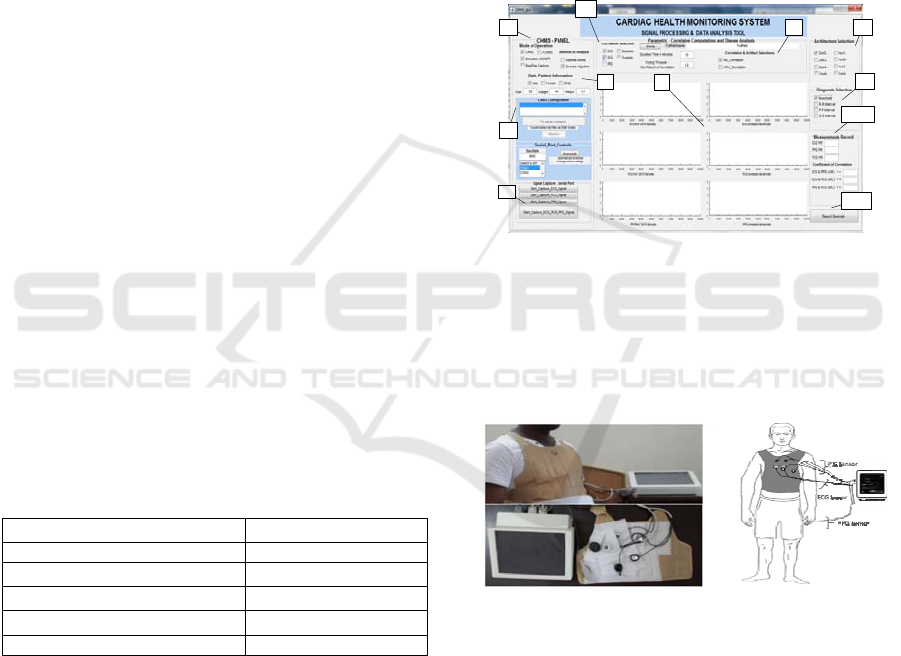
A MATLAB tool based Graphical user Interface
(GUI) is developed for configuring the CHMS as
shown in Figure 17. The tool provides 1. CHMS
control panel – which provides options of real-time
algorithm model development & evaluation, setting
simulation mode and options for analysis, 2. Basic
patient information, 3. Device configuration panel,
4. Sensor selection for correlation, 5. Parameter
selection, 6. Safety architecture selection, 7.
Diagnosis artefact selection, 8. Signal capture
controls, 9. Raw signal to Processed signal capture,
10. Duration record, 11. Report generation.
1
2
4
5 6
7
10
9
8
3
11
Figure 17: MATLAB based GUI tool for system
configuration and Data sample collection.
Multimodal sensors are placed on a wearable
suite and shall be wore by the subject as shown in
Figure 18, which will be connected to the portable
monitoring device prototype.
(a)
(b)
Figure 18: (a) Experimental set-up and (b) CHMS - PPG,
PCG & ECG Sensors placement.
4.4.2 Application Protocol
The system has been preliminary validated with the
data collected of 5- subjects with various age groups
conforming to the declaration of Helsinki. The
subjects aged between 15 years to 55 years, were
available for measurement and testing after taking
informed consent of which 5 normal healthy patient
data have been used.
Recommendations before taking measurements:
Safety-related Studies on Non-Invasive Biomedical Signals and Its Aptness Usage in Design of Fault Tolerant Multimodal Human Health
Monitoring System
11

The advisories are roughly the same as those
used for blood pressure(BP) measurements. Most of
the physical or psychological factors can influence
the assessment of heart rate. We mainly followed,
1. Heart rate can be influenced by exercise,
alcohol, nicotine, and coffee. These should be
avoided in the hours preceding measurement. 2.
Subject should be preferably seated in a chair with
legs uncrossed, with comfortable room temperature,
and no noise, before taking readings. 3. The subject
should refrain from talking during taking readings,
and at least 5 minutes should elapse before the first
reading is taken. 4. Hemodynamic variable need to
be assessed in patients under medical investigation
for hypertension or cardiac disease before the heart
rate is measured. 5. Avoid taking reading from the
subjects, if they are receiving pharmacological
therapy, and the doctor should be aware that many
cardiovascular drugs can either decrease or increase
the heart rate.
The CHMS is configured via GUI, by enabling
the ECG & PCG sensors in 2oo2 mode, and the
measured heartrate readings are recorded for a
period of 1-hour duration for each subject. The
recorded is evaluated in real time. As per (Wikipedia
Contributors, 2019), calculated trigger levels for
HR
max
(MaxHR), HR
min
(MinHR), Targeted HR
(THR)-Upper limit & Lower limit levels and
Adjustable (ADJ) Upper limit (UL) & lower limits
(LL) at 5% & 10% are set for the defined criticality,
to generate the alarms. The safe logic
implementation does data correlations and generates
alarm for variances at ‘r
AB
<0.5’ and evaluates the
faults in each channel independently. The authentic
data with no fault at each channel is enabled for
output. With 2oo2-logic, if both channels faults, then
the alarm is enabled with no data display, else if
fault noticed only at single channel, then the system
degrades to safe working 1oo1 channel and continue
to operate un-interruptedly by logging the record.
Thus, the alarm and data computations values are
generated and recorded. These resultant values are
displayed from each channel, ECG-1oo1 & PCG-
1oo1 along with 2oo2 resultant mode of operation
for investigations.
4.4.3 Results and Discussion
The processed data and fault alarm signals are
captured from channels ECG-1oo1, PCG-1oo1,
configured 2oo2- outputs are presented in Figure 19,
Figure 20, and Figure 21 for a single subject. As it is
analysed that, the reading from all the 5 subjects are
almost similar, and in Figure 22, presents the 2oo2-
results, which shows the reduction in alarms.
In Figure 19, presented the data captured from
ECG 1oo1 channel with HR measured data and
inverted alarm signal for a duration of 1 hour.
Analysed and captured alarm is with respect to the
set ADJ-UL & LL are shown. Similarly, for PCG
1oo1 channel shown in Figure 20.
Figure 19: 1oo1 -ECG HR measurement Vs Alarm Signal.
Figure 20: 1oo1 - PCG HR measurement Vs Alarm Signal.
The correlation coefficient ‘r
AB
’ values and the
ECG & PCG HR measurements are captured in
Figure 21 and analysed for deviances at each
channel.
Figure 21: ECG & PCG HR measurements, r
AB
Correlation Coefficient values Vs r
AB
Signal.
The comparative and safe logic degradation logic
implementation analysis using alarm signals are
captured in Figure 22. Which shows a significant
reduction of alarms with consistency HR data record
in 2oo2 design architecture.
DCBIOSTEC 2019 - Doctoral Consortium on Biomedical Engineering Systems and Technologies
12

Figure 22: r
AB
Signal and Alarm outputs (ECG -1oo1,
PCG -1oo1 and 2oo2 configured Alarm signal).
5 EXPECTED OUTCOME
The proposed aim of this research project is to
provide aptness usage of safety related architectures
in design of Non-invasive human health monitoring
systems (HHMS), Point-of-Care (PoC) Medical
systems with fault-tolerable and portable to
multimodal sensors. This is done in mitigating the
teething challenges and achieving the outline
objectives mentioned in section-2 and to provide a
platform for further research scalability with scope
to improvement in predicting the diseases at early
stages.
We expect to deliver the design evaluation
results on a selected vital parameter ‘heart-rate
(HR)’, along with the research platform designed
with safety-related architectures, compatibility with
multimodal sensor interfaces and fault-tolerable
function.
However, to achieve the outline objectives,
primarily, we designed a research platform for
experimentation and ensured to perform evaluations
at hospital environments. Secondly, we choose to
evaluate the 2oo2 (two out of two) architecture and
presented the results in section 4.4. Thus, a safe
degradation logic and fault tolerable functions are
evaluated, and the results shows reduction in alarms
and additionally shown an improvements in
presenting uninterruptable authentic HR data record.
Further research studies need to be performed in
evaluating safety related architectures such as 2oo3
(two-out-of-three), 2oo2 (two-out-of-two), 1oo2
(One-out-of-two), along with various combination of
sensors like ECG verses PPG, ECG verses PCG,
PPG verses PCG and combination three sensors.
Applying correlation techniques on diagnostic data a
planned systemic research need to be performed in
achieving the objectives and providing relevant new
insights towards pathological completeness on early
identification of the illness or diseases.
Few of the criteria considered in building this
HHMS research platform, is to applicability of these
design concepts to wide range of medical systems
from safety-critical Intensive Care Unit (ICU) based
medical monitoring systems to complex-automated
patient operated robotic surgery medical systems, to,
as low as, simple real time monitored point-of-care
(PoC) medical gadgets or wearable medical
monitoring devices.
We used the validated algorithms for measuring
heart-rate and selected the available sensors like
EPIC (Plessey Semiconductors Inc), Digital MEMS
microphone (ST Microelectronics), Light Emitting
Diodes (LEDs) & Opto-detectors. We designed and
developed the safety mechanisms without
redundancy. As part of the project, we designed a
MATLAB based GUI for data analytics for results
evaluation during experiments. The preliminary
results during lab & field trails are encouraging. We
expect to, following the success of this task, propose
a low-cost wearable medical device by meeting the
criteria for commercial usage. We will then bring
this configurable prototype platform to real factory
conditions due to collaboration with our partner
companies interested in this concept.
6 STAGE OF THE RESEARCH
The uninterruptable monitoring, reduction of false &
fault alarms, and authentic display of measured vital
parameters is the need of the hour for any critical
patient monitoring systems during system under
operation even if any fault occurs. At critical times
of ICU patient monitoring or at general patient
check-ups, the predictive detection of illness is more
important for critical nursing.
The current research project is related to
evaluation of safety design architectures with and
with-out redundancies, and its aptness usage in
design of fault-tolerant non-invasive medical
system. A detailed literature has been reviewed in
the fields of medical systems like patient monitoring
systems, point-of-care medical devices and related
available functional system specifications for
processing of non-invasive biomedical signal
processing preceded the current research in-order to
approach this challenges in the most appropriate
way. At this point, we believe that it is possible to
0
0.5
1
0 500 1000 1500 2000 2500 3000 3500 4000
2oo2
AlarmSignal
Time
2oo2AlarmOutput
0
0.5
1
0 500 1000 1500 2000 2500 3000 3500 4000
PCG‐1oo1
AlarmSignal
Time
PCG‐1oo1Alarm
0
0.5
1
0 500 1000 1500 2000 2500 3000 3500 4000
ECG‐1oo1
AlarmSignal
Time
ECG‐1oo1Alarm
0
0.5
1
0 500 1000 1500 2000 2500 3000 3500 4000
r
AB
Signal(>0.5 )
Time
r
AB
Signal (>0.5)
Safety-related Studies on Non-Invasive Biomedical Signals and Its Aptness Usage in Design of Fault Tolerant Multimodal Human Health
Monitoring System
13

improve the medical systems resiliency by applying
the safety- related design approaches and we build
prototype of a multimodal wearable sensor suite
along with FPGA based medical diagnostic system.
The preliminary experiments have been
conducted, using this prototype with 2oo2 safety
architecture configuration with ECG & PCG sensors
and measured the HR to understand the cardiac
physiology. The initial recordings and its analysis
results are quite encouraging with uninterruptable
and authentic HR data with reduced alarms.
Further, with this experimental set-up, we extend
to configure the CHMS system with 1oo2-, 2oo2 and
2oo3 settings and perform research experiments to
collect the data. This serves us to study further on
the correlative analysis of non-invasive biomedical
signals on measured parameters in combination of
pathological data to infer predictable & early
detection of unknown illness along with mitigating
the desired challenges.
ACKNOWLEDGEMENTS
The author would like to thanks the Faculty of
Center for VLSI and Embedded Systems
Technologies (CVEST), International Institute of
Information Technology (IIIT) - Hyderabad and
School of Computing and Electrical Engineering
(SCEE), Indian Institute of Technology (IIT)-Mandi
for their valuable support during this research.
REFERENCES
IEC, I., 1998. 61508 functional safety of electrical
/electronic/programmable electronic safety-related
systems. International Electrotechnical Commission.
Börcsök, J., 2004. Electronic safety systems: hardware
concepts, models, and calculations. Hüthig.
Edworthy, J.R., McNeer, R.R., Bennett, C.L., Dudaryk,
R., McDougall, S.J., Schlesinger, J.J., Bolton, M.L.,
Edworthy, J.D.R., Özcan, E., Boyd, A.D. and Reid,
S.K., 2018. Getting Better Hospital Alarm Sounds Into
a Global Standard. Ergonomics in Design, 26(4), pp.4-
13.
Bach, T.A., Berglund, L.M. and Turk, E., 2018. Managing
alarm systems for quality and safety in the hospital
setting. BMJ Open Qual, 7(3), p.e000202.
Hravnak, M., Pellathy, T., Chen, L., Dubrawski, A.,
Wertz, A., Clermont, G. and Pinsky, M.R., 2018. A
call to alarms: Current state and future directions in
the battle against alarm fatigue. Journal of
Electrocardiology.
Sheng, H., Schwarz, M. and Borcsok, J., 2013, October.
Modeling a safety-related system for continuous non-
invasive blood pressure monitoring. In Biomedical
Circuits and Systems Conference (BioCAS), 2013
IEEE (pp. 254-257). IEEE.
Alemzadeh, H., Di Martino, C., Jin, Z., Kalbarczyk, Z.T.
and Iyer, R.K., 2012, June. Towards resiliency in
embedded medical monitoring devices. In Dependable
Systems and Networks Workshops (DSN-W), 2012
IEEE/IFIP 42nd International Conference on (pp. 1-
6). IEEE.
Chowdhury, S.R., 2012. Field programmable gate array
based fuzzy neural signal processing system for
differential diagnosis of QRS complex tachycardia and
tachyarrhythmia in noisy ECG signals. Journal of
medical systems, 36(2), pp.765-775.
Paradkar, N.S. and Chowdhury, S.R., 2015. Fuzzy entropy
based detection of tachycardia and estimation of pulse
rate through fingertip photoplethysmography. Journal
of Medical and Bioengineering Vol, 4(1).
Anumukonda, M., Ramasahayam, S., Raju, L.P. and
Chowdhury, S.R., 2015, December. Detection of
cardio auscultation using MEMS microphone. In
Sensing Technology (ICST), 2015 9th International
Conference on (pp. 173-177). IEEE.
Bland, J.M. and Altman, D., 1986. Statistical methods for
assessing agreement between two methods of clinical
measurement. The lancet, 327(8476), pp.307-310.
Wikipedia Contributors (2019) Heart rate, Wikipedia.
Wikimedia Foundation. Available at:
https://en.wikipedia.org/wiki/Heart_rate.
Vescio, B., Salsone, M., Gambardella, A. and Quattrone,
A., 2018. Comparison between Electrocardiographic
and Earlobe Pulse Photoplethysmographic Detection
for Evaluating Heart Rate Variability in Healthy
Subjects in Short-and Long-Term Recordings.
Sensors, 18(3), p.844.
Miao, F., Fu, N., Zhang, Y.T., Ding, X.R., Hong, X., He,
Q. and Li, Y., 2017. A novel continuous blood
pressure estimation approach based on data mining
techniques. IEEE J. Biomed. Health Inform, 21,
pp.1730-1740.
Selvaraj, N., Jaryal, A., Santhosh, J., Deepak, K.K. and
Anand, S., 2008. Assessment of heart rate variability
derived from finger-tip photoplethysmography as
compared to electrocardiography. Journal of Medical
Engineering & Technology, 32(6), pp.479-484.
Hsiao, C.C., Horng, J., Lee, R.G. and Lin, R., 2017,
October. Design and implementation of auscultation
blood pressure measurement using vascular transit
time and physiological parameters. In Systems, Man,
and Cybernetics (SMC), 2017 IEEE International
Conference on (pp. 2996-3001). IEEE.
DCBIOSTEC 2019 - Doctoral Consortium on Biomedical Engineering Systems and Technologies
14
