
GIS Application for Groundwater Vulnerability Assessment: Study Case
of Hammam-Bou-hadjar Area-NW of Algeria
Bouakkaz Khaled Salim
1
, Dehni Abdellatif
1
, Meguenni Bouhadjar
1
and Kessar Cherif
2
1
Department of S.I.R.S, Center of Space Techniques, Algerian Space Agency, Arzew, Algeria
2
Department of D.O.T, Center of Space Techniques, Algerian Space Agency, Arzew, Algeria
Keywords:
GIS, Vulnerability, GOD, Pollution, Hammam-Bou-hadjar.
Abstract:
This study deals with the vulnerability and pollution risk in the Hammam bouhdjar aquifer (Algeria). The
plain has been threatened by numerous pollution sources (urbanization, industry, farms, dumps, etc.) which
have unfortunately increased in the area, due to a lack of environmental protection measures, especially for
water resources. A map of groundwater vulnerability of the zone was carried out according to method (GOD)
using GIS processing. The obtained vulnerability map shows three zones of differing vulnerability degrees
accordingly to low, medium and high vulnerability which occupy respectively 51, 45 and 3 % of the total area.
1 INTRODUCTION
The socioeconomic development of a region predom-
inantly depends on the availability of good qual-
ity water .The evaluation of vulnerability is a mean
to gather complex hydrogeological data in a way
that can be used by non-specialist people such as
decision-makers (Hosseini M et al., 2018).The de-
velopment and sustainable management of ground-
water resources requires the application of modern
techniques.In recent years, vulnerability assessment
of groundwater aquifers considered as an essential
part for putting suitable plans to protect groundwa-
ter aquifers around the world (Al-Abadi A.M et al.,
2014). An integrated approach is implemented due
to the new geo-spatialization techniques and the geo-
graphical information system (GIS).
In the current context of the sustainable management
of water resources, the prediction of the risk of pol-
lution and the protection of these resources are of
paramount importance. For this, the medium and
long-term safeguarding of the quality of these re-
sources is necessary. This protection can be done, first
by delimiting the areas likely to be affected by pollu-
tion (Amharref M et al., 2007). Groundwater reser-
voirs are easily affected by pollution. The process is
slow but its effects are very dreadful (Baghvand et al.,
2010).
In agricultural areas, in particular, an excessive use
of fertilizers has directly or indirectly affected the
groundwater quality (Huang et al., 2012). But beyond
the quantitative aspect, it is also advisable to remain
vigilant on the level of the water quality consumed
by the populations (Diodato et al., 2013). However,
the prevention against groundwater pollution consti-
tutes an important phase to which scientists are doing
their best notably in studying the vulnerability of the
groundwater. They therefore, created classical scien-
tific methods (Etienne et al., 2009)
2 THE STUDY AREA
In this study we focus on the Hammam-Bou-hadjar
aquifer which is situated between Latitudes 35.23
◦
to 35.46
◦
N and Longitudes 0.85
◦
to 1.09
◦
E in the
southwestern part of the Oran watershed Basin, lo-
cated in the Northern West of Algeria (Figure 1).
The area is generally gently sloping low-lying and is
characterized by dry and wet climatic seasons which
spans from April to October and wet season between
November and March. Occasional rainfalls are of-
ten witnessed within the dry season due to its prox-
imity to the Mediterranean Sea. Rainfall forms the
major source of groundwater recharge in the area;
mean annual rainfall is greater than 200 mm. The
mean monthly temperature ranges from 36
◦
C in July
to 20
◦
C in February. Because of its proximity to
the coast, the area is under the influx of sea salt and
aerosols sprayed from the Mediterranean Sea; this can
potentially increase the salinity of the subsoil.
Salim, B., Abdellatif, D., Bouhadjar, M. and Cherif, K.
GIS Application for Groundwater Vulnerability Assessment: Study Case of Hammam-Bou-hadjar Area-NW of Algeria.
DOI: 10.5220/0007714002070211
In Proceedings of the 5th International Conference on Geographical Information Systems Theory, Applications and Management (GISTAM 2019), pages 207-211
ISBN: 978-989-758-371-1
Copyright
c
2019 by SCITEPRESS – Science and Technology Publications, Lda. All rights reserved
207
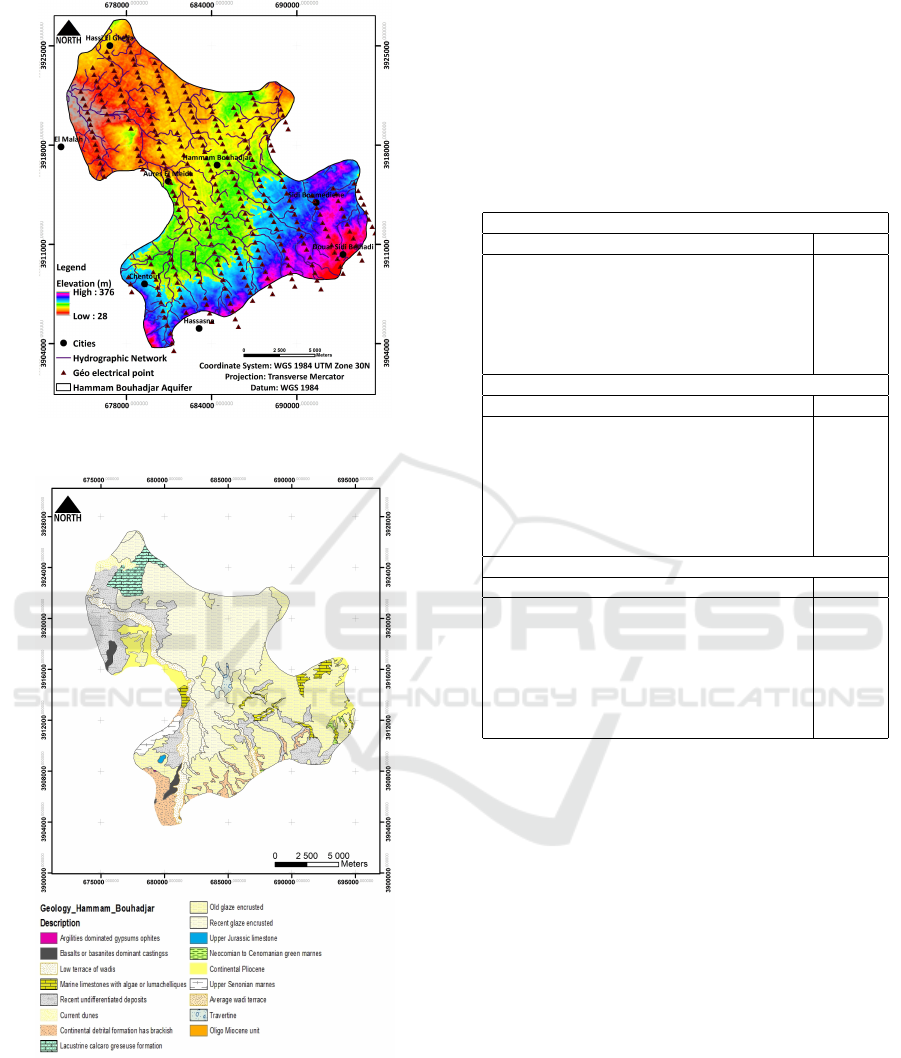
Figure 1: Localization of Hammam-Bou-hadjar aquifer.
Figure 2: The Study area geological map.
3 MATERIALS AND METHODS
In this work, the GOD method was chosen based on
the encouraging results obtained in previous project
carried out in our department. to assess the vulner-
ability of groundwater to pollution (Knouz N et al,
2017) This system was developed by Foster in 1987,
it is illustrated by Figure 2 which presents the vul-
nerability of the aquifer to the vertical percolation of
pollutants through the unsaturated zone and does not
deal with the lateral migration of pollutants in the sat-
urated zone.
Table 1: Attribution of notes for GOD model parameters.
G (Groundwater occurrence)
Characteristic’s Note
None aquifer 0
Artesian 0.1
Confined 0.2
Semi-confined 0.3
Free with cover 0.4-0.6
Free with cover 0.7-1
O (Overall lithology of aquifer)
Characteristic’s Note
Residual soil 0.4
Limon alluvial, loess, shale, fine limestone 0.5
Acolian sand, siltite, tuf, igneous, rock 0.6
Sand and gravel, sandstoe, tufa 0.7
Gravel 0.8
Limestone 0.9
Fracture or karstic limestone 1
D (Depth to water table)
Characteristic’s Note
< 2 1
2-5 0.9
5-10 0.8
10-20 0.7
20-50 0.6
50-100 0.5
> 100 0.4
This method is based on the identification of three cri-
teria:
• Groundwater type.
• Type of aquifer in terms of lithological factors
(Overall aquifer class);
• Depth to groundwater table.
The necessary elements for the groundwater protec-
tion scheme and for the classification of aquifer vul-
nerability are, according to this method; the soil type,
the geological formations of the unsaturated zone and
the depth of the aquifer.
The vulnerability index (I) is obtained according to
the following equation:
I = Ca ∗ Cl ∗ Cd (1)
Of which: Ca: Aquifer type rating, CI: Lithology rat-
ing and finally Cd: Depth of the water table.
The vulnerability increases with the index and the
classification is made in five categories, ranging from
GISTAM 2019 - 5th International Conference on Geographical Information Systems Theory, Applications and Management
208
0 to 1. According to the table 1, the range of possi-
ble values varies minimum vulnerability (0 values) to
maximum vulnerability (1 value).
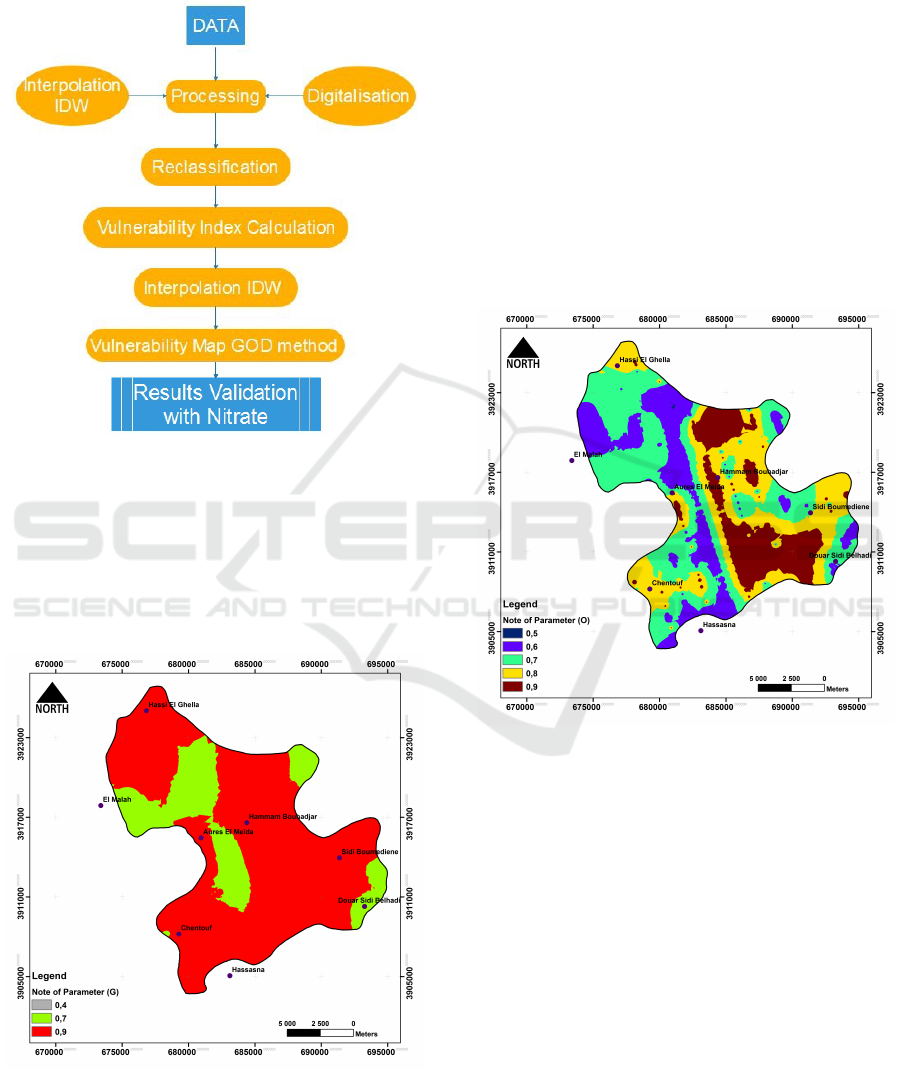
Figure 3: Procedure for developing the vulnerability map
using the GOD method.
4 RESULTS AND DISCUSSION
4.1 Groundwater Occurrence (G)
Figure 4: Groundwater occurrence map (parameter G).
The map of aquifer type was developed by inter-
preting using Inverse Distance Weighting IDW be-
tween 298 geoelectrics test of boreholes in the study
area.
Figure 4 shows different class according to the degree
of confinement, a reclassification by rate gave us the
map of the parameter groundwater occurrence.
Generally, the study area is characterized by two types
of groundwater occurrence, Aquifer with fairly per-
meable cover specifically in the Eastern zone and un-
confined aquifer in the West of El Malah and the SW
of Hammam-Bou-hadjar.
4.2 Overall Lithology of Aquifer (O)
Using the results of geoelectric’s tests the lithology
for each point was classified and the rate was at-
tributed, the map was created after interpolation.
Figure 5: Overall lithology of aquifer map (parameter O).
According to the map, the study area is characterized
by several type of lithology, the map obtained from
the digitization of the geological map 1/50000 of the
study area and a conversion to raster mode (Enabling
the reclassification according to the rating system of
the GOD method).
After reclassification, the map obtained (Figure 5)
shows that the study area contains different classes of
lithology, in the West side of Hammam-Bou-hadjar
the majority of soils are alluvional composed by clay
and silt, in the West of Douar Sidi Belhadi and the
North of Hammam-Bou-hadjar the limestone soil was
characterized.
GIS Application for Groundwater Vulnerability Assessment: Study Case of Hammam-Bou-hadjar Area-NW of Algeria
209
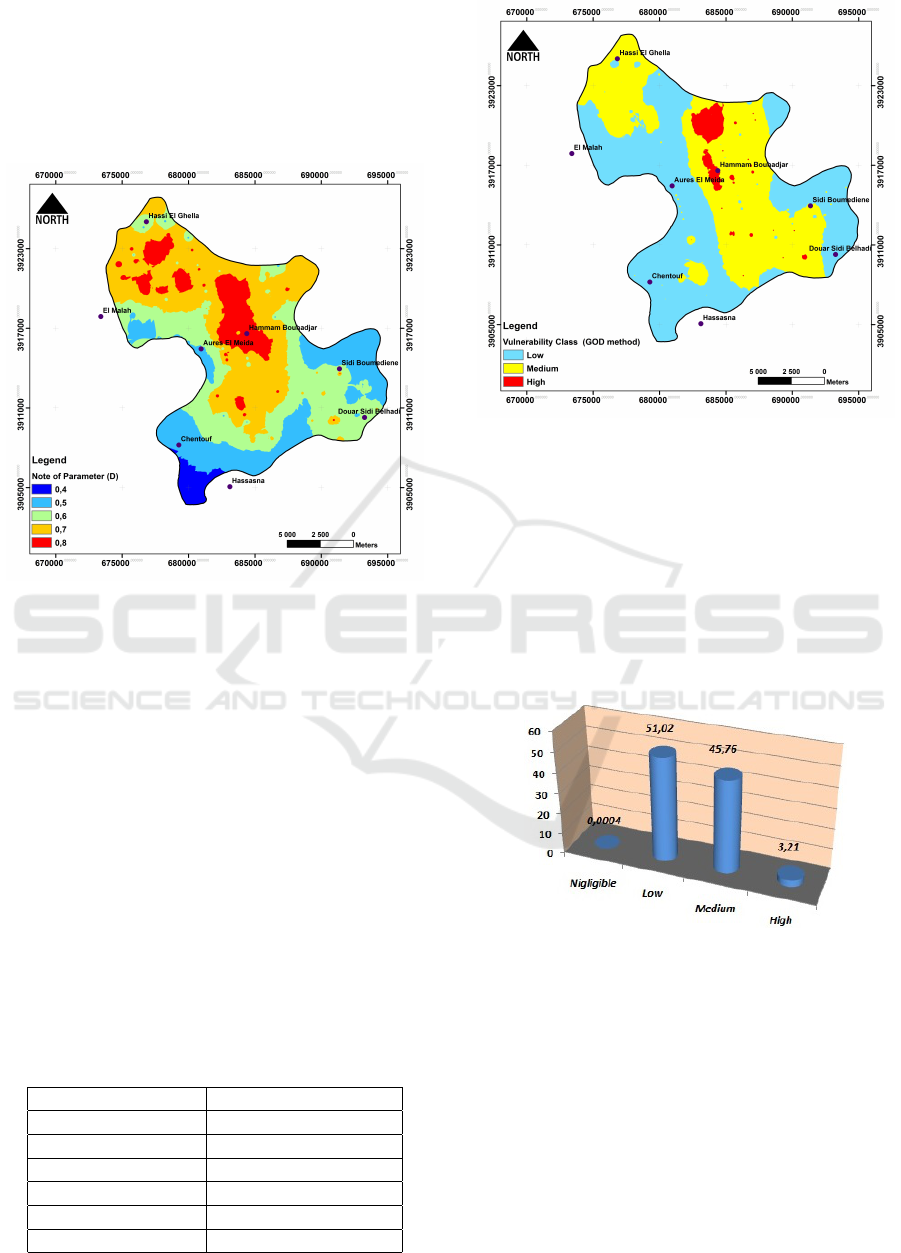
4.3 Depth to Water Table (D)
Figure 6 shows the map of the depth to the water table
parameter, which was established from the interpola-
tion of the piezometric measurements using the IDW
method.
Figure 6: Depth to water table (parameter D).
After the interpolation of the water levels of the wa-
ter table, a reclassification of each pixel was then car-
ried out according to the rating system of the GOD
method (Knouz N et al, 2017) The depth of the water
table decreases gradually from the SW and Est to the
north exactly in Hammam-Bou-hadjar area character-
ized by the lower depth between 2 and 5 meters.
5 THE VULNERABILITY MAP
The vulnerability map using (GOD) method has been
established after calculation the GOD index using
equation (1). The values of this index range from 0
to 0.7. They are reclassified according to the classifi-
cation system of the GOD method shown in Table 2
below:
Table 2: Classes of GOD Vulnerability Index.
Vulnerability Index Class of vulnerability
0 No vulnerability
0-0.1 Negligible
0.1-0.3 Low
0.3-0.5 Medium
0.5-0.7 High
0.7-1 Very High
Figure 7: Vulnerability map using GOD method of
Hammam-Bou-hadjar zone.
The analysis of figure 7 reveals that low-vulnerability
areas account for 51% of the total study area, mod-
erately vulnerable occupy 45.76 %, while high-
vulnerability areas occupy 3.2%; the high vulner-
ability is located exactly in the North and around
Hammam-Bou-hadjar city, medium vulnerability is
the extension of the high class to the South in the West
of Sidi Boumediene and Douar Sidi Belhadi.
Figure 8: Spatial distribution of vulnerability class in per-
cent.
6 RESULT VALIDATION
Nitrate is one of the most common indicators of hu-
man impact on groundwater resources (White P and
al., 2013). Nitrate is not naturally present in ground-
water over concentration of 5-8 mg L-1 and higher
concentrations have obviously been attributed to an-
thropogenic pollution (Busico G and al., 2019).In the
study area, agriculture is the most common activity
between the populations; the crops are irrigated and
GISTAM 2019 - 5th International Conference on Geographical Information Systems Theory, Applications and Management
210
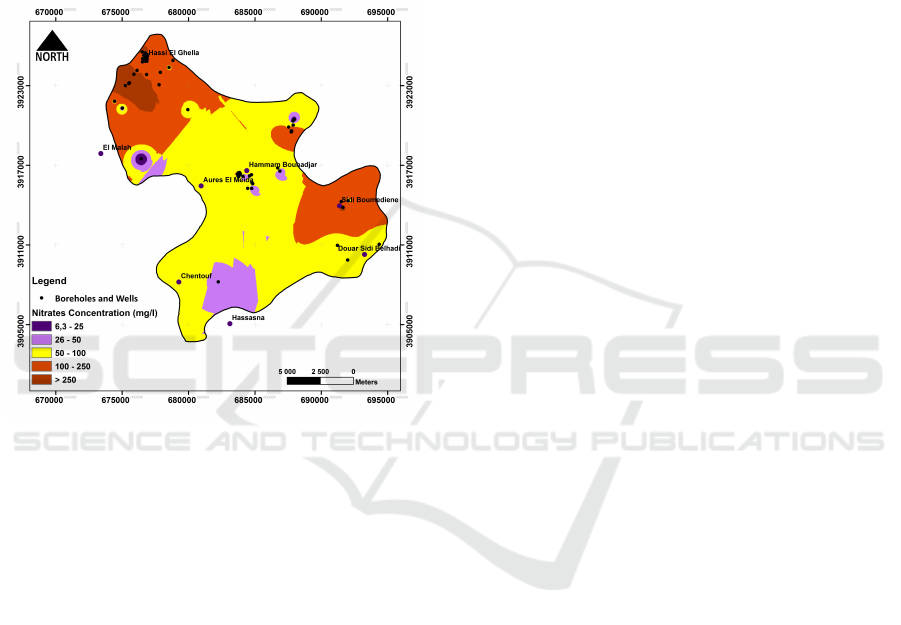
fertilized without monitoring the water quality and
fertilizer, specifically nitrogen. For this purpose we
have tried to validate the vulnerability map by the
GOD method by analyzing the distribution map of ni-
trates. The spatial analyst of nitrate distribution shows
according the map (Figure 9) that the area around
Hammam-Bou-hadjar is characterized by high con-
centration of nitrate, in the North very high concen-
tration are observed in Hassi El Ghella, the same case
in the SE in Sidi Boumediene zone.
Figure 9: Spatial distribution of nitrate concentration.
7 CONCLUSION
Vulnerability-study results of Hammam-Bou-hadjar
aquifer using GOD method show that the vulnera-
bility degree increases from South to the North and
N-E due to composition of unsaturated zone, 49%
of area is exposed to a medium to high vulnerabil-
ity. Lithological composition and type of aquifer
make Hammam-Bou-hadjar zone exposed to ground-
water pollution. intensive anthropogenic activity like
uncontrolled fertilization accelerate the groundwater
pollution. The protection of groundwater reservoir is
a priority to conserve the quality of water, this objec-
tive can be achieved by the protection of groundwa-
ter’s perimeters, monitoring of fertilization process in
agriculture and installing an evacuation plan of waste
water.
REFERENCES
l-Abadi A.M, Al-Shamma’a AM, Aljabbari MH.(2014).
A GIS-based DRASTIC model for assessing intrin-
sic groundwater vulnerability in northeastern Missan
governorate, southern Iraq. Applied Water Science:
7(1):89 - 101.
mharref M, Bernoussi A S (2007). Vulnerability and risk of
groundwater pollution, JSIRAUF actes.
aghvand A, Nasrabadi T, Nabibidhendi G, Vosoogh A, Kar-
bassi A, Mehradadi N (2010). Groundwater quality
degradation of an aquifer in Iran central desert. De-
salination 260(3):264-275.
oufekane A, SAIGHI O (2013). Assessment of groundwa-
ter pollution by nitrates using intrinsic vulnerability
methods: A case study of the Nil valley groundwater
(Jijel, North-East Algeria). African Journal of Envi-
ronmental Science and Technology. 7(10): 949-960.
usico G, Mastrocicco M, Cuoco E, Sirna M and Tedesco
D (2019). Protection from natural and anthropogenic
sources: a new rating methodology to delineate “Ni-
trate Vulnerable Zones”, Environmental Earth Sci-
ences 78:104.
iodato N, Esposito L, Bellocchi G, Vernacchia L, Fiorillo F,
Guadagno FM (2013). Assessment of the Spatial Un-
certainty of Nitrates in the Aquifers of the Campania
Plain (Italy). Am. J. Clim. Chang. 2:128-137.
tienne DK, Boyssoro H, Dibi B, Mahaman B, Biemi J
(2009). Contribution Methods Intrinsic Vulnerability
DRASTIC and GOD in The Study of Pollution by Ni-
trates in Bonoua Region (South-east of Ivory Coast).
Eur. J. Sci. Res. 31(1):157-171.
osseini M and Saremi A. (2018). Assessment and Estimat-
ing Groundwater Vulnerability to Pollution Using a
Modified DRASTIC and GODS Models (Case Study:
Malayer Plain of Iran), Civil Engineering Journal,
4(2): 433-434.
uang T, Pang Z, Edmunds WM (2012). Soil profile evo-
lution following land-use change: Implications for
groundwater quantity and quality. Hydrol. Process
27(8):1238-1252.
nouz N, Bachaoui EM, Boudhar A (2017). Cartography of
intrinsic aquifer vulnerability to pollution using GOD
method: Case study Beni Amir groundwoter, Tadla,
Morocco JMES, 8 (3): 1046-1053
hite P, Ruble C.L, Lane M.E (2013). The effect of changes
in land use on nitrate concentration in water supply
wells in southern Chester County, Pennsylvania. Env-
iron Monit Assess 185:643–651.
GIS Application for Groundwater Vulnerability Assessment: Study Case of Hammam-Bou-hadjar Area-NW of Algeria
211
